Article Text

Abstract
Background Owing to their severity, large vessel occlusion (LVO) strokes may be associated with higher costs that are not reflected in current coding systems. This study aimed to determine whether intravenous thrombolysis costs are related to the presence or absence of LVO.
Methods Patients who had undergone intravenous thrombolysis over a 9-year period were divided into LVO and no LVO (nLVO) groups based on admission CT angiography. The primary outcome was hospital cost per admission. Secondary outcomes included admission duration, 90-day clinical outcome, and discharge destination.
Results 119 patients (53%) had LVO and 104 (47%) had nLVO. Total mean±SD cost per LVO patient was $18 815±14 262 compared with $15 174±11 769 per nLVO patient (p=0.04). Hospital payments per admission were $17 338±13 947 and $15 594±16 437 for LVO and nLVO patients, respectively (p=0.4). A good outcome was seen in 33 LVO patients (27.7%) and in 69 nLVO patients (66.4%) (OR 0.2, 95% CI 0.1 to 0.3, p<0.0001). Hospital mortality occurred in 31 LVO patients (26.1%) and in 7 nLVO patients (6.7%) (OR 0.2, 95% CI 0.08 to 0.5, p<0.0001). 31 LVO patients (32.6%) were discharged to home versus 64 nLVO patients (61.5%) (OR 4.5, 95% CI 2.6 to 8, p<0.0001). Admission duration was 7.5±6.9 days in LVO patients versus 4.9±4.2 days in nLVO patients (p=0.0009). Multivariate regression analysis after controlling for comorbidities showed the presence of LVO to be an independent predictor of higher total hospital costs.
Conclusions The presence or absence of LVO is associated with significant differences in hospital costs, outcomes, admission duration, and home discharge. These differences can be important when developing systems of care models for acute ischemic stroke.
- Stroke
- Thrombolysis
- Economics
Statistics from Altmetric.com
Introduction
In the USA we are transitioning towards the 10th revision of the International Classification of Disease (ICD-10), which is a far more detailed system than its predecessor ICD-9.1 ,2 With ICD-10 one can categorize an underlying vascular occlusion in acute ischemic stroke (AIS), but one cannot differentiate between intravenous thrombolytic treatment for large vessel occlusions (LVO) versus small vessel occlusions (SVO).3 Identification of a major intracranial vascular occlusion in patients with AIS is associated with significantly worse outcomes compared with patients with no vascular occlusion or a small distal branch occlusion.4–6 Stroke patients with LVO are less responsive to intravenous (IV) thrombolysis with recombinant tissue plasminogen activator (rt-PA) and have higher morbidity and mortality rates.4 ,6–9 Although previous reports have indicated potential cost savings with the use of IV rt-PA,10 ,11 these analyses did not distinguish between strokes based on the presence or absence of LVO. The recently published randomized clinical trial, MR CLEAN, affirms the efficacy of endovascular treatment of LVO.12 It is important that, in the light of these positive data, systems of care for stroke include financial models in keeping with underlying stroke etiologies. We hypothesized that, due to a higher level of care, IV thrombolytic therapy of LVO strokes is associated with higher hospital costs than SVO strokes. We undertook this study to determine if there were significant distinctions in hospital costs in patients with AIS treated with IV rt-PA based on the presence or absence of LVO at the time of stroke presentation.
Materials and methods
Patient selection
Financial parameters and clinical data for stroke patients who only received IV thrombolysis at our tertiary rural academic medical center were retrospectively analyzed. Patients receiving additional endovascular therapy were not part of this study. Based on the ICD-9 diagnosis codes (433.01, 433.11, 433.21, 433.31, 433.81, 433.91, 434.01, 434.11, 434.91, 435.1, 435.2, 435.3, 435.8, 435.9), we determined that 4290 patients had been admitted with a discharge diagnosis of ‘ischemic stroke’ over a 12-year period. Of these, 319 patients received IV thrombolytic treatment with rt-PA (Alteplase Activase, Genentech, San Francisco, California, USA). Complete financial parameters pertaining to their hospital admissions were available for 246 of the 319 patients, for which the clinical outcome and follow-up were available in 223 patients. These patients constituted the study population.
Study endpoints
The primary endpoint for the study was the total hospital cost for patients with AIS secondary to a LVO versus those with no LVO (nLVO). The secondary outcomes included the functional outcome (90-day modified Rankin score, with a score of ≤2 representing a favorable outcome), length of stay, in-hospital mortality, and discharge destination for each patient.
Vessel occlusion site determination
The patients included in this study were divided into two groups based on their CT angiography (CTA) findings: LVO and nLVO groups. LVO was defined as an occlusion of the internal carotid artery terminus, the main stem of the middle cerebral artery, the proximal bifurcation branches (M1), the proximal M2 branches (M2), or vertebrobasilar artery circulation. The nLVO group included patients with SVO involving the distal M2 and M3 branches, the anterior cerebral artery branches, or patients in whom no vascular occlusion could be identified on the CTA. All suspected patients with AIS at our institution undergo baseline CTA with perfusion studies in addition to a routine non-contrast head CT scan as part of their investigation in the emergency department. The decision to administer IV rt-PA is not based on CTA findings, although these findings are typically available by the time IV rt-PA is administered.
Financial parameters
The following financial variables were collected for each patient:
The hospital charges for the admission (the total charges billed to the insurance carrier by the hospital).
The total cost of the admission. The total hospital cost comprises direct and indirect costs; the indirect cost relates to hospital cost overheads not directly related to the care of the patient (eg, utilities, human resources, legal costs).
The direct cost of the admission; this is the cost ‘directly’ related to patient care (eg, medications, devices, equipment, nursing).
The individual payers reimbursing the admission (eg, Medicare, Medicaid and commercial insurers).
The total payments received by the hospital for the admission.
The net financial gain/loss per admission, defined as the difference between the total payments received and the total cost of the admission.
Statistical analysis
The significance of simple bivariate associations was assessed using the Fisher exact test for categorical variables and the Student t test for continuous variables, as appropriate. The normality of the cost distribution data was assessed with the Shapiro–Wilk W test. This showed that the cost distribution for the LVO and nLVO groups was clearly not normal (p<0.0001 for all). We thus used the non-parametric Wilcoxon rank sum test to compare differences in costs for the two groups. The significance of difference was then assessed using a multivariable logistic regression analysis to control for comorbidities. The model used total cost and the response, LVO (yes or no), as the treatment and binary comorbidity variables for gender, age >80 years, diabetes, hypertension, hypercholesterolemia, atrial fibrillation, and smoking. All data analysis was performed using JMP statistical software V.11 (SAS Institute, Cary, North Carolina, USA).
Results
Of the 223 patients, there were 119 (53%) in the LVO group and 104 (47%) in the nLVO group. The baseline characteristics of the two cohorts are given in table 1.
Baseline characteristics of large vessel occlusion (LVO) and non-large vessel occlusion (nLVO) strokes
The most commonly used diagnosis related group (DRG) codes for the LVO and nLVO groups were CMS-14, MS-62, MS-61, MS-63, CMS-559, and MS-69 (table 2). Medicare was the overwhelmingly dominant payer in this patient population at our center (figure 1). Hospital charges and payments were not different between the two groups; however, the total and direct cost was significantly higher in the LVO group than in the nLVO group (figure 2).
Distribution of diagnosis related group (DRG) codes used for large vessel occlusion (LVO) and non-large vessel occlusion (nLVO) stroke admissions

Payer distribution. MC HMO, Medicare-HMO; BC/BS, Blue Cross/Blue Shield; COMM INS, Commercial Insurance-WV; PMA, Pennsylvania Manufacturers’ Association; CHAMPUS, Civilian Health And Medical Program of the Uniformed Services; DPW-WV, Department of Public Works-WV; HMO, Health Maintenance Organization.

Financial parameters for large vessel occlusion (LVO) and no large vessel occlusion (nLVO) groups showing the difference between charges, total cost, direct cost and payments for patients receiving intravenous thrombolysis in the two groups. The bars represent the mean and the vertical lines represent SE of mean.
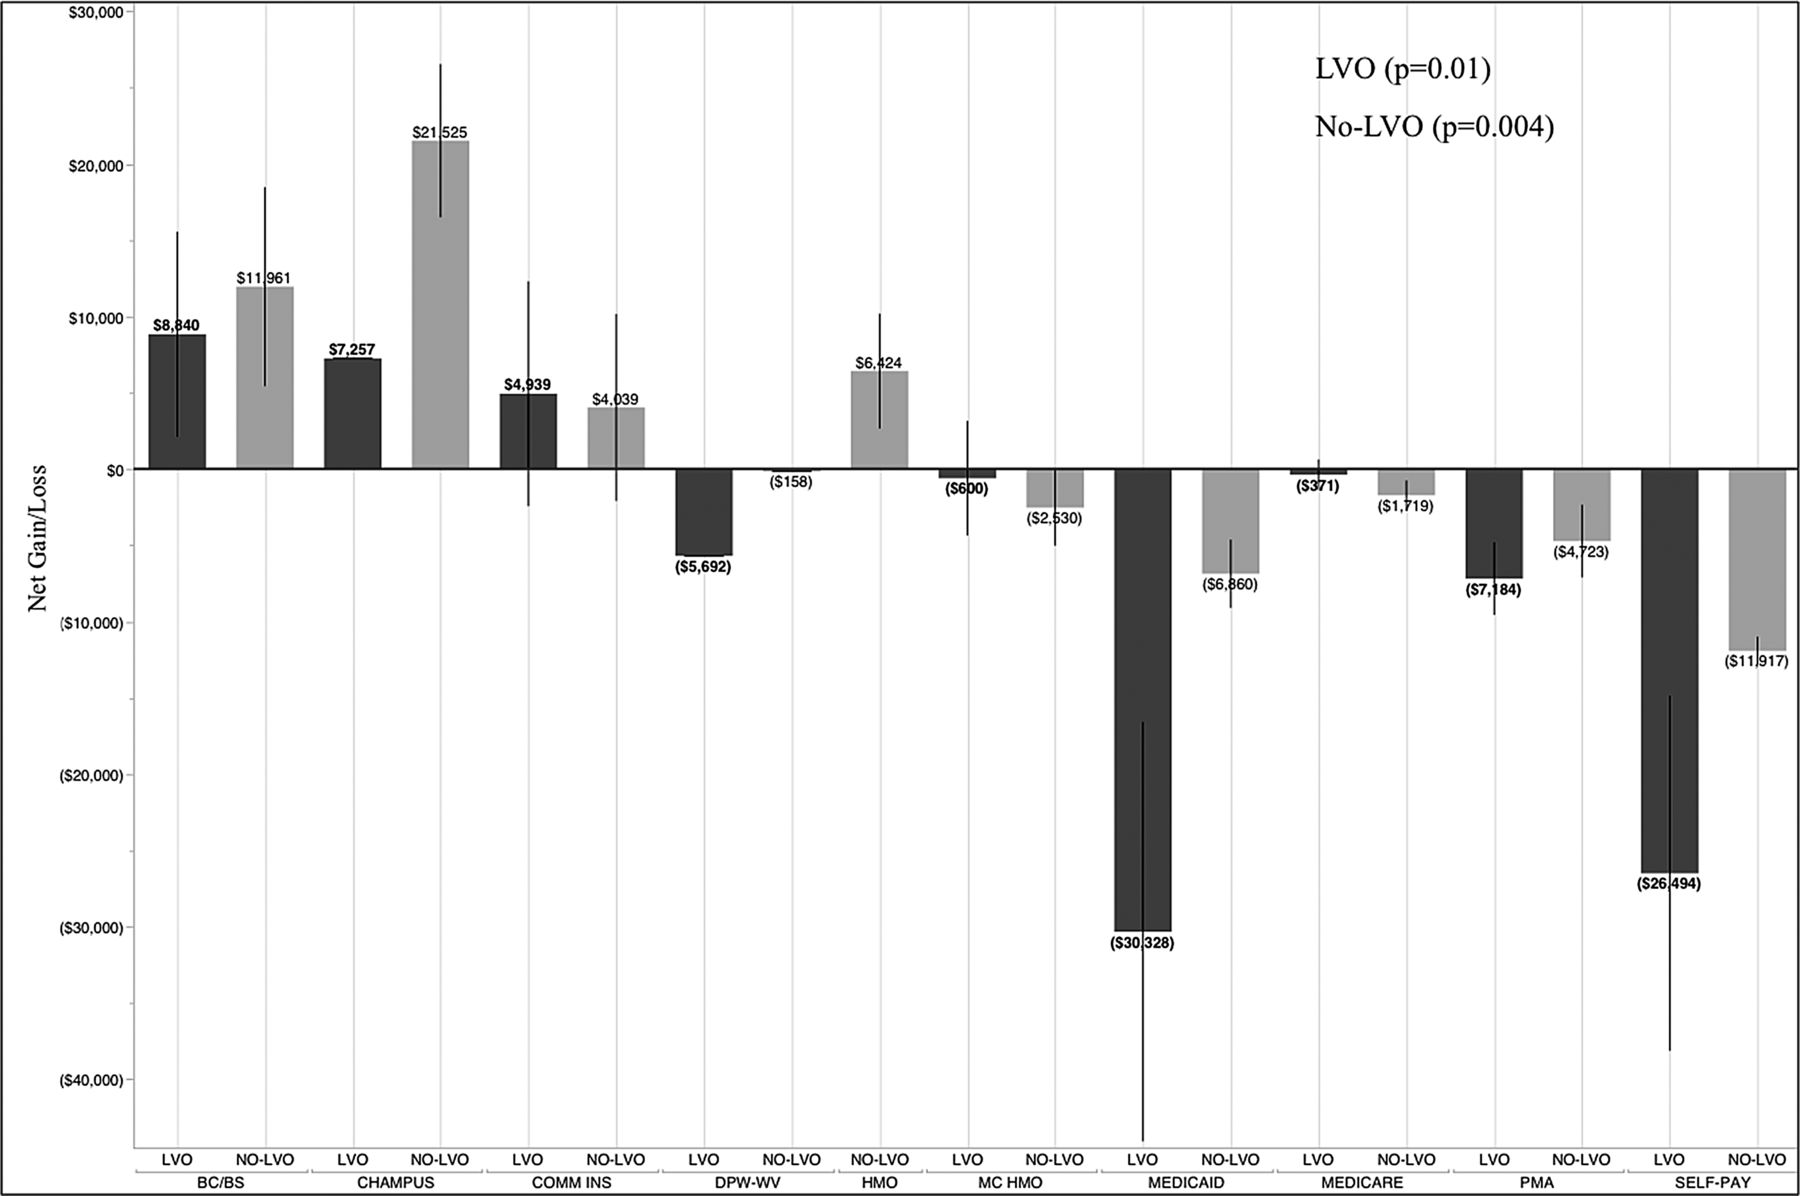
The payments received by the hospital varied significantly with the payer for both groups (figure 3); the highest payments were associated with Blue Cross/Blue Shield. For the entire cohort, the hospital averaged a mean±SD financial loss (difference between payments and total cost) of $592±12 565. There was a mean±SD loss of $1477±12 470 for the LVO group as opposed to a mean±SD gain of $420±12 658 for the nLVO group (p=0.2). The financial gain/loss varied significantly by the payer (figure 4). The total cost had a strong positive correlation with the length of stay (R2=0.72, p<0.0001) and a very weak correlation with the admission National Institute of Health Stroke Scale score (R2=0.05, p=0.001). There was no correlation between age and total cost.

Total payments received by the hospital for different payers. MC HMO, Medicare-HMO; BC/BS, Blue Cross/Blue Shield; COMM INS, Commercial Insurance-WV; PMA, Pennsylvania Manufacturers’ Association; CHAMPUS, Civilian Health And Medical Program of the Uniformed Services; DPW-WV, Department of Public Works-WV; HMO, Health Maintenance Organization. The bars represent the mean and the vertical lines represent SE of mean.

Net financial gain/deficit (total cost minus total payments) by the hospital for different payers. MC HMO, Medicare-HMO; BC/BS, Blue Cross/Blue Shield; COMM INS, Commercial Insurance-WV; PMA, Pennsylvania Manufacturers’ Association; CHAMPUS, Civilian Health And Medical Program of the Uniformed Services; DPW-WV, Department of Public Works-WV; HMO, Health Maintenance Organization. The bars represent the mean and the vertical lines represent SE of mean.
A good outcome was seen in 33 patients (27.7%) in the LVO group compared with 69 patients (66.4%) in the nLVO group (OR 0.2, 95% CI 0.1 to 0.3, p<0.0001). In-hospital mortality was observed in seven patients (6.7%) in the nLVO group and in 31 patients (26.1%) in the LVO group (OR 0.2, 95% CI 0.08 to 0.5, p<0.0001). Mean±SD admission duration was 7.5±6.9 days in the LVO group and 4.9±4.2 days in the nLVO group (p=0.0009). The difference in total cost between the two groups was dependent on in-hospital mortality. For patients who survived the admission (n=185), the mean±SE total cost was $19 534±1195 in the LVO group (n=88) versus $13 952±1138 in the nLVO (n=97) group (p=0.002). There was no significant difference in total cost among patients who died (n=38) during admission ($32 098±7172 in the nLVO group (n=7) versus $16 772±3408 in the LVO group (n=31); p=0.9). For patients who survived the admission, the mean±SD length of stay was 8.3±7 days for the LVO group and 4.5±3.7 days for the nLVO group (p<0.0001). Home discharge was observed in 31 (32.6%) patients in the LVO group and 64 (61.5%) patients in the nLVO group (OR 4.5, 95% CI 2.6 to 8, p<0.0001).
After controlling for comorbidities, we performed a multivariable logistic regression analysis to determine the effect of arterial occlusion site on total cost in patients who survived the admission. The model used total cost and the response, LVO (yes or no), as the treatment and binary variables for gender, age >80 years, diabetes, hypertension, hypercholesterolemia, atrial fibrillation, and smoking. The residuals from that model were consistent with the normal distribution and the resulting p value for LVO was significant (F=4.757, p=0.0314) for it to be independently predictive of total cost.
Discussion
Compared with ICD-9, ICD-10 is substantially more granular in terms of classifying AIS based on the underlying vascular etiology (http://cms.gov/Medicare/Coding/ICD10/index.html). For example, cerebral infarction due to embolic occlusion of the right middle cerebral artery has a separate diagnosis code (163.411) from the left middle cerebral artery (163.412). In contrast, in ICD-9 all embolic cerebral infarction was coded as 434.11. However, ICD-10 fails to make corresponding progress in the procedure codes. In ICD-9, AIS thrombolysis was coded by the procedure code ‘Injection or infusion of thrombolytic agent—99.10’. In ICD-10 there is some sub-categorization of thrombolytic administration —for example, central versus peripheral or arterial versus venous—but, when it comes to AIS, there is no categorization of IV rt-PA administration for a LVO versus SVO stroke. This lack of differentiation is significant as LVO strokes incur significantly higher morbidity and mortality than SVO strokes. Our results indicate that thrombolytic treatment of LVO strokes is also significantly more costly than strokes without LVO due to a higher level of acuity required in caring for these patients. The difference in cost between the two entities is not necessarily related to the thrombolytic treatment itself but is mainly due to the underlying severity of LVO versus nLVO strokes. However, recognition of LVO stroke as a separate disease entity is important as it differs from nLVO stroke in all measures of outcome, whether clinical or financial. Thrombolytic treatment of a patient with LVO stroke carries the same procedure code as a patient with nLVO stroke, but the cost of caring for the patient with LVO stroke is higher than for the patient with nLVO stroke. The reimbursements are thus not in alignment with the hospital costs.
A LVO is estimated to be the underlying cause in almost half of patients with AIS receiving IV thrombolysis.4–6 Administration of IV rt-PA to these patients is not predicated on documenting the underlying etiology since none of the clinical trials to date have tested the efficacy of IV rt-PA based on the presence or absence of major cerebrovascular occlusion,13 ,14 and also because routine CTA has only recently emerged as a reliable modality in localizing vascular occlusion in AIS5 ,8 without delaying thrombolytic therapy.6 ,15 As a subgroup, patients with LVO stroke are less responsive to IV thrombolysis4 ,6 ,16 ,17 and carry a significantly higher morbidity and mortality.4 ,6 ,17 Furthermore, a higher rate of poor clinical outcomes among this IV thrombolysis group is associated with a higher cost of care.18 ,19 Our study demonstrates significantly worse outcomes, higher mortality, and longer admission duration for patients with LVO stroke who received IV rt-PA than in those with nLVO stroke. One can speculate that the higher cost is not only driven by the longer length of stay but also by a higher level of care required for these patients. There was a significantly lower rate of home discharge among the patients with LVO stroke. We do not have the cost associated with long-term nursing or rehabilitation care, but it is reasonable to assume that a higher rate of discharge to nursing facilities will add to the total cost of care for these patients. The higher cost for the LVO group is magnified for patients who survived the admission, again due to a combination of longer length of stay and the higher level of care required for the LVO group compared with the nLVO group. In contrast, the cost was lower for patients with LVO stroke who died during the admission, reflecting the observation that they died with a shorter admission duration than the patients with nLVO stroke who died after a longer hospital stay.
While our costs for the LVO group of patients were significantly higher than for the nLVO group, there was no significant difference in the hospital reimbursement. The higher cost without higher reimbursement resulted in an average deficit of $1477 per LVO patient for the hospital. Our payments were significantly different based on the payer, with relatively lower payments associated with Medicare and Medicaid. This is chiefly because federal and state payers such as Medicare and Medicaid are funded or subsidized by the federal government and have set payments which are not subject to negotiations or change. However, a hospital can negotiate a higher rate of payment for a given procedure or diagnosis with non-federal or commercial insurances. In our study, two-thirds of the population was on Medicare or Medicaid accounting for a majority of the hospital deficit associated with thrombolytic stroke care. An argument can be made that LVO stroke thrombolysis with IV rt-PA should be recognized as a separate procedure. In terms of clinical outcome, admission duration, long-term rehabilitation, and total cost of care, this distinction is warranted. Moreover, this distinction would allow comparison with other treatments targeted at LVO strokes such as endovascular therapy, which may be associated with different outcomes17 or cost profiles.19
Limitations of the study
This study reports financial data from a single academic rural tertiary hospital. A hospital's cost/charge ratio and reimbursement are affected by these classifications and thus may not be universally applicable, especially for hospitals outside the USA. This study is not a cost-effective analysis, but rather more of an academic hospital's perspective on providing advanced stroke care for over a decade. We have a diverse payer mix, albeit dominated by Medicare; this, along with the wide variety of DRG codes used, is not optimal for evaluating the financial impact of one particular DRG code or payer.
Conclusion
The diagnosis codes in ICD-10 classify AIS based on the site of vascular occlusion, but the procedure codes associated with thrombolytic therapy fail to make the distinction between a major or a minor stroke based on LVO or SVO. Our data indicate a significantly higher hospital cost associated with IV thrombolytic treatment of AIS secondary to LVO. A lack of correspondingly higher reimbursement may result in hospitals running net deficits for treating LVO strokes. At the same time, these patients have less favorable responses to IV thrombolysis than those with SVO strokes, with worse clinical outcomes, a higher mortality rate, and a higher discharge rate to skilled nursing facilities, further adding to the cost. With widespread availability of rapid and accurate neuroimaging such as CTA, it is now possible to identify patients with LVO AIS at the time of presentation. Prospective recognition of this subgroup may allow for improved treatment planning, inter-facility transfers, and prognostic expectations for long-term care. The procedure codes and billing systems should reflect these financial realities associated with treatment of LVO strokes.
References
Footnotes
Contributors ATR contributed to study design, statistical analysis, and manuscript preparation. KE contributed to data collection. JER contributed to manuscript preparation and editing. GRH contributed to statistical analysis.
Competing interests None.
Ethics approval Ethical approval was obtained from the institution review board.
Provenance and peer review Not commissioned; externally peer reviewed.