Article Text

Abstract
Objectives The aim of the present study was to identify image-based morphological parameters and anatomical locations associated with intracranial aneurysm (IA) rupture.
Methods Nine morphological parameters and aneurysm location were evaluated in 150 patients with saccular IAs (82 unruptured, 68 ruptured) using three-dimensional geometry. Aneurysm location and morphological parameters including size, aspect ratio, size ratio, height–width ratio, flow angle, aneurysm inclination angle, parent artery angle, vessel angle, and aneurysm shape were explored to identify a correlation with aneurysm rupture. These factors were analyzed using a two-tailed independent Student t test or the χ test for significance. Significant factors were further examined using logistic regression analysis. Additionally, receiver operating characteristic (ROC) analysis was performed to evaluate each parameter.
Results Statistically significant differences were observed in ruptured and unruptured groups for aspect ratio, size ratio, height–width ratio, flow angle, aneurysm inclination angle, vessel angle, aneurysm shape, and aneurysm location. Logistic regression analysis further revealed that size ratio (OR 1.66; 95% CI 1.05 to 2.64), height–width ratio (OR 14.22; 95% CI 2.67 to 75.88), aneurysm inclination angle (OR 1.04; 95% CI 1.01 to 1.07), aneurysm shape (OR 4.68; 95% CI 2.44 to 8.98), and aneurysm location (OR 1.60; 95% CI 1.15 to 2.23) had the strongest independent correlation with ruptured IA. The ROC analysis showed that the size ratio and flow angle had the highest area under the curve, with values of 0.735 and 0.730, respectively.
Conclusions Size ratio, height–width ratio, aneurysm inclination angle, aneurysm shape, and aneurysm location might be important for discriminating between ruptured and unruptured aneurysms. Further investigation will determine whether these morphological parameters and anatomical locations will be reliable predictors of aneurysm rupture.
- Aneurysm
Statistics from Altmetric.com
Introduction
The annual incidence of subarachnoid hemorrhage resulting from the rupture of intracranial aneurysm (IA) is estimated at nine per 100 000 affected individuals.1 Even with the best available medical care, the majority of individuals with subarachnoid hemorrhage die or become severely disabled. Although an adequate treatment for IA is urgently needed, the postoperative morbidity and high treatment costs must be carefully considered for the development of treatment strategies.2–4 The rupture rate of IA is significantly lower than the incidence rate. Indeed, IA affects approximately 2–5% of the entire population,5 but only 1–3% of all IAs actually rupture.6 ,7 Recently, Greving et al8 summarized the results of six prospective studies, reporting an average observed 1-year risk of aneurysm rupture of 1.4% and a 5-year risk of 3.4%. Thus, most IAs do not require clinical intervention. However, reliable knowledge about the risks of IA rupture in different populations will facilitate the development of planning, screening, and prevention strategies and will provide information for the prognosis of individual patients.
The most ubiquitous parameter is IA size. Although aneurysms exceeding 7 or 10 mm in size are considered to be dangerous, several studies have shown that a large percentage of ruptured aneurysms are, in fact, smaller than 7 mm.9–12 The relationship between rupture risk and IA size has not been completely elucidated. Interestingly, Ujiie et al13 reported that the aspect ratio (AR) might be useful in predicting imminent aneurysmal rupture, while Dhar et al14 reported that the size ratio (SR) and aneurysm angle were meaningful morphological metrics for the assessment of rupture risk. Consistent with previous studies, we reported the importance of several morphological parameters and intracranial locations for IA rupture.
Materials and methods
Patient population
Between January 2013 and December 2014, three-dimensional rotational digital subtraction angiography (DSA) images (Philips Allua Xper, The Netherlands) were obtained from patients with saccular terminal or sidewall IA treated at Huashan Hospital. One hundred and fifty consecutive patients with 82 unruptured and 68 ruptured aneurysms met these criteria. Once diagnosed as IA, DSA was performed in all patients in our hospital who were randomly enrolled in the study. Of the 150 saccular aneurysms, 125 were sidewall type and 25 were terminal type. Patients with multiple aneurysms were classified according to the size and location of the largest aneurysm observed.
Definition of parameters
Nine morphology parameters and aneurysm location were defined in our study. All morphology parameters were evaluated by two neurosurgeons (FX, BL) and one radiology physician (QX) (figure 1).
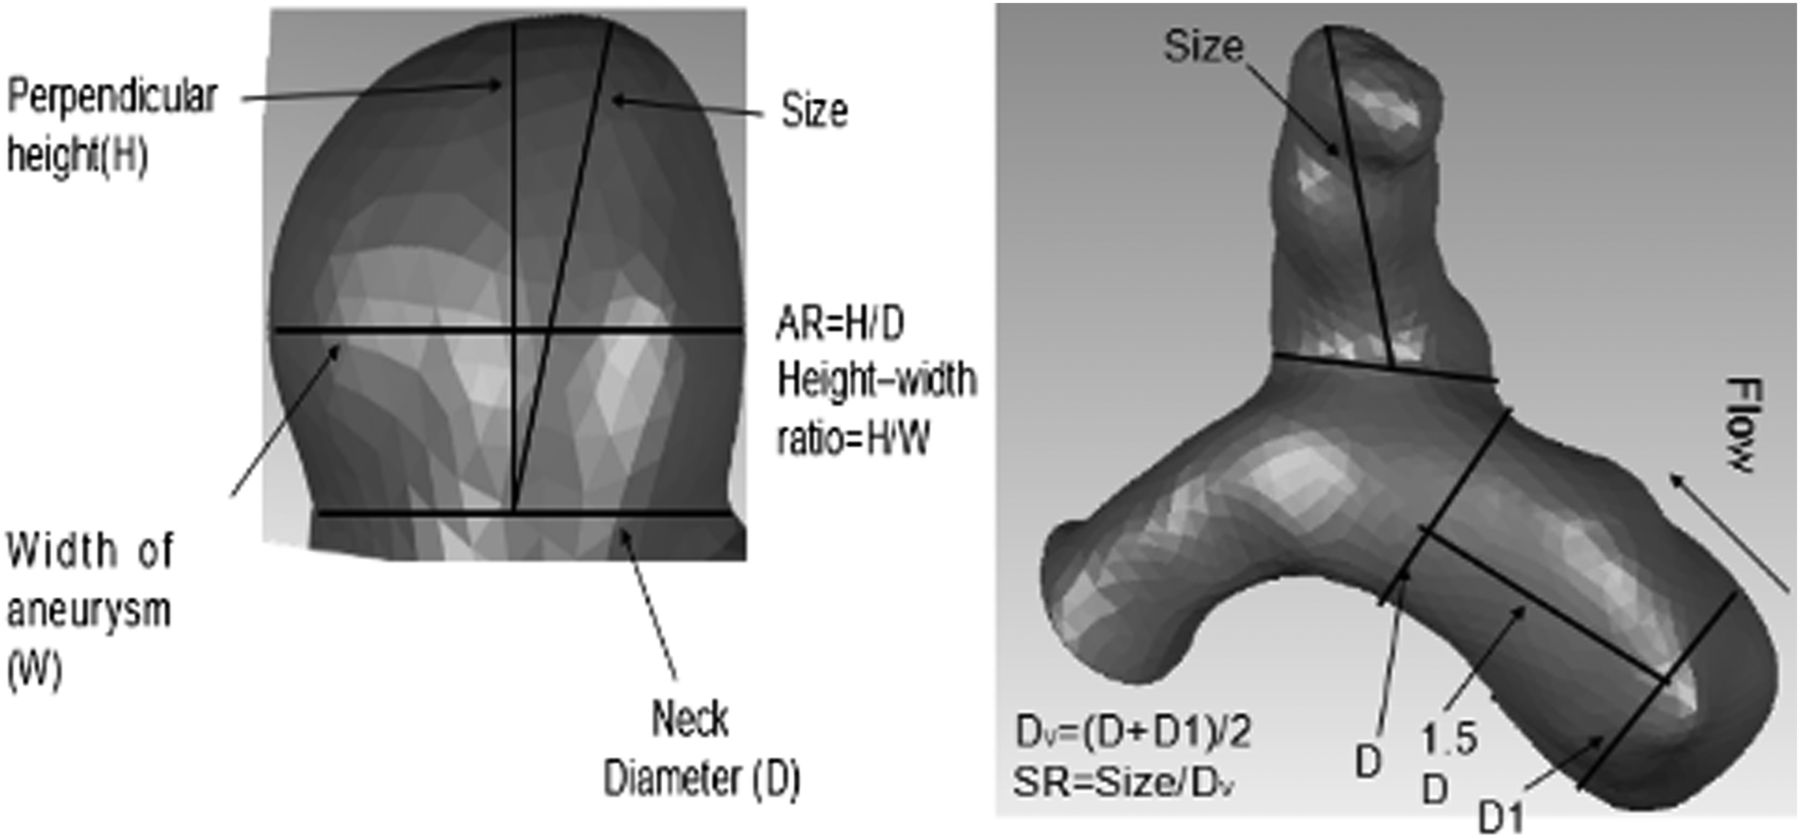
Definition of parameters. AR, aspect ratio; SR, size ratio; H/W, height–width ratio.
Size
According to Raghavan et al,11 aneurysm size was defined as the maximum distance of the dome from the aneurysm neck plane.
Aspect ratio (AR)
The AR was calculated from the maximum perpendicular height divided by the neck width, where the neck width is twice the average length from the aneurysm neck centroid to the edge of its neck.13
Size ratio (SR)
The SR was calculated from the maximum aneurysm height divided by the average vessel diameter, in accordance with Dhar et al.14 Here, the average vessel diameter could be obtained by measuring two vessel diameters (inflow vessel diameters (D) at the proximal bilateral neck and D1 at 1.5D upstream) and taking their average value. The maximum height is the maximum distance from the cross-section of the aneurysm neck to any point on the aneurysm dome. In the case of a terminal aneurysm, the average diameter of the feeding artery and the other branching vessels was used for the ‘average vessel diameter’ in our study.
Height–width ratio
Height–width (H/W) ratio was defined as the ratio of height (the maximum perpendicular distance of the aneurysm dome from the neck plane) to the width of aneurysm, where the aneurysm width was the maximum width parallel to the neck.15
Aneurysm shape
Aneurysm shape was categorized into regular, irregular, and with a daughter sac. Regular aneurysm was defined as spherical or ellipse. An aneurysm was defined as being irregularly-shaped when blebs, aneurysm wall protrusions, or multiple lobes were present but without a daughter aneurysm. An irregularly-shaped aneurysm with a daughter sac was categorized as aneurysm with daughter sac.
Aneurysm angles
We defined four aneurysm angles—namely, flow angle, aneurysm inclination angle, parent artery angle, and vessel angle (figure 2). The flow angle (θF) was defined as the angle between the inlet vessel centerline and the maximum length,16 the aneurysm inclination angle (θA) is the angle of inclination between the aneurysm and its neck plane,14 the parent artery angle (θP) was defined as the angle between two parent arteries,14 and the vessel angle (θV) is the angle between the inlet vessel centerline and the neck plane.17 It should be noted that these angles were only defined for sidewall IAs. When the aneurysm angles were measured, the correct viewing plane was determined as follows: (1) first, the image was rotated until the aneurysm neck plane was seen as a line which means that the aneurysm neck plane was perpendicular to the viewing plane (2) then, the image was rotated about an axis of rotation, which was defined perpendicularly to aneurysm neck plane through the neck centroid. The aneurysm angles were measured based on the viewing plane when the lowest value of the apparent vessel angle was chosen.14

Definition of aneurysm angles in wide-necked and narrow-necked aneurysms.
Aneurysm location
In our study the IAs were divided into five groups: posterior communicating artery, anterior communicating artery, ophthalmic artery, middle cerebral artery, and other location.
Statistical analysis
The five morphological parameters described above (size, AR, SR, H/W, aneurysm shape) were calculated for each IA whereas the other four (θF, θA, θP, θV) were only calculated for sidewall IAs. Continuous variables and categorical variables were reported as mean±SD and frequency/percentage, respectively, for each group. Scatter plots for all parameters were used between ruptured and unruptured IAs and data outliers were identified for each parameter from box-and-whisker plots. The horizontal line within the box-and-whisker plots represents the median (50th percentile) while the upper and lower boundaries of the box-and-whisker plots represent the 75th and 25th percentiles, respectively. The whiskers on the upper or lower side represent those data points which lie within 1.5 box heights from the 75th or 25th percentile points. Data points located further outside the box (shown by an asterisk or circle) are regarded as outliers and those data were not further examined by the Student t test or receiver operating characteristic (ROC) analysis. The Student t test was used to examine the difference in aneurysm size, AR, SR, H/W and aneurysm angle between the two groups. The χ2 test was performed for aneurysm location and shape to assess the statistical significance. p Values and 95% CIs from the t test or χ2 test were calculated and reported. The factors found to be significant (p<0.05) were further analyzed using multivariable logistic regression. The logistic regression was performed on size, AR, SR, H/W for all IAs, but a second run on all factors was performed on sidewall IAs only. ROC analysis was also performed for all parameters to discriminate between ruptured and unruptured aneurysms.
Results
To clearly present parameter values for all cases, we examined the correlation between each variable and size, which is a well-known factor for predicting the risk of aneurysm rupture. We observed an obvious correlation between size and AR (r=0.494, 95% CI 0.374 to 0.651) and between size and SR (r=0.767, 95% CI 0.700 to 0.829). Subsequent aneurysm ruptures associated with the baseline characteristics of the patient population are shown in table 1. One hundred and fifty patients of mean age 56 years (range 19–82 years) were analyzed. One hundred and five patients (70%) were women and 68 aneurysms (45%) had ruptured. Fifty-five (36.7%) of the 150 aneurysms were located on the ophthalmic artery, 19 (12.7%) at the middle cerebral artery, 24 (16.0%) at the anterior communicating artery, 38 (25.3%) at the posterior communicating artery, and 14 (9.3%) at other locations. The mean values and SDs are presented in table 2. Compared with unruptured aneurysms, ruptured aneurysms had significantly higher SR (2.01±0.91 vs 1.22±0.77, p<0.001), AR (1.26±0.45 vs 0.97±0.39, p<0.001), H/W (1.07±0.36 vs 0.81±0.22, p<0.001), θF (115.78±27.52 vs 93.72±20.17, p<0.01), θA (97.79±25.37 vs 81.47±17.74, p<0.01), and θV (26.29±17.94 vs 19.68±13.72, p=0.028). Size and θP were not significantly different. The χ2 test showed a significant relationship between the aneurysm location (χ2=40.82, p<0.001) or aneurysm shape (χ2=42.44, p<0.001) and aneurysm rupture (table 3). Box-and-whisker plots of each parameter for ruptured and unruptured IAs are shown in figure 3. The outliers were not further examined using either the Student t test or ROC analysis.
Patient and aneurysm characteristics
Results from the statistical analysis for all parameters
Locations and shape of aneurysms
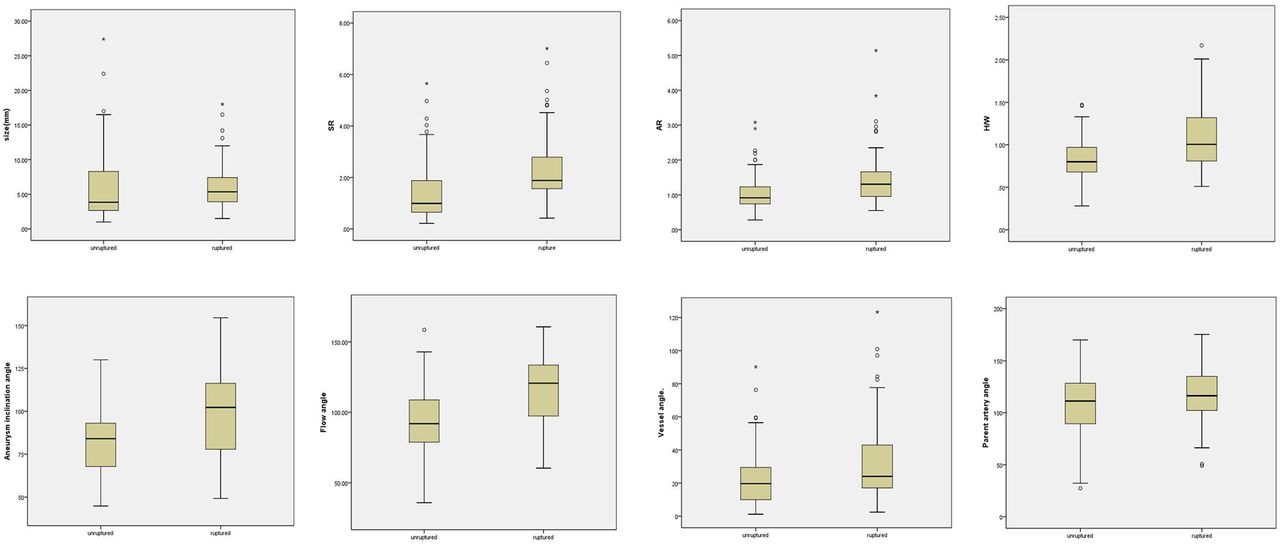
Box plots for the morphology parameters. AR, aspect ratio; SR, size ratio; H/W, height–width ratio.
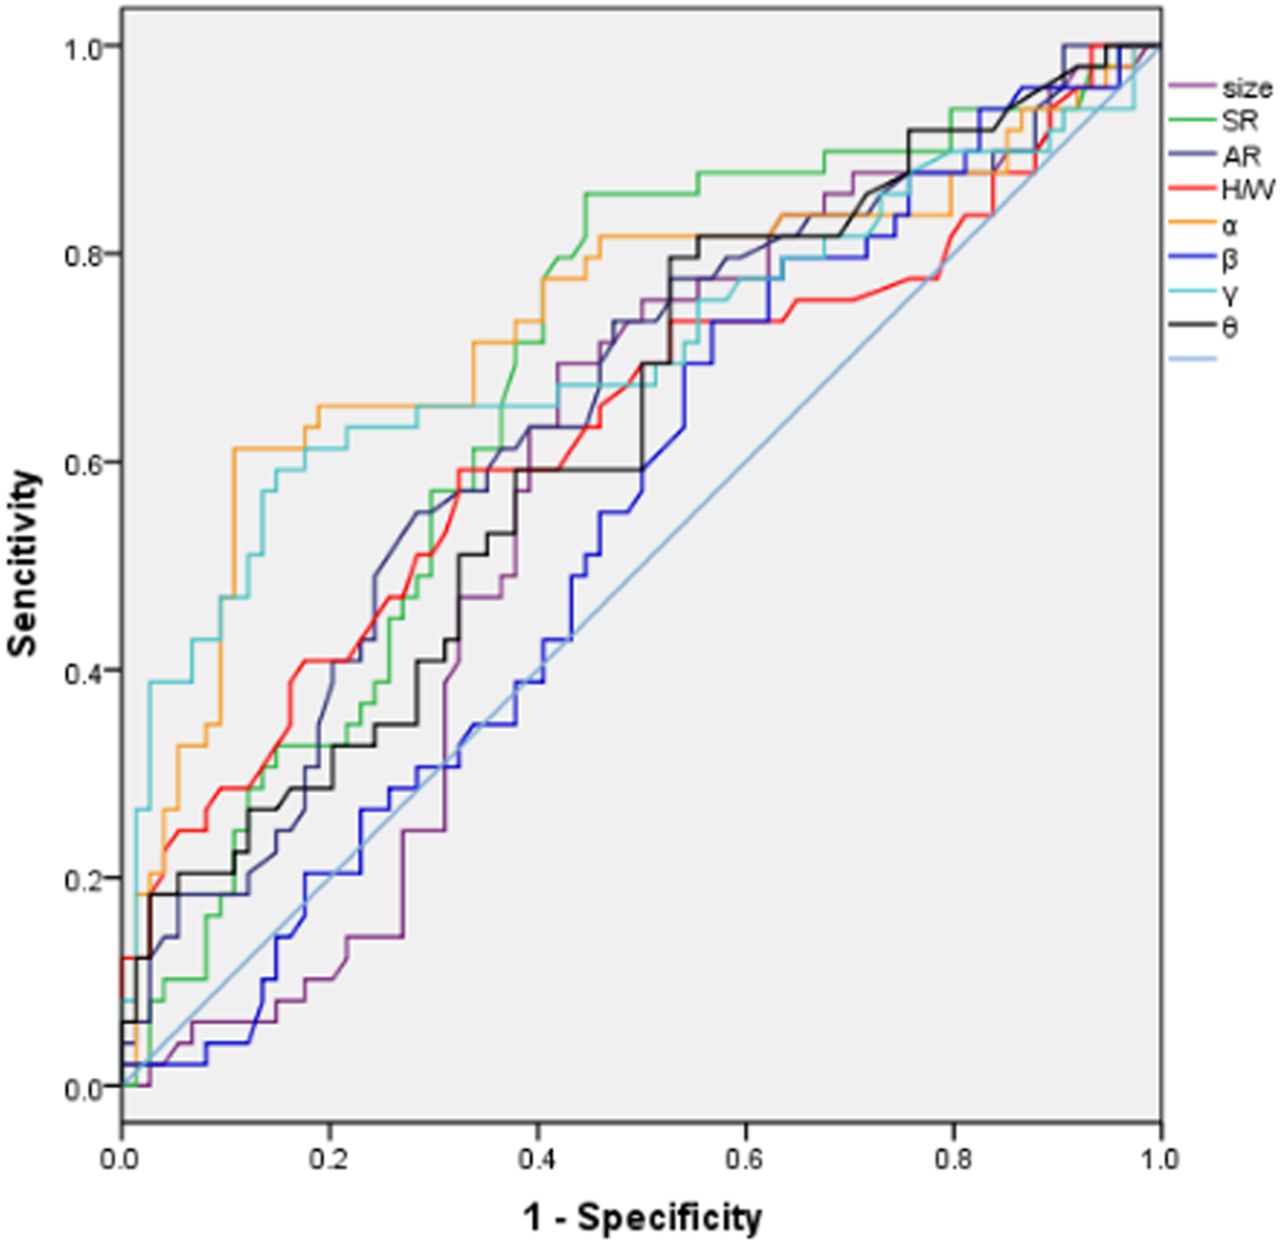
A ROC analysis was performed on each of the parameters to identify optimal thresholds for IA rupture (figure 4). In order to quantitatively discriminate between those parameters in the two subgroups, we calculated the area under the curve (AUC)—that is, the area under the ROC curve. The results are shown in table 2 and figure 4. SR and θF had the highest AUC values (0.735 and 0.730, respectively), whereas both θP and size had small AUC values (0.551 and 0.603, respectively). Notably, the null predictor had an AUC of 0.5.

Receiver operating characteristic curves for all parameters. A larger area under the curve (AUC) implies higher sensitivity and higher specificity for that parameter to discriminate between the two subgroups (ruptured and unruptured). Dashed line, null predictor. AR, aspect ratio; SR, size ratio; H/W, height–width ratio.
The significant variables, determined using the Student t test and χ2 test, were further examined using multivariate logistic regression analysis to identify parameters showing significant correlation with ruptured IAs, controlling for correlations between variables. The regression was performed for SR, AR, H/W, aneurysm location, and aneurysm shape for all IAs (table 4) and, in a second run, the regression was performed for SR, AR, H/W, θF, θA, θV, aneurysm location, and aneurysm shape, but only for sidewall IAs (table 5). Logistic regression analysis further revealed that the SR (OR 1.66; 95% CI 1.05 to 2.64), H/W ratio (OR 14.22; 95% CI 2.67 to 75.88), θA (OR 1.04; 95% CI 1.01 to 1.07), aneurysm shape (OR 4.68; 95% CI 2.44 to 8.98), and aneurysm location (OR 1.60; 95% CI 1.15 to 2.23) had the strongest independent correlation with ruptured IA.
Results from the multivariate logistic regression analysis for all intracranial aneurysms
Results from the multivariate logistic regression analysis for all sidewall aneurysms
Discussion
Identifying reliable indicators of risk for rupture of an intact lesion could vastly improve the clinical management of IAs. Many potential variables have been studied, but there is much room for improvement in the prediction of subarachnoid hemorrhage of a previously unruptured aneurysm.18 We propose that the morphological parameters of IAs could be important factors for the prediction of aneurysm rupture. In the present study we examined the morphological parameters and showed that SR, H/W, θv, aneurysm location, and aneurysm shape were independently correlated with IA rupture.
Aneurysm location
Aneurysm location significantly influenced aneurysm rupture in this study. Middle cerebral artery aneurysms (73.7%) had the highest proportion of ruptured aneurysms, substantially posterior communicating artery aneurysms (68.4%) had a lower proportion of ruptured aneurysms than middle cerebral artery aneurysms, but a higher proportion of ruptured aneurysms than anterior communicating artery aneurysms (62.5%). Ophthalmic artery aneurysms (12.7%) had the lowest proportion of ruptured aneurysms. Rinkel et al19 reported that, compared with the anterior communicating artery, the relative risk of aneurysm rupture was 1.0 (95% CI 0.4 to 2.8) for the middle cerebral artery, 1.1 (95% CI 0.4 to 2.9) for the internal carotid artery, and 4.1 (95% CI 1.5 to 11) for the posterior circulation. Jeong et al20 reviewed 336 ruptured aneurysms enrolled in their hospital and found that the most prevalent aneurysm locations was the anterior communicating artery, middle cerebral artery, and posterior communicating artery. Although limited by its retrospective and single-center nature, this study confirmed that the rupture risk of aneurysms was related to aneurysm location.
Recent studies have shown that frontopolar, A2, and pericallosal aneurysms have a similar or even higher rupture risk than anterior communicating artery aneurysms.21 ,22 It has been suggested that frontopolar, pericallosal, and anterior communicating artery aneurysms can be classified together as an ‘ACA higher risk’ group. However, we were not able to investigate the rupture risk of these aneurysms in more detail because of the small sample.
AR, H/W, and aneurysm shape
Many studies have reported that the AR is a morphological parameter for the prediction of aneurysm rupture. The neck and size of the aneurysm has been definitively associated with the velocity of blood flow into and out of the aneurysm in African-American and German populations.23 The area of the neck is a factor limiting blood flow into and out of the aneurysm. Within the aneurysm, the velocity of the blood is inversely proportional to the volume of the aneurysm. Thus, the larger the aneurysm in proportion to the aneurysmal neck, the more sluggish the blood flow and the longer the blood will remain in the aneurysm. Roach et al reported the relationship between the neck size and aneurysmal thrombosis or rupture in a canine tail artery aneurysm model, in which aneurysms of variable lengths were generated to obstruct the tail artery. The results showed that short aneurysms (<1× tube diameter=neck diameter) remained unaltered after 2 weeks while medium-sized aneurysms (2–2.5× tube diameter) ruptured and long aneurysms (>4× tube diameter) were thrombosed.24 These results suggest that the AR is a good parameter to indicate the intra-aneurysmal flow condition. Weir et al25 showed that 88% of ruptured aneurysms had an AR of >1.6 while 56% of unruptured aneurysms had an AR of ≤1.6. This result is consistent with rates of 80% and 90%, respectively, observed in a previous study,13 with negative and positive predicted values of 73% and 93%, respectively. A consensus concerning the optimal AR threshold value above which IAs might be considered as dangerous has not been reached. However, the AR threshold value obtained in the present study was 1.18. This difference might reflect the use of two-dimensional angiographic data in the previous study compared with the use of three-dimensional data reconstructed from rotational angiography in the present study.
A number of studies have attempted to examine aneurysm shapes and flow dynamics using sophisticated mathematical and computer models, demonstrating an association between aneurysm shapes or flow dynamics and the risk of aneurysm rupture. The H/W ratio, AR, and aneurysm shape might indicate the complexity of an aneurysm. Hoh et al reported that theH/W ratio (OR 1.23, CI 1.03 to1.47 for every 0.1 increase) was significantly predictive of aneurysm rupture. Fusiform aneurysms typically exhibit high H/W ratios whereas lateral aneurysms exhibit low H/W ratios.15 Regular or lateral aneurysms exhibit a simple flow dynamic of unchanging flow jet direction with a single associated vortex. In contrast, irregular aneurysms or those with a daughter sac have a complex flow dynamic, showing changes in the direction of the inflow jet with the generation or destruction of a single vortex or multiple vortices.26 Thus, aneurysms with high H/W ratios or daughter sacs are likely to rupture. In the present study, the determination of the aneurysm shape was not based on objective measurement criteria but rather depended on the subjective judgment of the examining neurosurgeon. Raghavan et al27 suggested undulations in the aneurysm wall and ellipticity of the aneurysm sac as objective criteria to determine aneurysm shape, and some studies have used these criteria. Further exploration of the dynamic characteristics of different forms of aneurysms defined using objective criteria might facilitate predictions of IA rupture risk.
SR and size
Dhar et al14 first proposed the SR as a parameter associated with the sizes of the aneurysm and parent artery. These authors suggested that the SR is a significant parameter for IA rupture risk (p<0.001). About 77% of all ruptured aneurysms had SR >2.05, but more than 83% of all unruptured aneurysms had SR of <2.05. In the present study, multiple logistic regression analysis showed that ruptured aneurysms had higher SR, and these results were statistically significant.
Aneurysm size has previously been used as a predictor of aneurysm rupture, but an increasing number of studies have shown that ruptured and unruptured aneurysms have similar sizes. For two aneurysms of the same size, a high SR indicates a small-sized artery. Otherwise, to some extent, SR is associated with aneurysm location. For example, IAs located on the anterior communicating artery, posteroinferior cerebellar artery, or those located distally on A2, P2, or M2 bifurcations consistently showed a high SR whereas ruptured aneurysms in the same locations were of smaller size. Joo et al28 noted that anterior communicating artery aneurysms most commonly presented with rupture sizes <7 mm (76.8%) and 10 mm (92.1%) in diameter, and the mean size of anterior communicating artery aneurysms was smaller than other sites. Lai et al29 reported that the anterior communicating artery had a higher proportion with a size of ≤5 mm compared with other locations (p<0.05).
Carter et al30 proposed that aneurysms arising from smaller vessels have thinner walls. Morgan et al31 suggested that the wall tension required to withstand a given pressure increases with the diameter of a vessel. Thus, the relative resistance to rupture of two aneurysms, equal in size but emanating from parent vessels of different thickness, may be different. This indicates that those aneurysms with a small size of parent artery are smaller and always rupture at a smaller size than those at other locations. Thus, the theory suggests that the critical size for aneurysm rupture may be influenced by the thickness of the wall of the arteries from which it derives. The classification of aneurysms only on the basis of aneurysm location or aneurysm size cannot therefore capture vessel geometry and predict the real risk of aneurysm rupture. We think the SR can indicate differences in the risk of aneurysm rupture that size or location alone cannot.
Aneurysm angle
Univariate analysis revealed that θF, θA, and θV were significantly more obtuse in the ruptured subset, while multivariate logistic regression identified only θA as an independent discriminant of rupture status. Meng et al17 reported inflow angle as an independent factor of rupture status. The computational fluid dynamics analysis showed that the increasing inflow angle resulted in deeper migration of the flow recirculation zone into the aneurysm, with higher peak flow velocities and increased transmission of kinetic energy into the distal portion of the dome. The increasing inflow angle resulted in higher inflow velocity and increased wall shear stress and spatial gradients in both the inflow zone and dome. Consistent with the results obtained in the present study, Dhar et al14 reported a statistically significant difference between the mean values of θA in ruptured and unruptured groups but the vessel angles showed no statistically significant difference, in contrast with the present results. Yu et al reported that the angle between the internal carotid artery and the origin of the posterior communicating artery (the Apcom parameter) between the aneurysmal (45.28±29.07) and control groups (79.22±17.83) was statistically significantly different. The Apcom parameter may be correlated with the formation of an internal carotid artery–posterior communicating artery aneurysm and seems to be a promising morphological parameter for risk assessment of aneurysm formation.32 Matsukawa et al found that a significantly higher proportion of ruptured posterior communicating artery aneurysms showed a lateral direction of the aneurysmal dome around the posterior communicating artery, and the dome-to-neck ratio was >2.0. Multivariate logistic regression analysis also showed the lateral direction of the aneurysmal dome around the posterior communicating artery to be significantly associated with posterior communicating artery aneurysm rupture (OR 6.7, p=0.0001).33
The association of larger aneurysm angles with increased rupture risk might reflect the imbalance between the vascular wall bearing capacity and blood flow inertia and impingement. In IAs with high curvature parent vessels, high aneurysm angles, or high inflow angles, the inflow from the parent vessel would carry high inertia and impinge on the wall. Impingement beyond aneurysm wall endurance eventually results in aneurysm rupture. In addition, we propose that energy consumption is associated with aneurysm rupture. Indeed, blood is a non-Newtonian fluid with viscosity, and the friction force generated between the blood and the vascular wall during the flow process consumes energy. The top of an aneurysm is the weakest area, representing a common breaking point. Compared with a bigger aneurysm angle, the top of an aneurysm with a small aneurysm angle bears low impingement because of low energy consumption during the flow process and therefore shows a lower rupture risk. The θP did not achieve statistical significance in the present study, probably reflecting the fact that most of the patients examined had IAs in the internal carotid artery with parent artery angles of nearly 180°.
Limitations
In the present study, vasospasm and the rupture itself could have affected the ruptured aneurysm data. As is known, vasospasm affects the parent artery from approximately 5 days after hemorrhage.34 However, most of the patients in our study presented within 24 or 48 h of the initial hemorrhage. Therefore, vasospasm is not expected to have a significant effect on these data. In addition, if the aneurysm shape or size dramatically changes following rupture, then the quantified shape analysis might not be helpful in predicting the rupture of a previously intact aneurysm. Notably, previous studies on aneurysm morphology have indicated that rupture does not dramatically alter aneurysm shape.13
Second, this study involved a limited group size, which might affect the results. For example, fusiform or dissecting aneurysms were not included in the present study. Similar studies on a much larger population are necessary to verify the findings.
Moreover, most of the previous studies (including this study) have examined morphological characteristics of ruptured and unruptured aneurysms. Unfortunately, this methodology could not account for some possible changes in morphology that high-risk unruptured IAs may experience over time, potentially evolving into the gross morphology associated with ruptured aneurysms. Thus, evaluating unruptured IAs of any location or size or shape at only one point in time is of little value because the future evolution of the lesion could not be predicted. A prospective study following up aneurysms without treatment for a long time regardless of size or location would provide the ultimate natural history study but, unfortunately, such a study will never be completed due to the unacceptable ethical dilemma.
Conclusion
Our study suggests that SR, H/W, aneurysm shape, and aneurysm location have the strongest independent correlation with ruptured IA. However, SR, θA, aneurysm shape, and aneurysm location had the strongest independent correlation with ruptured sidewall IAs.
Based on the results of this retrospective study, we propose that parameters that simultaneously quantify aneurysm shape and adjacent vessel geometry, such as SR and θv, have greater promise for IA rupture risk assessment than parameters based on aneurysm shape or size alone. These morphology parameters might become reliable indices for predicting aneurysmal rupture and accurately analyzing the operative indications for surgery on incidentally identified unruptured aneurysms.
References
Footnotes
YZ and FX contributed equally.
Contributors BL and YZ: Conception and design. YZ, JR, QX, YT, and YL: Analysis and interpretation of the data. YZ and FX: Drafting the article. All authors critically revised the article, reviewed the final version of the manuscript and approved it for submission.
Competing interests None declared.
Ethics approval Huashan Hospital, Fudan University.
Provenance and peer review Not commissioned; externally peer reviewed.