Article Text

Abstract
Background and purpose Flow-diverter stents (FDSs) have been used effectively to treat large neck and complex saccular aneurysms on the anterior carotid circulation. Intra-aneurysmal flow reduction induces progressive aneurysm thrombosis in most patients. Understanding the degree of flow modification necessary to induce complete aneurysm occlusion among patients with considerable hemodynamics variability may be important for treatment planning.
Materials and methods Patients with incidental intracranial saccular aneurysms who underwent FDS endovascular procedures were included and studied for a 12 months’ follow-up period. We used computational fluid dynamics on patient-specific geometries from 3D rotational angiography without and with virtual stent placement and thus compared intra-aneurysmal hemodynamic problems. Receiver operating characteristic analysis was used to estimate the stent:no-stent minimum hemodynamic ratio thresholds that significantly (p≤0.05) determined the condition necessary for long-term (12 months) aneurysm occlusion.
Results We included 12 consecutive patients with sidewall aneurysms located in the internal carotid or vertebral artery. The measured porosity of the 12 deployed virtual FDSs was 83±3% (mean±SD). Nine aneurysms were occluded during the 12 months’ follow-up, whereas three were not. A significant (p=0.05) area under the curve (AUC) was found for spatiotemporal mean velocity reduction in the aneurysms: AUC=0.889±0.113 (mean±SD) corresponding to a minimum velocity reduction threshold of 0.353 for occlusion to occur. The 95% CI of the AUC was 0.66 to 1.00. The sensitivity and specificity of the method were ∼99% and ∼67%, respectively. For both wall shear stress and pressure reductions in aneurysms no thresholds could be determined: AUC=0.63±0.16 (p=0.518) and 0.67±0.165 (p=0.405), respectively.
Conclusions For successful FDS treatment the post-stent average velocity in sidewall intracranial aneurysms must be reduced by at least one-third from the initial pre-stent conditions.
- Aneurysm
- Blood Flow
- Flow Diverter
- Stent
Statistics from Altmetric.com
Introduction
Flow-diverting stents (FDSs) have been used successfully for the treatment of large neck and complex intracranial aneurysms.1–3 High reported rates of successful FDS endovascular procedures generally indicate that the hemodynamic moderation induced by a FDS is mainly responsible for complete aneurysm occlusion.1 ,2 Therefore, we assumed that a minimum hemodynamic reduction threshold would exist that increased the likelihood of aneurysm occlusion (thrombosis) as induced by a FDS. This is in agreement with the functional FDS paradigm: the less the porosity of a FDS, the greater the flow reduction and likelihood of aneurysm occlusion. In a recent study using a DSA-based optical flow method to evaluate FDS performance, an empirical post-stent:pre-stent kinematic ratio was calculated, and a relative threshold corresponding to a long-term aneurysm occlusion time was defined.4 Although limited, such measurements may help to improve the design of devices, and also enhance virtual treatment planning and thrombogenesis modeling. They may also help to determine the factor responsible for the ∼20% of all FDS outcomes that are unsuccessful.
Previous computational fluid dynamics (CFD) studies investigated hemodynamic changes induced by FDS related to aneurysm thrombosis. They assumed, directly or indirectly, the existence of absolute velocity or wall shear stress (WSS) thresholds despite arbitrariness in the choice of boundary conditions.5–7 On the other hand, in our study, we prospectively followed up patients to assess aneurysm occlusion rates with respect to the potential relative (patient-unspecific) flow change induced by FDS. By investigating relative flow change we aimed to minimize the CFD/FDS modeling problems influencing absolute flow reduction values. We used CFD analysis before and after virtual stent evaluation in a consecutive series of patients harboring saccular unruptured aneurysms who had been previously treated with one-layer FDS.
Material and methods
Patients harboring unruptured intracranial aneurysms, selected for FDS endovascular procedures, were eligible for this study. All patients provided written consent for inclusion in the study. They were treated with one layer of the Pipeline embolic device (PED) (Covidien, Irvine, USA) without additional coiling. They followed our standard antiaggregation regimen protocol—namely, double antiaggregation with clopidogrel 75 mg and aspirin 100 mg, 10 days before and 3 months after the procedure. Then, 100 mg of aspirin alone was given until 1 year after the treatment.3 ,4 Patients were followed up with contrast-enhanced MRI/MR angiography at 3, 6, and 12 months and a control angiogram was obtained at 12 months. Patient-specific aneurysm models for CFD were created from 3D rotational angiography images acquired with the Integris Allura FD20 system (Philips Healthcare, Best, The Netherlands) and reconstructed within a 256×256×256 matrix using an Xtravision Philips workstation. A virtual FDS model impeded flow across the aneurysm neck.
Geometry and hemodynamic modeling
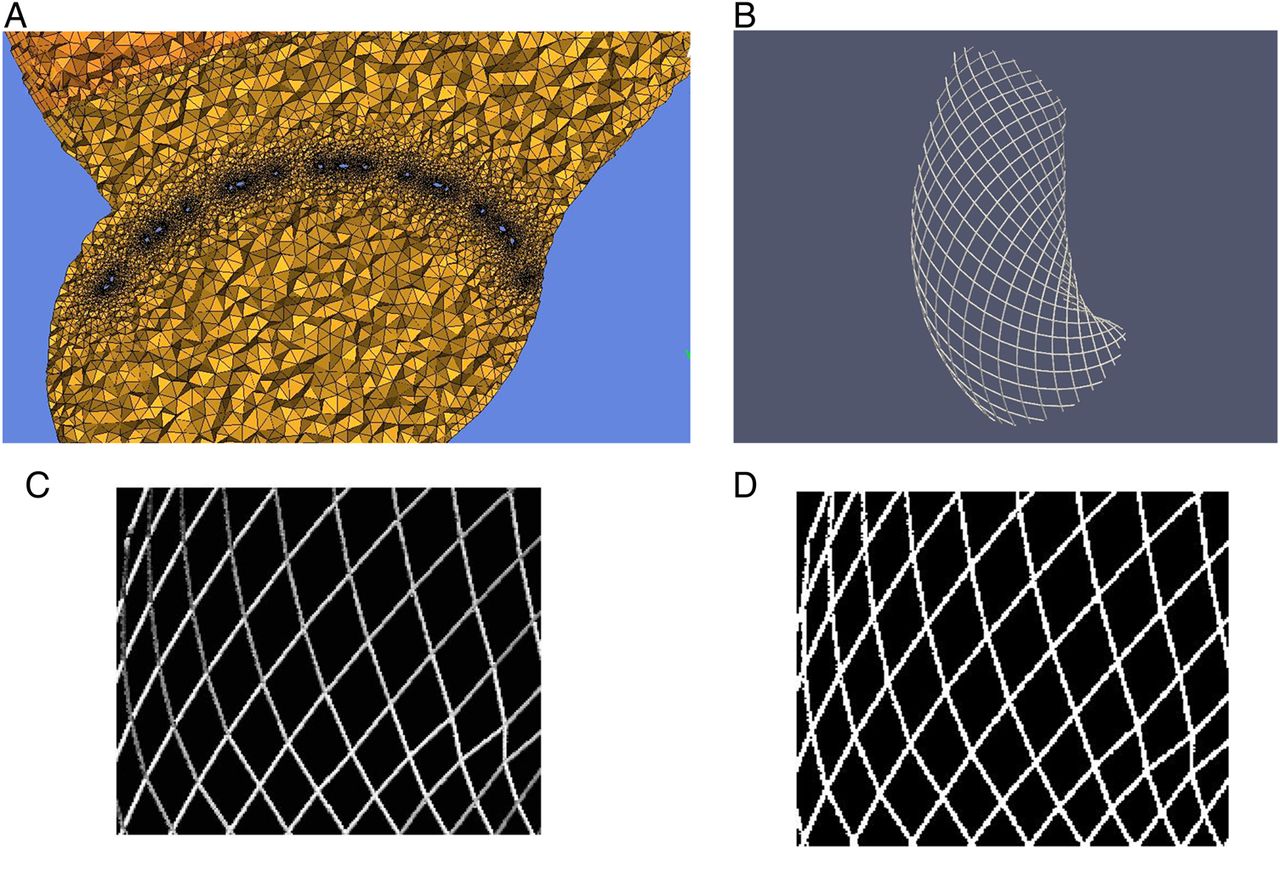
The triangulated surfaces of the aneurysm model were reconstructed by the geodesic active region method.8 ,9 A PED was geometrically deformed in the parent artery across the neck using the fast virtual stent (FDS) placement method.10 We used patient postprocedure VasoCT images of the deployed stent as reference for the virtual placement. Commercial software (ICEM CFD V.12.1, ANSYS Inc, Canonsburg, Pennsylvania, USA) was then used to produce high-resolution computational unstructured mesh comprising tetrahedrons in the bulk flow and eight node prism elements delineating three boundary layers near the wall outside the parent artery segment encompassing the FDS. The mesh element number ranged from 3.3 to 5.6 million, with a mesh density >2000 elements/mm3 for free-FDS models, and 12–25 millions of elements for aneurysm models merged with the virtual FDS. In the latter case, the volume mesh density was the minimum reached after the FDS model had been reduced and patched to fit the neck proximal and distal extensions.8 The OCTREE mesh of merged aneurysm and FDS models was completed in a second iteration with Delaunay tetrahedron tessellation that fits with the 30 μm strut size of a virtual PED (figure 1A). The maximum element sizes were 0.180 and 0.018 mm in regions away from and around the virtual PED area, respectively.

(A) Capture of the ANSYS ICEM mesh screen showing grid refinement around the stent patch (black area around the small blue struts). (B) Top view of 3D virtual stent patch over the aneurysm neck. (C) Grey level cropped and filtered image output obtained from the 3D virtual image. (D) Segmentation output of left image (binary) used to measure porosity (background over foreground ratio).
The total number of prisms ranged from 1.5 to 2.8 million. The prism layer grid size was 0.012 mm. To measure the effective porosity of the virtual FDS, we developed a software tool based on the Paraview and Matlab (Mathworks v2011a) imaging toolkit. This was used to extract from the 3D FDS image, the 2D top-view snapshot (through the dome of the aneurysm) across the neck area (figure 1B), and crop rectangles of the 2D grey scale image to fix the space domain of the porosity estimate (figure 1C). Several cropping limits were spooled and then a binary image extracted to measure porosity (fraction of background pixels, figure 1D). Sensitivity tests on crop limits and segmentation thresholds were also performed.
The method was validated on three generic virtual PEDs with the same porosity (70%) and length (20 mm), but with different diameters: infinite (flat), 3 and 4 mm. No statistical bias in porosity measurement was found (<1% for generic PEDs). The measurement error of the porosity on the 12 models was <2%. The neck area was manually determined with ICEM CFD and defined identically for the free-FDS and FDS-merged aneurysm models. The ANSYS CFX commercial Navier–Stokes equation solver was used to simulate blood flow as a Newtonian incompressible fluid.11 One-dimensional generic boundary conditions were imposed for inlet pulsatile flow and outlet pressure curves, together with rigid boundary conditions on wall.12 ,13 The mean volumetric flow rates ranged between 3.7 and 5.3 cc/s and inlet diameters between 3.7 and 5.3 mm. Blood was modeled with the following parameters: (a) density: 1066 kg/m3; (b) viscosity: 0.0035 Pa.s; (c) Reynold’s number: 300–570; (d) Womersley number: 1.5–2.8; (e) cycle: 0.8 s (time steps=100); (f) number of cycles: 2. Analysis of results was performed using ANSYS CFX and Matlab (Mathworks, Natick, Massachusetts, USA) customized scripts.
Hemodynamic parameters
We evaluated velocity (VST), WSS, and pressure (PRES) averaged over space and cycle in every aneurysm and for each simulation run with and without FDS. All hemodynamic factors were registered at every time step. To compare the hemodynamic impact of each stent on the respective aneurysm, stent:no-stent ratios of VST (VSTR), WSS (WSSR), and PRES (PRESR) were determined.
Statistical analysis
The area under curve (AUC) was estimated with SPSS statistical package (IBM SPSS statistics, V.21) using receiver operating characteristic analysis of the dependency of the aneurysm occlusion (Boolean) state at 12 months with the independent post-stent:pre-stent ratio test variables, VSTR, WSSR, and PRESR, respectively. The following options were selected: positive classification—cutoff value included; test direction—smaller test result indicates positive test; distribution of the SE of the AUC—non-parametric, with 95% CI. The threshold value for each test variable was determined whenever the AUC was significantly different from 50% (p≤0.05). Additionally, the correlations between VSTR and WSSR, and between VSTR and PRESR, were checked with the bootstrap function involving 1000 data samples generated from respective VSTR, WSSR, and PRESR data. Finally, to illustrate the absolute effect of the FDS on the hemodynamics, probability density estimates of the absolute velocity, WSS, and pressure distributions in aneurysms, with and without FDS, were obtained using a normalized kernel smoothing density function.14
Results
Patients were treated with a PED by an experienced interventionist (VMP) at the same center. Aneurysms were located at the internal carotid paraclinoid segment and at the vertebral artery (V4 segment) (figure 2). There were no technical problems during stent deployment and device apposition was verified with VasoCT. No clinically relevant events or complications were seen immediately after the procedure or during the follow-up period. Nine aneurysms (n=9) were occluded at 12 months’ follow-up while the remaining three were still patent.

Capture of the 12 patient-specific aneurysm models. No occlusion was seen at 12 months’ follow-up in aneurysms models 4 (row 1, column 4), 6 (row 2, column 2), and 12 (row 3, column 4).
Absolute effects of PED-like FDS on aneurysm flow
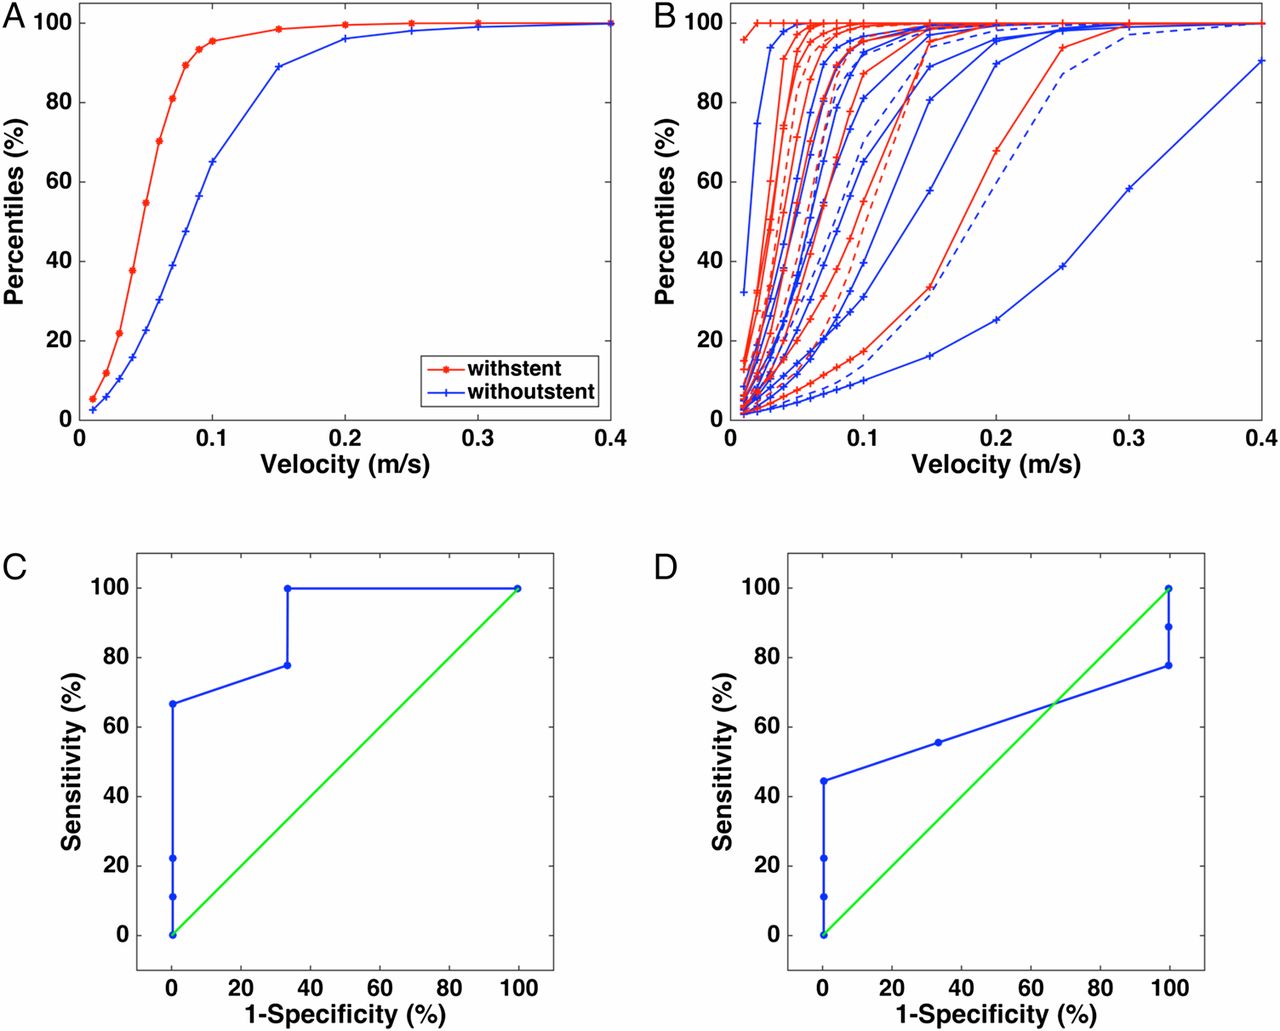
The mean aneurysm size and aspect ratio were 10.0±3.2 mm (range 3.0–17.0 mm, median 5.4 mm) and 1.03±0.64 (range 0.54–1.51, median 0.87), respectively. Without a stent, the average VST, WSS, and PRES were 0.30±0.24 m/s (range 0.04–0.57 m/s, median 0.185 m/s), 3.8±3.6 Pa (range 0.5–7.2 Pa, median 2.0 Pa), and 3853±399 Pa (range 3572–4136 Pa, median 3813 Pa), respectively. With a stent, the average VST, WSS, and PRES were 0.18±0.16 m/s (range 0.01–0.36 m/s, median 0.10 m/s), 2.10±1.90 Pa (range 0.1–4.1 Pa, median 1.3 Pa), and 3875±407 Pa (range 3577–4174 Pa, median 3759 Pa), respectively. Figure 3 compares, for each variable, the probability density estimates, with and without a stent associated with the sample. In particular, the means and SDs for VST, WSS, and PRES without a stent were, respectively, 0.14±0.04 m/s, 2.0±1.1 Pa, and 3682±186 Pa. With a stent, the means and SD for VST, WSS, and PRES were, respectively, 0.09±0.04 m/s, 1.0±0.5 Pa, and 3686±190 Pa. Unlike the results for VST and WSS (figure 3A, B), no difference was seen between the no-stent and stent-related pressure distributions (figure 3C). The reduction effect of FDS on VST and WSS is commonly seen on cumulative distribution functions (centiles) as shown for VST in (figure 4A), where the no-stent VST and WSS centiles (in blue) were always shifted backwards, whereas larger centiles were reached for smaller post-stent velocity or WSS values (red). It can be seen also in figure 4B that no line separating the velocity centiles of the cases that occluded (continuous lines) and those which did not (dashed lines) could be found. Consequently, the treatment is not sensitive to post-implantation velocity (p>0.05).

(A) Probability density estimate of volume-space and time average velocity (VST) without and with a flow-diverter stent (FDS) (mean±SD of dominant peak value 0.138±0.043 m/s and 0.086±0.039 m/ s, respectively). (B) Probability density estimate of mean wall shear stress (WSS) in aneurysms without and with a FDS (mean±SD of dominant peak value 2.02±1.12 Pa and 0.98±0.51 Pa, respectively). (C) Probability density estimate distribution of mean relative pressure in aneurysms without and with a FDS (mean±SD of dominant peak value 3682±186 Pa and 3686±190 Pa, respectively).
Representation of hemodynamic reduction induced by virtual Pipeline embolic device (PED). (A) Percentile distribution (empirical cumulative distribution function) of volume-space and time average velocity (VST) in the aneurysm with and without a PED. (B) Percentile distributions of VST for the 12 intracranial aneurysms with and without a PED. The occluded (n=9) and patent (n=3) cases are represented by full and dashed lines, respectively. (C) Receiver operating characteristic (ROC) performance figure for the stent:no-stent ratio of space and time average velocities (area under curve (AUC)=0.889±0.113, p=0.052, minimum reduction ratio (reduction) threshold: 0.647 (0.353)). (D) ROC performance figure for the stent:no-stent ratio of space and time average wall shear stress (AUC=0.630±0.160, p=0.518).
Patient-unspecific relative effects of PED-like FDS on aneurysm flow
The stent:no-stent ratios, VSTR, WSSR, and PRESR, are summarized in table 1. Their mean±SD values were 0.57±0.11 (range 0.26–0.70), 0.50±0.13 (range 0.17–0.74), and 1.001±0.003 (range 0.998–1.009), respectively. The linear correlation between VSTR and WSSR was significantly high (R=0.80±0.20, p=0.002), whereas for the correlation between VSTR and PRESR it was not (R=0.21±0.21, p=0.52). The average virtual FDS porosity over the sample was 83%±3% (table 1). This value showed a reasonable match to the corresponding parent artery segment diameters, which, on average, decreased by 1 mm following the direction of the blood flow (table 1). Table 1 summarizes the occlusion status at the end of 12 months’ follow-up (Th12). Figure 4A, B shows the AUC for VSTR (AUC=0.889±0.113, 95% CI 0.66 to 1.00, p=0.052) and WSSR (0.63±0.16, p=0.518), respectively. For PRESR, the AUC was 0.667±0.165, p=0.405. Therefore, the minimum hemodynamic ratio (reduction) thresholds responsible for aneurysm occlusion were estimated only for VSTR as 0.647 (reduction of 0.353). the sensitivity and specificity of the method were ∼99% and ∼67%, respectively.
Summary of the results for each aneurysm model (1–12)
Discussion
Comprehensive understanding of the optimal intra-aneurysmal flow modification induced by FDS is necessary for the development and improvement of devices, and also for treatment planning and research. In this context, the aim of this CFD study was to investigate the cause of the so-called FDS paradigm, seeking, in particular, minimum post-stent:pre-stent reduction thresholds related to spatial-and-temporal mean velocity and WSS factors. This study was based upon a consecutive series of 12 patients harboring asymptomatic unruptured sidewall aneurysms treated with one-layer FDS. Treatment was evaluated at 12 months. Nine aneurysms were successfully treated without any complication, and three were still patent. We adopted a different approach from other studies,6 ,15 ,16 focusing, on the one hand, on longer follow-up observations from the persistent aneurysm occlusion occurrence, and on the other, to analyzing post-stent flow change reduction thresholds rather than absolute post-implantation thresholds. This avoids the variability of patient flow conditions4 and the arbitrariness in hemodynamics and virtual deployment modeling.17 The hemodynamic factors in both flow-free (no FDS) and flow-diverted aneurysms (with FDS) were compared for each aneurysm model, and the generally known trends in absolute velocity, WSS, and pressure means were confirmed. Nevertheless, no significant absolute occlusion thresholds were found in final post-FDS hemodynamic behavior. For instance, as seen in (figure 4B), it was not possible to discriminate between the occluding and non-occluding areas of VST centile distributions, over the large variability of patient-specific physiological responses.
We further investigated the potential hemodynamic reduction thresholds using receiver operating characteristic analysis and AUC assessment of velocity, WSS, and pressure post-stent:pre-stent ratios with regard to the angiographic occlusion outcome. A significant AUC was found for VSTR, with a minimum of one-third velocity reduction required to induce durable occlusion in an intracranial aneurysm, independently of the aneurysm geometry. This result is in agreement with other studies which were not statistically well designed.18
Conversely, although WSS reduction correlated strongly with velocity reduction, no significant WSSR occlusion threshold could be estimated. Indeed, in recent in vitro experiments with a straight silicone model of an intracranial aneurysm implanted with a FDS, it was shown that even under controlled conditions, simulation of post-FDS flow patterns did not completely match the laser velocimetry measurements.19–21 Nevertheless, the existence of a WSSR threshold is critical for development of thrombosis models. Several fundamental studies on thrombosis modeling, applied to either giant aneurysms that thrombosed spontaneously or to stented aneurysms, were based on the existence of a minimal mechanical WSS threshold condition to triggering progressive and durable thrombosis.5 ,22 ,23 The hemodynamic flow change does not alone influence the clinical outcome. Others factors may come into play—namely, epigenetic factors, antiplatelet therapy, physiology, and stress.24 Therefore, determination of patient-unspecific hemodynamic thresholds are essential in the search to identify specific causes of procedure impairment. The patient-unspecific relative post-stent flow change perspective is usually in contradiction to the absolute final state precursor hypothesis. Although the former can comfortably cope with the variability of patient physiology, the latter could still hold within proper modeling and computing schemes.
In addition to the limiting modeling factors discussed above, this study was also limited by a lack of knowledge of the antiaggregation effect and the patients’ biological and inflammatory conditions. Also, since we included prospectively all patients treated with a FDS in our institution, there was a branch coming from the aneurysm sac in four cases (cases 1, 4, 11, and 12). It is known that side branches from the aneurysm sac can be related to a delayed occlusion time or distal emboli.25 Despite these limitations, this preliminary study showed that the patient-unspecific relative flow change effect induced by FDS might be considered in the future in making a prognosis based on the procedural issues.
Conclusion
Our study suggests that a minimal prone-to-occlusion velocity reduction threshold of one-third correlated with a complete aneurysm thrombosis at 12 months independently of the aneurysm geometry. A significant WSS condition was not determined possibly owing to the difficulty for CFD to reliably simulate intracranial aneurysm flow patterns impeded by FDS, unlike for velocity reduction. The determination of hemodynamic conditions non-specific to the patient geometry that are favorable to intracranial aneurysm treatment is a step forward in understanding the patient-specific conditions related to successful endovascular procedures. Larger studies are necessary to confirm and explore new potential parameters.
References
Footnotes
Contributors VMP, K-OL, HY, and GE: clinical data, treatment, follow-up visits, imaging review, and collection. RO, PB, and IL: virtual stent implantation. RO, OB, PB, IL, and VMP: computational fluid dynamics process. RO, IL, VMP. K-OL, and HY: statistical analysis and interpretation of results. All authors approved the version to be published and are accountable for all aspects of the work in ensuring that questions related to the accuracy or integrity of any part of the work are appropriately investigated and resolved.
Funding This study was supported by Swiss National Science Foundation grants (SNF32003B_160222 and SNF 320030_156813) and by the Mount Sinai Hospital University Health Network Association of Municipalities of Ontario innovation grant (MSH UHN AMO), Toronto, Canada. National Agency for Science and Technology Promotion (ANPCyT, Argentina) within the projects PICT 2014-1730 and PICT-2015-0006
Competing interests None declared.
Provenance and peer review Not commissioned; externally peer reviewed.
Data sharing statement The authors are willing to share spreadsheets from their data acquisition and experimental set-up details on request.