Article Text

Abstract
Magnetic resonance imaging (MRI) has proved to be a valuable tool for monitoring development and pathology in the preterm brain. This imaging modality is useful for assessing numerous pathologies including periventricular leukomalacia, intraventricular haemorrhage/germinal layer haemorrhage, and periventricular haemorrhagic infarction, and can help to predict outcome in these infants. MRI has also allowed the detection of posterior fossa lesions, which are not easily seen with ultrasound. Additionally, and perhaps most relevant, quantitative MR studies have shown differences between the normal appearing preterm brain at term equivalent age and term born infants, confirming that the brain develops differently in the ex utero environment. Further studies using quantifiable MR techniques will improve our understanding of the effects of the ex utero environment, including aspects of neonatal intensive care on the developing brain.
- magnetic resonance imaging
- preterm brain injury
- ADC, apparent diffusion coefficient
- CSE, conventional spin echo
- DEHSI, diffuse excessive high signal intensity
- DWI, diffusion weighted imaging
- FSE, fast spin echo
- GA, gestational age
- GLH, germinal layer haemorrhage
- IVH, intraventricular haemorrhage
- MR, magnetic resonance
- MRI, magnetic resonance imaging
- PHI, periventricular haemorrhagic infarction
- PVL, periventricular leukomalacia
- 3D, three dimensional
Statistics from Altmetric.com
- ADC, apparent diffusion coefficient
- CSE, conventional spin echo
- DEHSI, diffuse excessive high signal intensity
- DWI, diffusion weighted imaging
- FSE, fast spin echo
- GA, gestational age
- GLH, germinal layer haemorrhage
- IVH, intraventricular haemorrhage
- MR, magnetic resonance
- MRI, magnetic resonance imaging
- PHI, periventricular haemorrhagic infarction
- PVL, periventricular leukomalacia
- 3D, three dimensional
The developing brain is vulnerable to injury from many causes, resulting in significant mortality and morbidity despite recent improvements in neonatal intensive care, and at 30 months corrected age impairment can be identified in one half of all infants born at 25 weeks gestational age (GA) or less.1 However, even those with no identifiable disability at this age may experience learning difficulties when they enter mainstream school or have behavioural problems in adolescence.2–5
The neuropathological correlates for neurodevelopmental impairments are incompletely defined. Most of our knowledge comes from ultrasound, which shows a relation between periventricular haemorrhagic infarction (PHI) and periventricular leucomalacia (PVL) and the development of cerebral palsy. There are, however, no pathological or imaging correlates for the spectrum of neurocognitive impairments seen in the child who was born preterm.
Magnetic resonance imaging (MRI) provides an ideal and safe technique for imaging the developing brain. It is non-invasive and non-ionising and allows considerable differentiation of structures within the immature brain, showing the extensive maturation that occurs from 23 to 40 weeks gestation while these vulnerable infants are receiving intensive care. MRI shows the well recognised pathologies seen on ultrasound and in addition allows the detection of more subtle abnormalities.
MRI OF THE NORMAL PRETERM BRAIN
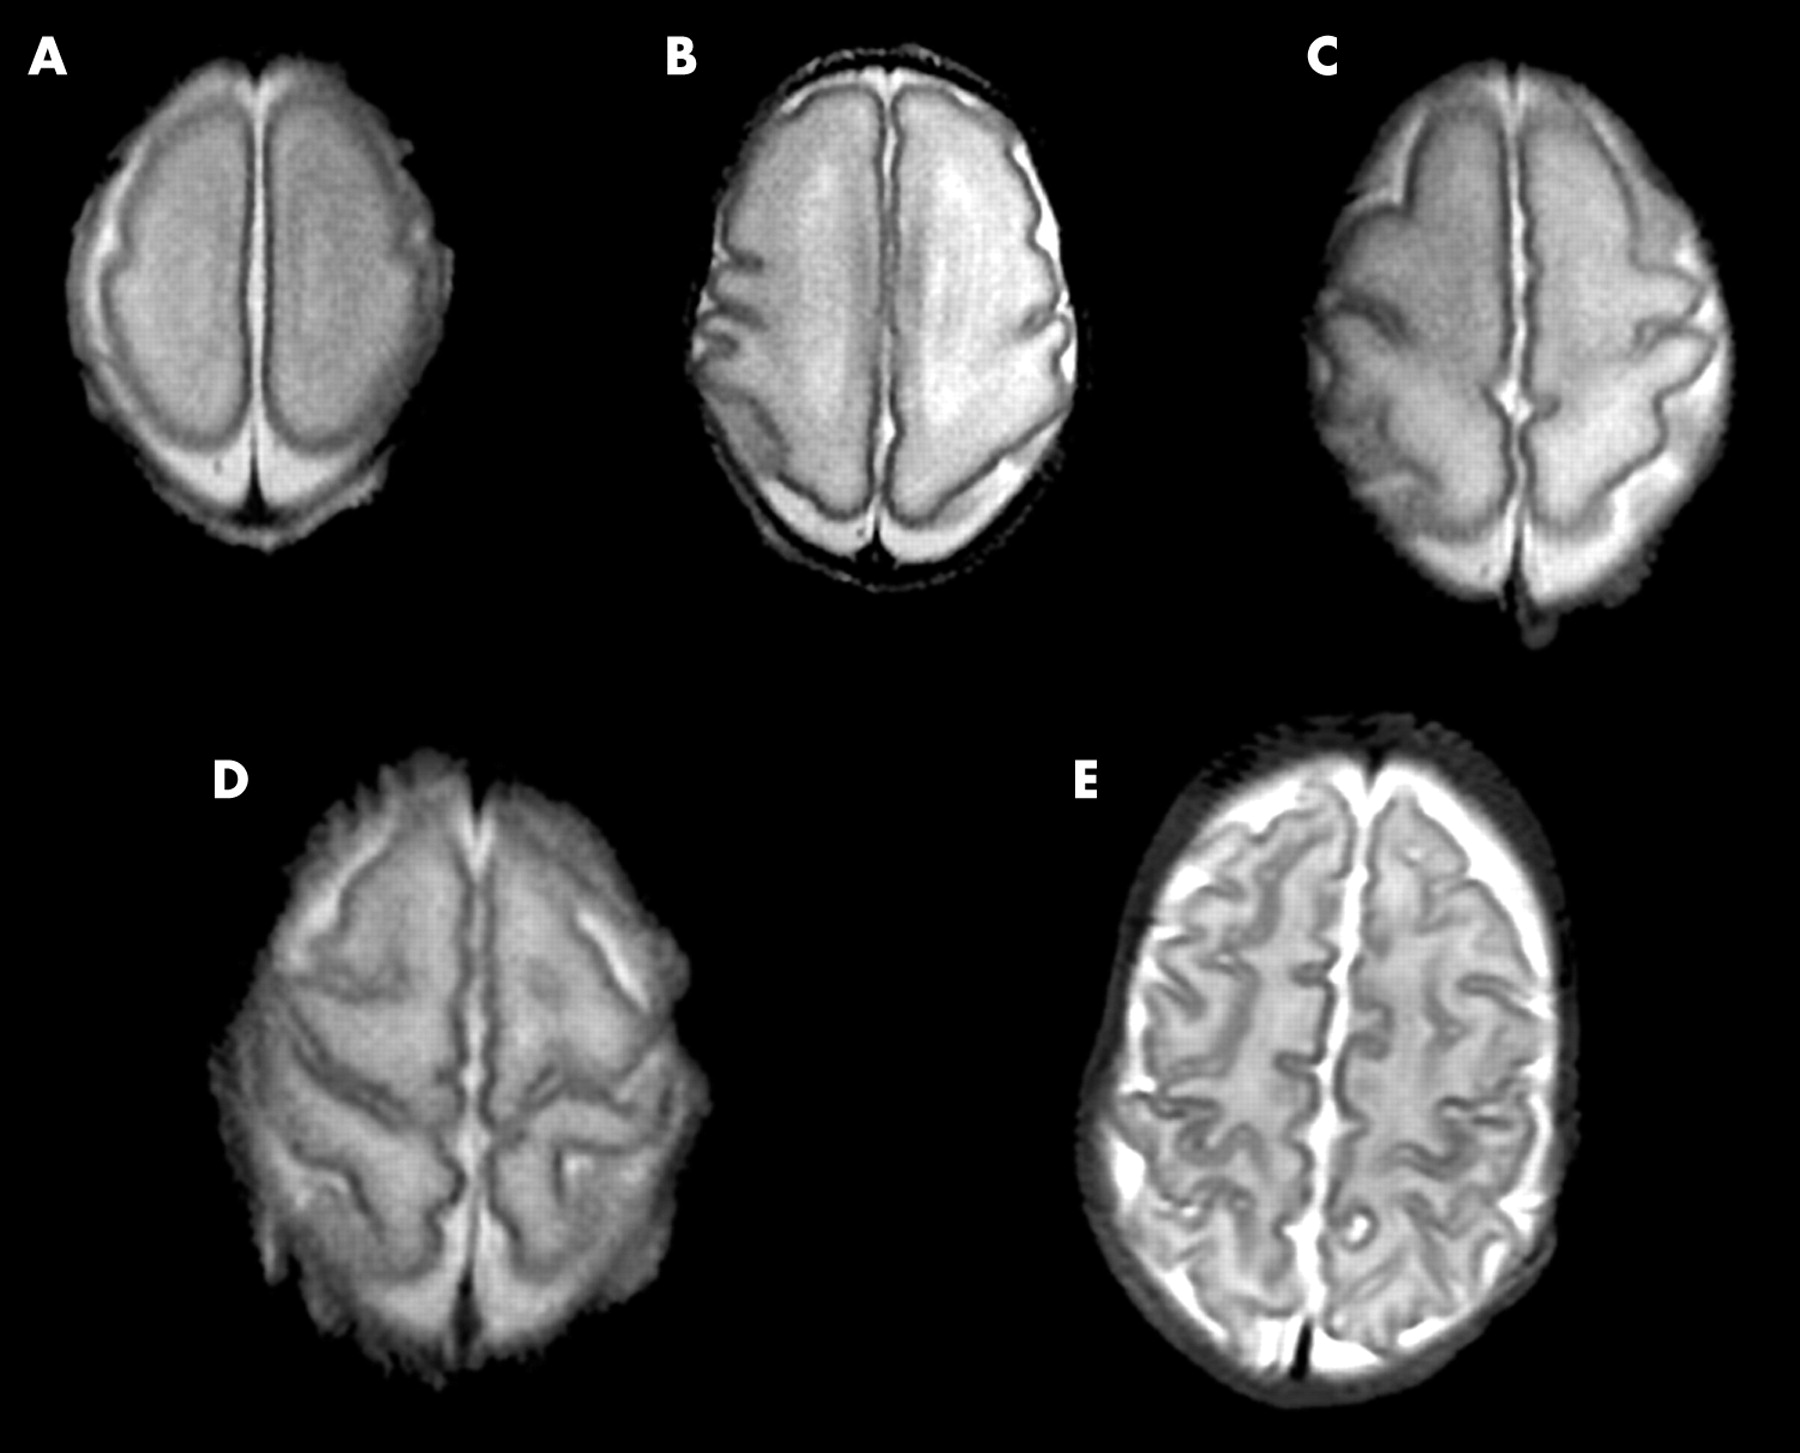
MRI provides excellent detail of the immature brain with good delineation of the cortex, white matter, and central grey matter structures.6,7 In the immature brain we have found that a T2 weighted fast spin echo (FSE) sequence gives the best contrast between different structures. The cortex is seen as high signal intensity on T1 weighted imaging and low signal on T2 weighted imaging, reflecting its high cellular density. Serial imaging allows the maturation of cortical folding to be assessed and scored.6,7 At 24 weeks GA the surface of the brain appears smooth apart from the parieto-occipital fissure, central sulci, cingulate sulci, calcarine sulci, and very wide Sylvian fissures (fig 1). Sulcation and gyration develop at different rates in different regions of the brain. At any given age prior to term, the folding of the central sulcus is the most advanced, followed by the medial occipital lobe. The parietal lobe is the next most advanced, followed by the frontal and posterior temporal lobes. The anterior temporal region is the least well developed. By term the cortex has extensive folding with the formation of tertiary sulci.

Development of sulcation and gyration with increasing GA. Transverse T2 weighted FSE images at the level of the central sulcus at: (A) 25 weeks GA; (B) 28 weeks GA; (C) 30 weeks GA; (D) 33 weeks GA; (E) 39 weeks GA.
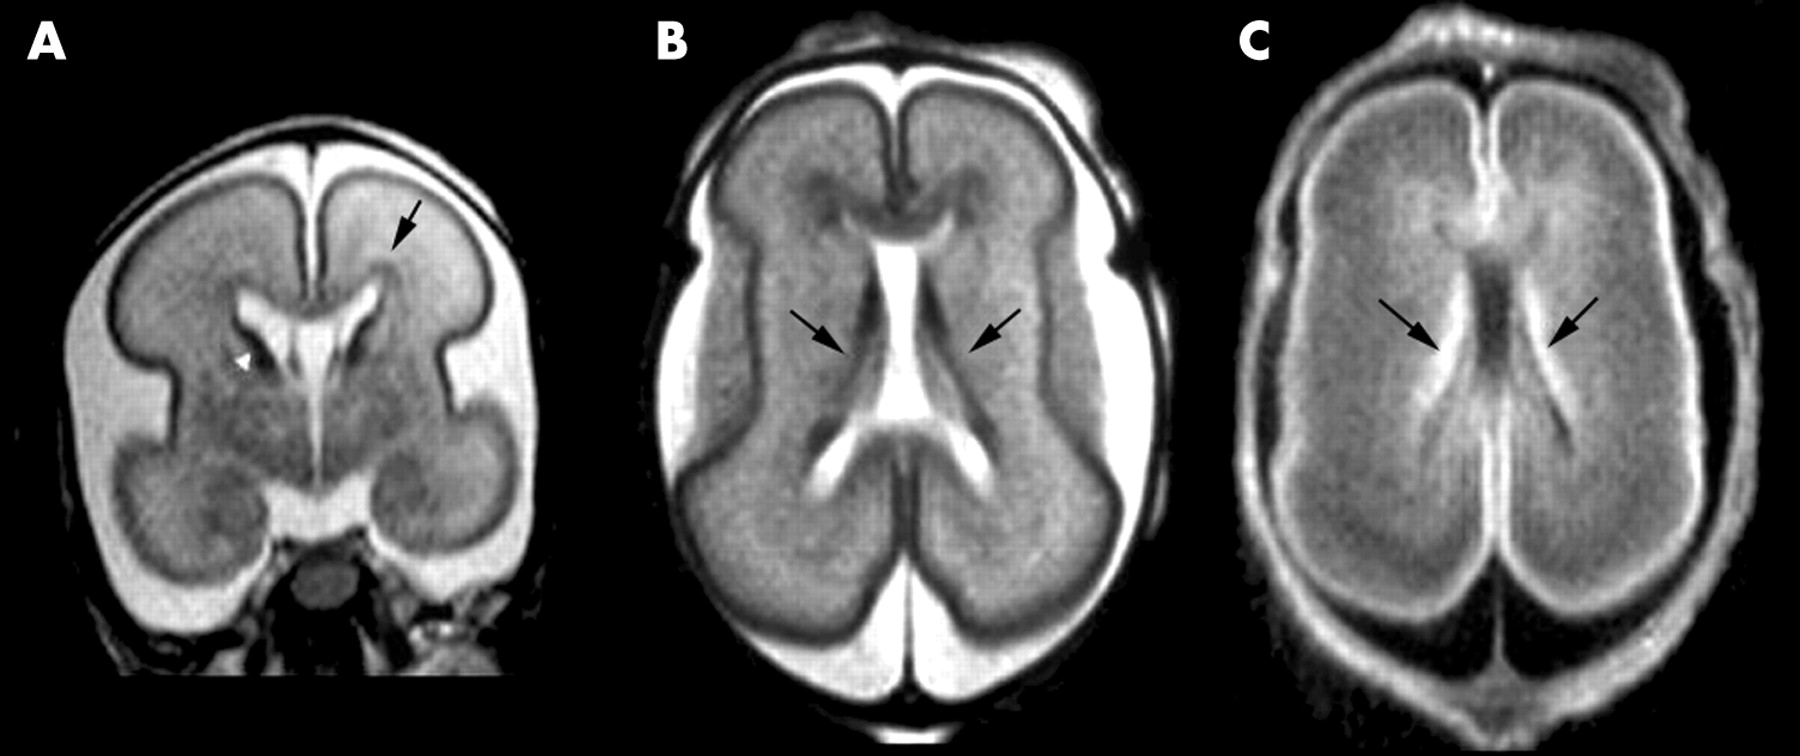
Unmyelinated cerebral white matter is shown as high signal intensity on T2 weighted imaging and low signal on T1 weighted imaging. On T2 weighted MRI, bands of low signal intensity are visible within the white matter, situated anterior, posterior, and lateral to the lateral ventricles.6 These represent relatively dense regions of glial cells migrating from the germinal matrix to the cerebral cortex8 (fig 2). At around 30 weeks GA, while the periventricular white matter remains high signal intensity, the low signal bands become difficult to visualise, presumably because the majority of the migrating cells have reached the cortex at this age.9 In addition to these areas of low signal intensity, areas of extremely high signal intensity on T2 weighted FSE images are visualised around the anterior horns of the lateral ventricles between 24 and 36 weeks GA. Similar high signal intensity areas in the shape of arrowheads are visualised in the posterior periventricular white matter at this GA.6 Histologically, these extremely high signal intensity areas are comprised of dense fibre bundles, which have a relatively low cellular density.8

(A) Coronal T2 weighted FSE image of an infant at 25 weeks GA showing the unmyelinated white matter as high signal intensity and the cerebral cortex as low signal intensity. The germinal matrix is shown as low signal intensity around the head of the caudate nucleus (arrowhead), and low signal bands representing migrating glia are shown within the white matter (arrow). (B) TransverseT2 weighted FSE image at the mid-ventricular level of an infant at 25 weeks GA showing the germinal matrix as low signal intensity (arrows). (C) TransverseT1 weighted FSE image at the mid-ventricular level of an infant at 25 weeks GA showing the germinal matrix as high signal intensity (arrows).
The germinal matrix is visible up to around 32 weeks GA as a prominent structure along the margins of the lateral ventricles (fig 2). After this age, small residual areas of germinal matrix are visualised at the anterolateral angles of the lateral ventricles and adjacent to the head of the caudate nucleus and in the roof of the temporal horn, a site not readily visualised with ultrasound. The germinal matrix is shown as high signal intensity on T1 weighted imaging and low signal intensity on T2 weighted FSE imaging.
Myelin has been shown in numerous white matter tracts and grey matter nuclei in the preterm brain, corresponding to those sites that show myelination on histology at this age. These areas lie within the brain stem, cerebellar vermis, and the thalami. From 28 weeks GA, myelination is not visualised at any new site, until 36 weeks GA, when myelin is visualised in the corona radiata, the posterior limb of the internal capsule, the corticospinal tracts of the precentral and postcentral gyri, and the lateral geniculate bodies. We have found that T2 weighted FSE imaging is the best imaging pulse sequence to show myelin in grey matter nuclei; however, T1 weighted imaging shows myelin earlier in some white matter tracts in the preterm brain.10
QUANTITATIVE MR TECHNIQUES
Recently, quantitative MR techniques have been used to assess the preterm brain, the preterm brain at term equivalent age, and the preterm brain later in adolescence. These techniques produce objective and reproducible measurements that improve our understanding of brain development and provide a more accurate correlate for neurodevelopmental outcome.
Techniques include three dimensional (3D) volumetric MR and measurements of cortical folding, which have been used to determine the increase in brain volume11 and cortical folding12 with increasing GA. Diffusion weighted imaging (DWI) is an MR technique which studies the Brownian motion of water in tissue and can be used to calculate apparent diffusion coefficients (ADCs), which quantify water molecular motion. Additionally anisotropy, which is a function of the directional dependence of water motion in a restricted environment, can be measured using DWI, and provides an insight into white matter structure. T1 and T2 relaxation values have also been studied in the preterm brain.13,14 These MR parameters are associated with cerebral water content, and are raised in pathology and in the immature brain.
MRI ASSESSMENT OF CEREBRAL PATHOLOGY
The developing brain is susceptible to injury from infective, ischaemic, and inflammatory insults. The majority of preterm infants show some evidence of brain injury on MRI in the early neonatal period.9
WHITE MATTER ABNORMALITIES
With the decline in the incidence of pathology such as PVL and IVH, diffuse white matter changes in the absence of more obvious focal lesions may now be the most common abnormality of the preterm brain.15 MRI has shown that there are a variety of white matter abnormalities that can be visualised in the preterm infant. It is not yet clear whether these represent a spectrum of one disorder or separate entities with different aetiological factors. These abnormalities may prove to be related to factors such as poor nutrition,16,17 steroids,18–20 and infection,21–23 which are known to affect development of the preterm brain.
DIFFUSE WHITE MATTER ABNORMALITY
The majority of preterm infants at term equivalent age appear to have areas of diffuse excessive high signal intensity (DEHSI) within the cerebral white matter (fig 3).9 These changes are most marked in the periventricular white matter, but may be evident throughout the white matter. Assessment of these changes is difficult with visual analysis as the appearances are markedly influenced by the windowing used prior to image processing. This has lead to strategies that allow a more objective measurment. DWI has shown raised ADC values in the cerebral white matter in infants with DEHSI compared to preterm infants with normal white matter, suggesting that DEHSI represents diffuse white matter disease.24 ADC values were comparable with those obtained from infants with obvoius white matter pathology such as PVL and PHI. It is unclear what causes the increase of ADCs in DEHSI, but it may be due to vasogenic oedema, oligodendrocyte damage, or a reduced axonal diameter. DEHSI represents one of the many differences between the preterm brain at term equivalent age and the brain of the term born infant. Quantitative MR techniques may be used to further delineate these differences.

Transverse T2 weighted FSE image of an infant at 40 weeks GA, who was born at 30 weeks GA, showing DEHSI within the cerebral white matter (arrows).
PERIVENTRICULAR LEUKOMALACIA
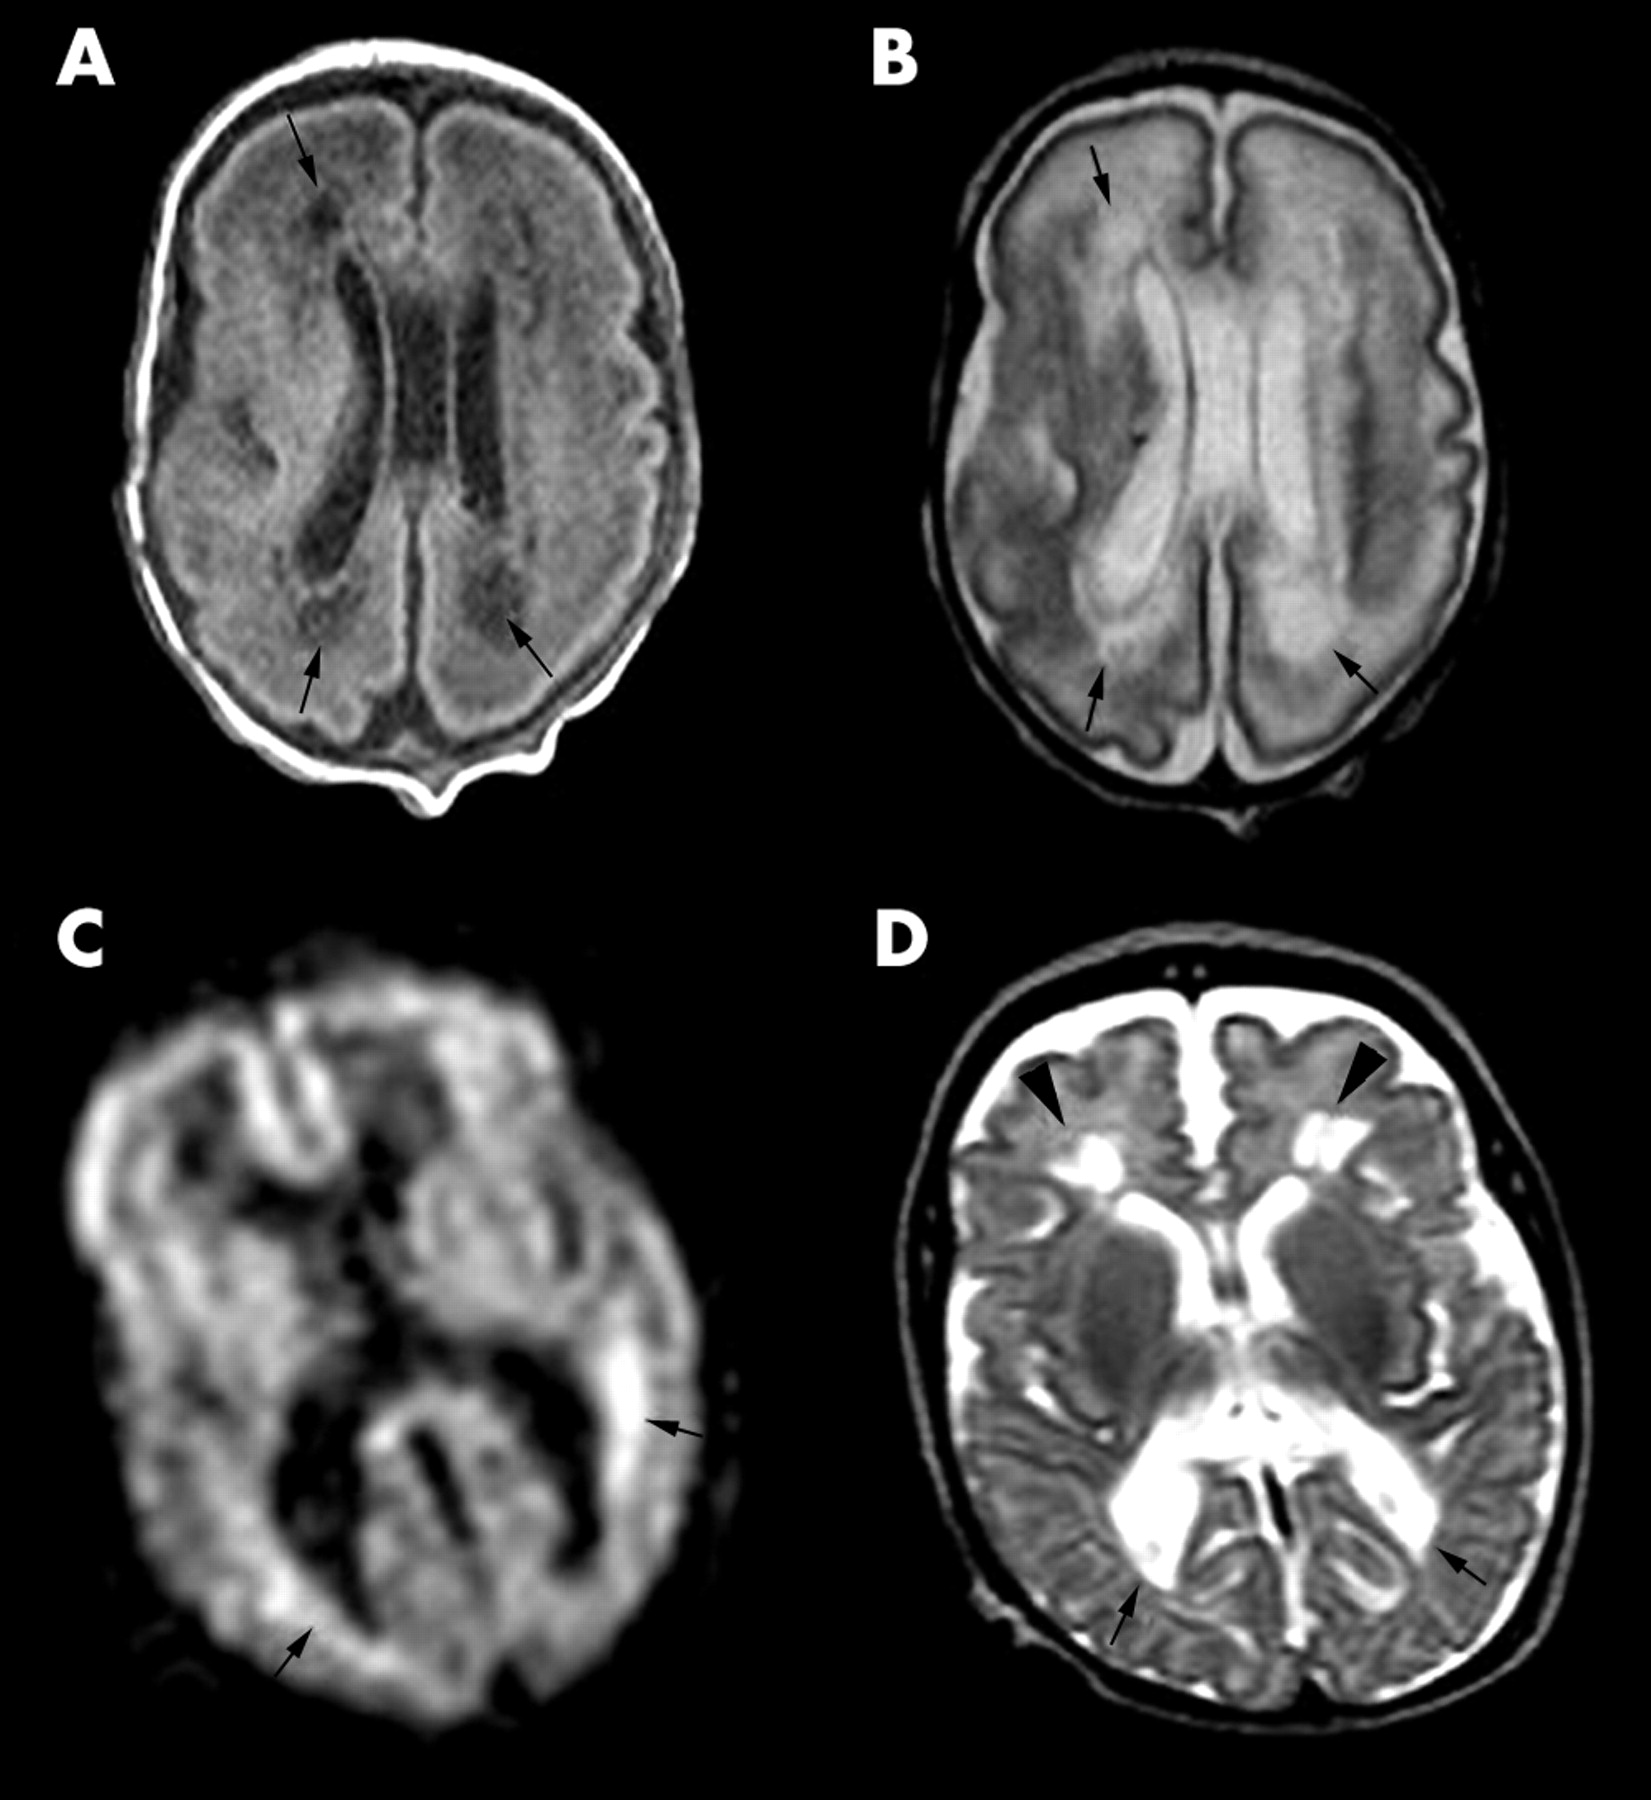
PVL is a histological diagnosis with “softening” of the white matter and focal cystic degeneration.25 Its incidence is 3–9% in preterm infants.26 Traditionally, PVL was thought to be due to ischaemia, but recent studies have suggested an infective cause.27–29 PVL is shown as periventricular regions that are hypointense on T1 weighted imaging30 and high signal intensity on T2 weighted imaging in the early neonatal period. These areas may become cystic and lead to dilatation of the lateral ventricles, particularly in the region of the posterior parietal white matter adjacent to the occipital horn. Additionally, areas of short T1, presumably a haemorrhagic component, have been identified in the acute/subcacute stage.31 DWI has identified PVL as areas of high signal intensity, representing restricted diffusion, before cysts were evident on ultrasound.32 Additionally, Roelants-van Rijn and colleagues33 reported high signal intensity on DWI adjacent to cystic areas, which we have also seen in an infant at 32 weeks GA with PVL (fig 4A–C). On histology, these areas were found to be undergoing active degeneration with cytotoxic oedema, apoptosis, and macrophage infiltration.33 We have noted increased T1 and T2 relaxation values in the white matter adjacent to cystic areas, probably representing more diffuse white matter damage.34 Chronically, DWI shows low signal areas in the affected white matter. At this time ADCs are elevated, representing frank cystic lesions and areas of vasogenic oedema. By term equivalent age, the cystic lesions are often incorporated into the lateral ventricles, resulting in the characteristic squared off appearance of the posterior horns (fig 4D). Frequent associated findings are thalamic atrophy35 and abnormal signal intensity within the PLIC.36 The latter may help predict neuromotor outcome.

PVL in an infant at 28 weeks GA. (A) Transverse T1 weighted image at the mid-ventricular level showing cystic PVL as areas of low signal within the cerebral white matter posterior and anterior to the lateral ventricles (arrows). (B) Transverse T2 weighted FSE image at the mid-ventricular level showing the cystic lesions as high signal intensity (arrows). (C) DWI image showing areas of restricted diffusion around the lateral ventricles as high signal intensity (arrows). (D) T2 weighted FSE image of the same infant at 40 weeks GA showing squared off posterior horns of the lateral ventricles (arrows) and diminished white matter posteriorly. Cystic lesions are shown anterior to the anterior horns of the lateral ventricles (arrowheads).
PVL is associated with delayed myelination, which is probably caused by extensive glial necrosis and oligodendrocyte dysfunction as a consequence of white matter injury.37 3D volumetric MRI has shown that preterm infants with PVL have a reduced cortical grey matter volume at term compared to both preterm infants with no evidence of PVL and normal term control infants.38 These findings suggest that PVL has an impact on cerebral cortical development, which may help to explain the cognitive deficits associated with this condition.
PUNCTATE HAEMORRHAGIC/ISCHAEMIC LESIONS
Non-specific focal lesions have been identified in the cerebral white matter on MRI studies of the preterm brain.39 These lesions are high signal intensity on T1 weighted imaging and frequently, but not always, low signal on T2 weighted imaging (fig 5), suggesting that they may be haemorrhagic/ischaemic rather than purely haemorrhagic. The distribution of lesions varies and is not restricted to the immediate periventricular white matter. These punctate lesions may develop into areas of long T2 consistent with gliosis on later MRI.40 Neurodevelopmental outcome appears to be inversely related to the number of lesions present on early MRI.40

(A) Transverse T1 weighted image of an infant at 29 weeks GA showing a high signal lesion adjacent to the optic radiation on the left (arrow). (B) Transverse T2 weighted FSE image showing the lesion as low signal (arrow).
INTRAVENTRICULAR/GERMINAL LAYER HAEMORRHAGE
The appearance of haemorrhage on MRI depends on the age and site of the haemorrhage, and the pulse sequence used (table 1).41 IVH usually arises from a GLH in preterm infants, and is the most common form of intracranial neonatal haemorrhage.42 The incidence of IVH in preterm infants increases with decreasing birth weight.42–44 An association between thrombophilic disorders, such as factor V Leiden heterozygosity, and IVH has recently been established.45 GLH is shown as low signal on T2 weighted imaging (fig 6) and high signal intensity on T1 weighted imaging. GLH may occur at any site along the immature ventricle wall, but most commonly arises from the germinal matrix over the caudate head and in the roof of the temporal horn. It can be differentiated from the normal germinal layer by its irregular appearance, and it is slightly more hypointense on T2 weighted imaging. The low signal intensity on T2 weighted imaging may persist for several months because of the presence of haemosiderin. GLHs were shown in one third of preterm infants on MRI in the early neonatal period.9 It is thought that this lesion may damage oligodendroglial progenitors and disrupt their migration, potentially resulting in impaired myelination. A further consequence of GLH may be damage to astrocytic precursors bound for the upper layers of the cerebral cortex, and thereby impairment of cortical neuronal development.46 Neurological outcome in infants with IVH depends largely on the severity of the haemorrhage and the site of any parenchymal infarction.47–50
Evolution of signal intensity in parenchymal haemorrhage41

Transverse T2 weighted FSE image of an infant at 27 weeks GA showing bilateral germinal layer haemorrhages (arrows).
PERIVENTRICULAR HAEMORRHAGIC INFARCTION
Blood in the cerebral white matter is drained by the medullary veins, into the veins of the germinal matrix, and finally into the terminal veins. Periventricular haemorrhagic infarction (PHI) probably occurs as a consequence of obstruction of venous drainage and subsequent infarction of the white matter.51 Diminished cerebral blood flow in the periventricular white matter has been shown by positron emission tomography,52 and Doppler ultrasound has shown reduced blood flow velocity in the terminal vein on the affected side,53 suggesting impaired venous drainage. The periventricular haemorrhage is shown as a fan shaped structure, due to obstructed medullary veins, of low signal intensity on T2 weighted FSE imaging (fig 7).54,55 Parenchymal haemorrhagic infarction results in interruption of projection and association fibres and oligodendroglial damage, which disrupts myelination. PHI and large GLHs may also affect the subplate neurones, which are concerned with cortical neuronal organisation and in the connection of association and projection fibres with the cerebral cortex.46 It is possible that injury to the subplate neuronal layer may result in cognitive delays and attention deficits in this group of infants.56

(A) Sagittal and (B) coronal T2 weighted FSE image of an infant at 27 weeks GA, showing bilateral intraventricular/germinal layer haemorrhages with parenchymal involvement on the right in a fan shaped distribution (arrows).
Large PHI is associated with a high incidence of mortality57,58 which is related to the extent of the lesion.59–61 In surviving infants, a porencephalic cyst usually develops at the site of the lesion. Infants with a unilateral lesion and asymmetry in the myelination of the posterior limb of the internal capsule on term MRI have a high incidence of hemiplegia. This may not be due to primary involvement of the posterior limb of the internal capsule, but may occur secondarily as a result of Wallerian degeneration.62
CEREBELLAR HAEMORRHAGE
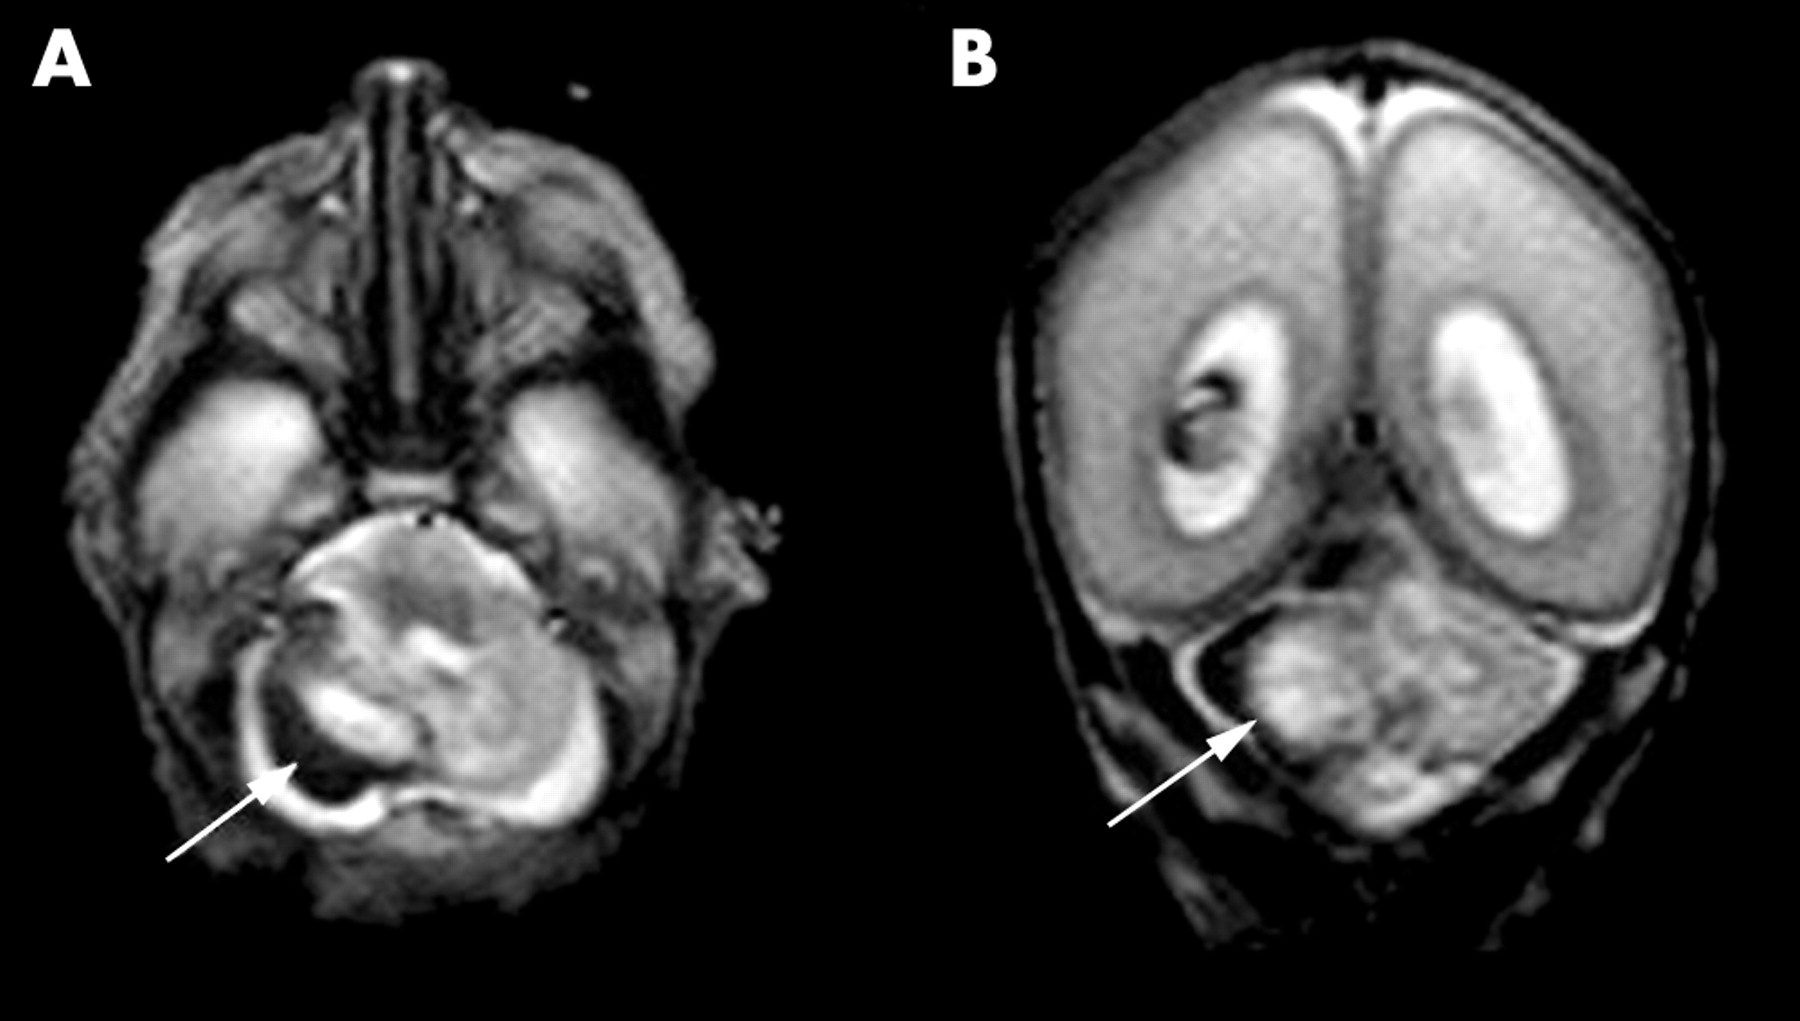
Cerebellar haemorrhage has been observed in 10–25% of very low birth weight preterm infants at postmortem examination63 and is associated with traumatic birth,64 injury from tightly bound ventilator masks,65,66 and supratentorial haemorrhage.63,65,67 Using the posterior fontanelle, ultrasound has shown cerebellar haemorrhage in just under 3% of preterm infants weighing less than 1500 g, most of whom did not have extensive supratentorial haemorrhage.68 We have seen haemorrhagic lesions within the cerebellum on MRI in 8% of preterm infants born at less than 32 weeks gestation, and the incidence increased with decreasing GA69 (fig 8). Morbidity is high for infants with large supratentorial and cerebellar haemorrhages.64,70 In those that survive, specific neurological signs related to cerebellar damage are difficult to show,71 and the neurological signs that occur may be due to co-occurring lesions. In the light of evidence that the cerebellum plays an important role in cognitive functioning,72 further studies are required to assess the impact of isolated cerebellar haemorrhages on neurodevelopmental outcome.68
(A) Transverse and (B) coronal T2 weighted FSE images of an infant at 25 weeks GA showing a haemorrhage within the cerebellum on the right (arrow).
QUANTITATIVE MR IN PRETERM BRAIN INJURY
Quantitative MR techniques have identified anomalies which are not visualised on conventional MRI. Preterm infants at term have higher ADC values in the central white matter and lower relative anisotropy than infants born at term.73 Additionally, ADC values are raised in the posterior limb of the internal capsule, and regional anisotropy in the thalamus and cortical grey matter is altered in preterm infants with intrauterine growth retardation compared to appropriately grown preterm infants at term equivalent age, suggesting altered development of these regions.74
Although brain volume in preterm infants at term was similar to that of infants born at term, the surface area of the cortex and cortical folding was reduced in preterm infants.12 Additionally, Peterson et al showed reduced volumes of the basal ganglia, corpus callosum, amygdala, hippocampus, and cerebellum in preterm infants at 8 years of age compared with term born controls.75 These findings provide objective evidence that brain development differs in preterm infants compared to infants born at term.
Quantitative MR techniques are also providing an insight into the effects of drugs; for example, 3D volumetric MRI has shown a reduction in cortical grey matter volume in preterm infants treated with dexamethasone when compared to untreated preterm infants, implying that dexamethasone impairs cortical grey matter development.76 Similar findings have been reported in term infants exposed to multiple doses of antenatal steroids.77
REFERENCES
Linked Articles
- Fantoms