
Abstract
BACKGROUND AND PURPOSE: Deep gray matter involvement is a consistent feature in multiple sclerosis. The aim of this study was to evaluate the relationship between different deep gray matter alterations and the development of subcortical atrophy, as well as to investigate the possible different substrates of volume loss between phenotypes.
MATERIALS AND METHODS: Seventy-seven patients with MS (52 with relapsing-remitting and 25 with progressive MS) and 41 healthy controls were enrolled in this cross-sectional study. MR imaging investigation included volumetric, DTI, PWI and Quantitative Susceptibility Mapping analyses. Deep gray matter structures were automatically segmented to obtain volumes and mean values for each MR imaging metric in the thalamus, caudate, putamen, and globus pallidus. Between-group differences were probed by ANCOVA analyses, while the contribution of different MR imaging metrics to deep gray matter atrophy was investigated via hierarchic multiple linear regression models.
RESULTS: Patients with MS showed a multifaceted involvement of the thalamus and basal ganglia, with significant atrophy of all deep gray matter structures (P < .001). In the relapsing-remitting MS group, WM lesion burden proved to be the main contributor to volume loss for all deep gray matter structures (P ≤ .006), with a minor role of local microstructural damage, which, in turn, was the main determinant of deep gray matter atrophy in patients with progressive MS (P ≤ .01), coupled with thalamic susceptibility changes (P = .05).
CONCLUSIONS: Our study confirms the diffuse involvement of deep gray matter in MS, demonstrating a different behavior between MS phenotypes, with subcortical GM atrophy mainly determined by global WM lesion burden in patients with relapsing-remitting MS, while local microstructural damage and susceptibility changes mainly accounted for the development of deep gray matter volume loss in patients with progressive MS.
ABBREVIATIONS:
- DD
- disease duration
- DGM
- deep gray matter
- DMT
- disease-modifying treatment
- EDSS
- Expanded Disability Status Scale
- FA
- fractional anisotropy
- HC
- healthy controls
- LL
- lesion load
- MD
- mean diffusivity
- PMS
- progressive MS
- QSM
- Quantitative Susceptibility Mapping
- rCBV
- relative CBV
- RRMS
- relapsing-remitting MS
Deep gray matter (DGM) involvement is generally regarded as a consistent feature in MS, generating particular interest due to its clinical relevance.1
Indeed, the occurrence of DGM atrophy in these patients, often described as an early phenomenon,2,3 has been proved by several volumetric MR imaging studies, with a significant correlation with clinical disability, cognition, and disease progression.3⇓–5
Along with volume loss, a wide range of pathologic changes affecting the DGM of patients with MS has been also demonstrated using different advanced MR imaging techniques. In particular, DTI studies showed the presence of microstructural damage in these structures,6⇓⇓–9 while PWI and Quantitative Susceptibility Mapping (QSM) studies described decreased cerebral perfusion10⇓⇓–13 and a complex pattern of susceptibility changes14⇓⇓–17 affecting the DGM of patients with MS, respectively.
Although atrophy most certainly reflects neuronal loss, the main causes driving its development in MS are still debated. Indeed, DGM volume loss could be either due to the occurrence of primary local pathology or secondary to WM inflammatory damage, leading to Wallerian degeneration and deafferentation.18,19 From this background and despite the relatively wide knowledge about the multifaceted involvement of DGM in MS, a study simultaneously investigating the contribution to the development of subcortical GM atrophy of these different physiopathologic changes is, to date, lacking.
We therefore collected different MR imaging variables related to distinct aspects of DGM damage in patients with both relapsing-remitting MS (RRMS) and progressive MS (PMS), to investigate the relationship between these alterations and the development of subcortical GM atrophy, as well as the possible different physiopathologic substrates of DGM volume loss between MS phenotypes.
Materials and Methods
Subjects
In this single-center observational study, 77 patients with MS (52 RRMS and 25 PMS according to the 2013 revised definition of MS phenotypes20) and 41 healthy controls (HC) were enrolled from October 2013 to July 2015 in a neuroimaging study of neuroinflammatory disorders.21,22 All patients with MS fulfilled the 2010 revised McDonald criteria,23 while none of the HC presented with any condition that could affect the CNS. For all patients, the Expanded Disability Status Scale (EDSS) score was determined within 1 week from MR imaging by an experienced neurologist as an index of clinical disability, along with the record of disease duration (DD) and disease-modifying treatment (DMT) type (On-line Table 1).
Demographic and clinical characteristics of all subjects included in the analysis are provided in Table 1.
All subjects' demographics and clinical variablesa
Standard Protocol Approvals, Registrations, and Patient Consents
The protocol was approved by the “Carlo Romano” ethics committee for biomedical activities of “Federico II,” University of Naples, and written informed consent was obtained from all participants before the beginning of the study in accordance with the Declaration of Helsinki.
MR Imaging Data Acquisition and Processing
A complete description of all the acquired sequences, along with all processing procedures, is available in the On-line Appendix.
Briefly, the acquisition protocol included a 3D T1-weighted sequence used for volumetric analyses, a 3D-FLAIR sequence for the quantification of demyelinating lesion load (LL) volume, an echo-planar imaging sequence for the dynamic susceptibility contrast–PWI analysis, an unenhanced 3D double-echo FLASH sequence for the calculation of QSM maps, and, in a subgroup of 59 patients (38 RRMS, 21 PMS) and 38 HC, an echo-planar imaging sequence for DTI analysis.
DGM segmentation was achieved using the FIRST routine (FMRIB Integrated Registration and Segmentation Tool; http://fsl.fmrib.ox.ac.uk/fsl/fslwiki/FIRST) implemented in FSL, Version 5.0.10; the latter was also used to extract fractional anisotropy (FA) and mean diffusivity (MD) maps from the DTI datasets. PWI data were analyzed using Olea Sphere software, Version 2.3 (Olea Medical, La Ciotat, France) to generate relative cerebral blood volume (rCBV) and relative CBF maps. A complete description of all processing steps required for the calculation of QSM images is available in Palma et al,24 Borrelli et al,25 and Palma et al.26
For each subject, DTI, PWI, and QSM maps were coregistered to the 3D T1-weighted sequence via affine registration, and segmentation masks were used to obtain DGM volumes and mean values for each MR imaging metric (Fig 1).

Results of the coregistration between different MR imaging modalities (upper row), with superimposed deep gray matter masks (lower row). From left to right, 3D T1-weighted volume, fractional anisotropy, mean diffusivity, relative cerebral blood volume, relative cerebral blood flow, and Quantitative Susceptibility Mapping images.
Statistical Analysis
Distribution of all data was preliminarily checked with graphs and tests (ie, the Levene test for homoscedasticity and the Kolmogorov-Smirnov test for normality), and those variables showing a significantly skewed distribution (namely, LL) were normalized by log-transformation.
Group differences were probed by the Student t (age, DD), Pearson χ2 (sex, DMT), and Mann-Whitney (EDSS) tests, while differences in MR imaging metrics were tested by ANCOVA analyses, including age, sex, and DD (when comparing MS subgroups) as covariates.
To determine the main contributors to subcortical GM atrophy in patients with MS, we conducted analyses as follows. For each DGM structure, the relationship between advanced MR imaging metrics and the respective normalized volume was preliminarily investigated using partial correlation analyses (age-, sex-, and DD-corrected) in the whole MS population and within the different subgroups. Variables showing a significant correlation with DGM volume loss were entered in the third and final step of each hierarchic multiple linear regression analysis, in which volume was set as the dependent variable and clinical and demographic variables (age, sex, DD, and type of DMT) were entered in the first block and LL in the second step.
Finally, to explore the potential additional value of multiple MR imaging parameters for the prediction of clinical disability in all groups, we also preliminarily investigated the relationship between the EDSS score and DGM metrics that proved to be significantly different between patients with MS and HC via partial correlation analyses (age-, sex-, and DD-corrected). MR imaging metrics showing a significant correlation with EDSS were then entered in the fourth and final block of a hierarchic multiple linear regression analysis for the prediction of clinical disability, including clinicodemographic variables in the first step, LL in the second block, and DGM volumes in the third step, with the same analysis also probed within different MS subgroups.
All analyses were performed with the Statistical Package for the Social Sciences, Version 24 (IBM, Armonk, New York), with a significance level set at P < .05, Bonferroni-corrected for multiple comparisons. For the regression analyses, multiple-comparison correction was adopted for the models only, while independent predictors were considered significant at P < .05.
Data Availability
Anonymized data will be shared by request from any qualified investigator.
Results
Demographic and Clinical Findings
The MS and HC groups did not significantly differ in age (P = .34) and sex (P = .54). Similarly, when we compared PMS and RRMS, the 2 subgroups did not show any significant difference in terms of age (P = .17), sex (P = .73), DD (P = .09), or DMT (P = .34), with patients with progressive MS showing a more severe clinical impairment compared with those with RRMS (P < .001).
Between-Group MR Imaging Analysis
A complete list of the results of the between-group analysis regarding MR imaging metrics is available in Table 2.
MRI metrics for all subjects included in the analysisa
Compared with HC, patients with MS showed a significant reduction of all brain volumes (all with P < .001), with the PMS subgroup presenting with a slightly higher lesion load compared with the RRMS group (P = .03, not significant after Bonferroni correction), while no differences emerged between phenotypes in terms of brain tissue volumes.
A significant atrophy of both the thalamus and basal ganglia was found in MS compared with HC (all with P < .001), with increased MD values in patients at the level of caudate nucleus and thalamus (P < .001) and a trend toward increased FA in the putamen (P = .02, not significant after Bonferroni correction). Finally, patients showed a reduction of susceptibility values in the thalamus compared with HC (P = .001), while no differences emerged for PWI measures.
When possible differences between MS phenotypes were probed, PMS compared with RRMS showed a significant volumetric reduction of the thalamus (P = .005), caudate (P = .007), globus pallidus (P = .001), and, to a lesser extent, the putamen (P = .02, not significant after Bonferroni correction), with borderline higher MD (P = .05, not significant after Bonferroni correction), significantly reduced rCBV values (P = .002) at the level of the caudate nucleus, and a trend toward higher FA in the putamen (P = .05, not significant after Bonferroni correction).
Partial Correlation Analyses
A complete list of all the results obtained from the preliminary correlation analyses is available in the On-line Appendix and corresponding On-line Tables 2 and 3.
Relationship between Advanced MR Imaging Metrics and DGM Volumes
A list of the results of the regression analyses investigating the relations between advanced MR imaging metrics and DGM volumes in patients with MS as well as within different subgroups is reported in Tables 3 and 4, respectively.
Results of the analyses exploring the relationship between MRI measures and DGM volume in the entire MS group
Results of the analyses exploring the relationship between MRI measures and DGM volume in the MS subgroups
The regression analysis conducted on the entire MS group showed that LL (all with P ≤ .02) and microstructural GM changes (all with P ≤ .001) were independent predictors of volume loss for the investigated DGM structures, with an additional significant contribution of susceptibility changes to the development of thalamic volume loss (P = .007).
When the regression analyses were probed in the different MS phenotypes, LL proved to be a constant independent predictor of volume loss for all the DGM structures in the RRMS group (all with P ≤ .006), with an additional and relative contribution of local microstructural GM changes in the development of thalamic (P = .02) and caudate (P = .04) atrophy. On the other hand, microstructural damage was the main determinant of DGM atrophy in patients with PMS (all with P ≤ .01) without a significant value of global MR imaging measures but coupled with susceptibility changes in the development of volume loss at the level of the thalamus (P = .05).
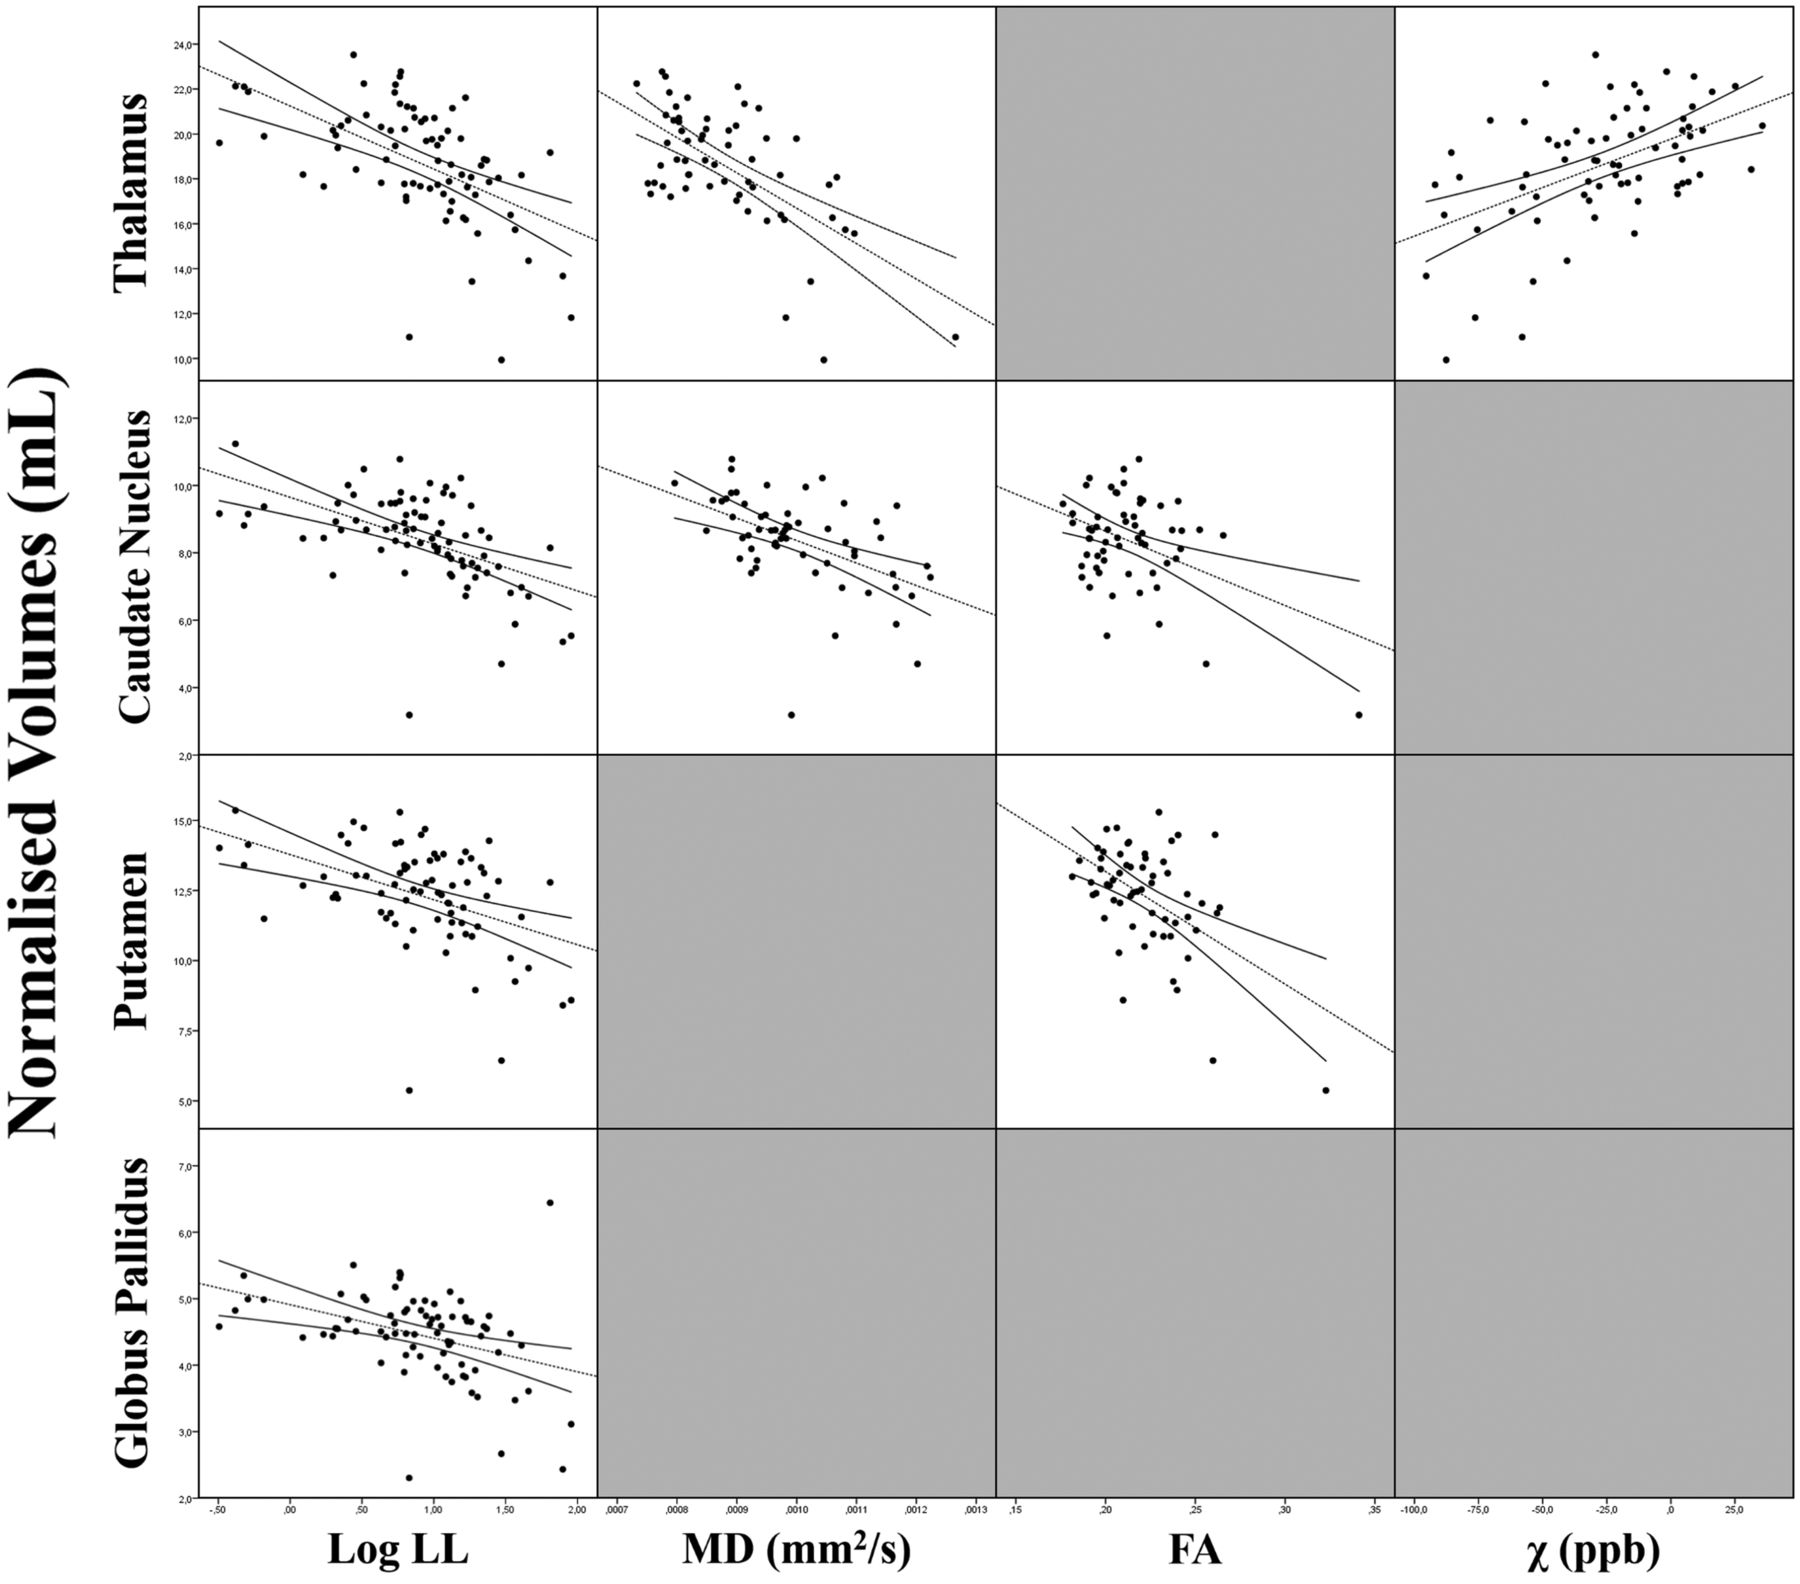
Scatterplots of the relationships between DGM volumes and significant MR imaging predictors in patients with MS and within the different subgroups are shown in Figs 2 and 3, respectively.

Scatterplot matrix showing the correlations between DGM volumes and their significant MR imaging predictors in the regression analyses in patients with MS.

Scatterplot matrices of the correlations between DGM volumes and their significant MR imaging predictors in the regression analyses in patients with RRMS (A) and PMS (B).
Relationship between DGM Metrics and Clinical Disability
The regression analysis showed that the only independent predictor of clinical disability in the MS group was thalamic volume (standardized β = −0.306, P = .02), which explained, in addition to clinicodemographic variables and LL, 32.2% of the variance of the EDSS (ΔR2 = 5.6%, P < .001) without incremental explanation of the variance provided by other advanced MR imaging measures (On-line Table 4). No significant differences between RRMS and PMS emerged in the same analysis.
Discussion
In this study, we used a multimodal MR imaging approach to investigate different features of DGM involvement in MS, confirming the presence of a diffuse and multifaceted involvement of subcortical GM structures in this condition. We demonstrated that WM lesion burden represents the main determinant of DGM atrophy in RRMS, with a concomitant though relative role of local microstructural damage, which, in turn, proved to be the main contributor to the development of subcortical GM volume loss in PMS, along with thalamic susceptibility changes.
In accordance with the great corpus of scientific literature that describes subcortical GM atrophy as an early and consistent feature of MS, strictly linked with disease course and clinical progression,2⇓⇓–5 we found significant DGM atrophy in our group of patients. This volume loss was more pronounced in PMS, a finding also consistent with previous evidence,2 in line with the hypothesis of a prominent role of neurodegenerative phenomena in the pathophysiology of this phenotype.18,27
Furthermore, our results confirm the presence of microstructural damage in the DGM of patients with MS, mostly affecting the caudate nuclei and thalami. These findings, also in substantial accordance with previous evidence,6⇓⇓–9 can be considered as a reflection of microstructural damage due to demyelination and axonal injury, which cause a net loss of structural barriers facilitating water diffusion, while the increased FA might be explained by extra-axonal phenomena such as the loss of dendritic connections and/or the swelling of neuronal cell bodies.7,8
On the other hand, we failed to find significant alterations of PWI parameters in patients with MS compared with HC, a result in conflict with some previous studies in which decreased perfusion of these structures was described.10⇓–12,28,29 A possible explanation for this discrepancy could reside in the different methodologic approaches between our work (in line with those available in a study analyzing PWI data with a method similar to ours30) and these previous studies conducted using hand-drawn ROIs11,28,29 (which had operator dependencies) or voxel-based approaches10,12 (which provide different, though complementary, information). Most interesting, when we compared MS phenotypes, a reduction in rCBV values of the caudate nuclei in patients with PMS compared with RRMS was proved. Different mechanisms could explain this finding, mainly related to a decreased neuronal metabolic demand secondary to atrophy,13,30 though primary neuronal metabolic dysfunctions and alterations of cerebral vasculature have also been proposed.13,30
Finally, at the QSM analysis, patients with MS showed a significant reduction of magnetic susceptibility values in the thalamus compared with HC, in line with recent quantitative MR imaging studies.14⇓⇓–17 The physiopathologic basis of this altered susceptibility could reside in the variable association of reduced paramagnetic components (ie, iron) and increased diamagnetic components (ie, myelin and/or calcium). Thus, several hypotheses have been proposed, including increased myelin density due to GM loss, calcium deposition, and, in particular, iron depletion. The latter could be an indirect consequence of tissue loss and/or could result from an active process of iron removal from damaged oligodendrocytes, related to chronic microglia activation, ultimately leading to neurodegeneration.14⇓⇓–17
When investigating the contribution of different MR imaging metrics to the development DGM atrophy in MS subgroups, we found that a global MR imaging measure of WM damage (namely, the LL) was a constant significant predictor of volume loss for all DGM structures for the patients with RRMS, with an additional, though relative, contribution of local microstructural GM changes in the development of thalamic and caudate atrophy only. This result confirms a suggested possible role of WM lesions in driving atrophy of the highly connected subcortical GM structures, most likely through axonal transection leading to disconnection, with a subsequent degeneration along axonal projections.2,31
On the other hand, microstructural damage proved to be the main determinant of DGM atrophy in patients with PMS, without a significant role of LL, corroborating the role of local microstructural damage as a possible primary determinant of neuronal loss and subsequent atrophy in subcortical GM.6–7
Furthermore, when we evaluated the determinants of thalamic atrophy in PMS, a direct effect of the reduced susceptibility values found in this structure on its volume was found, in apparent contrast with the common notion of iron increase as a possible driver of neurodegeneration in MS.32 A possible explanation for this last result could be found in the peculiar morphofunctional architecture of the thalamus. Indeed, this structure, due to its rich connectivity profile, shows a high oligodendrocyte density, being more prone to secondary effects from remote injury in other areas of the brain.17 Thus, a chronic microglial activation could lead to thalamic oligodendroglial damage, with subsequent iron release, generating, in turn, a vicious cycle reducing axonal protection and neuronal repair, eventually leading to neurodegeneration.17
All these results, taken together, support the hypothesis that different MS phenotypes could be characterized by distinct physiopathologic mechanisms, with a more prominent role of primary GM pathology in patients with PMS, which occurs, at least in part, independent from global WM lesion burden.1,19,27
Finally, we explored the clinical impact of these DGM alterations, proving that thalamic volume was the only significant predictor of EDSS score, without any additional value provided by the other tested MR imaging measures. This result confirms and expands the current knowledge about the clinical relevance of thalamic atrophy in MS, which could represent a common pathway through which both WM lesions and local DGM pathology contribute to clinical disability.3⇓–5,33 Indeed, the thalamus is involved in all the major functional circuits in the brain, providing a point of convergence across multiple cortical, limbic, brain stem, and cerebellar systems; therefore, it is easy to understand how its volume loss could represent one of the most clinically relevant biomarkers of disease in MS.33
Some limitations of the present study should be acknowledged. In particular, additional physiopathologic information on DGM structures could have been obtained using other advanced MR imaging techniques (eg, magnetization transfer ratio, MR spectroscopy, or functional MR imaging) or with voxelwise approaches, while a longitudinal evaluation could have helped unravel the causal relationships among different aspects of DGM pathology as well as between subcortical GM alterations and clinical disability. Thus, future studies are warranted simultaneously investigating the role of additional different aspects of DGM pathology and their evolution with time, coupled with more extensive neurologic and neuropsychological examinations, to further expand our knowledge of the physiopathology and the clinical relevance of DGM damage in MS.
Conclusions
Our study provides additional information about DGM involvement in patients with MS, showing the presence of alterations of different MR imaging metrics as a possible reflection of neurodegenerative and neuroinflammatory processes in these structures. Furthermore, our results demonstrate the presence of a different behavior of DGM atrophy in MS phenotypes, with subcortical GM volume loss mainly determined by global WM lesion burden in patients with RRMS, while local microstructural damage, along with susceptibility changes, account for the development of the significant DGM atrophy occurring in patients with PMS.
Footnotes
Giuseppe Pontillo and Sirio Cocozza contributed equally to this work.
Disclosures: Sirio Cocozza—UNRELATED: Payment for Lectures Including Service on Speakers Bureaus: Genzyme. Roberta Lanzillo—UNRELATED: Consultancy: Biogen, Merck, Teva Pharmaceutical Industries, Novartis; Payment for Lectures Including Service on Speakers Bureaus: Teva Pharmaceutical Industries, Biogen, Merck, Novartis, Genzyme. Enrico Tedeschi—UNRELATED: Payment for Lectures Including Service on Speakers Bureaus: Scientific Press, Ars Educandi, Genzyme; Payment for Development of Educational Presentations: Scientific Press, Ars Educandi, Genzyme. Vincenzo Brescia Morra—UNRELATED: Board Membership: Novartis, Biogen, Teva Pharmaceutical Industries, Mylan, Bayer AG, Merck, Genzyme, Roche; Consultancy: Novartis, Biogen, Teva Pharmaceutical Industries, Mylan, Bayer AG, Merck, Genzyme, Roche; Expert Testimony: Novartis, Biogen, Teva Pharmaceutical Industries, Mylan, Bayer AG, Merck, Genzyme, Roche; Grants/Grants Pending: Novartis, Biogen, Teva Pharmaceutical Industries, Mylan, Bayer AG, Merck, Genzyme, Roche*; Payment for Lectures Including Service on Speakers Bureaus: Novartis, Biogen, Teva Pharmaceutical Industries, Mylan, Bayer AG, Merck, Genzyme, Roche; Payment for Development of Educational Presentations: Novartis, Biogen, Teva Pharmaceutical Industries, Mylan, Bayer AG, Merck, Genzyme, Roche; Travel/Accommodations/Meeting Expenses Unrelated to Activities Listed: Novartis, Biogen, Teva Pharmaceutical Industries, Mylan, Bayer AG, Merck, Genzyme, Roche. Arturo Brunetti—UNRELATED: Travel/Accommodations/Meeting Expenses Unrelated to Activities Listed: Bracco, GE Healthcare, Comments: Tickets and hotel accommodation were provided by Bracco for participation in a 1-day a meeting concerning MR contrast media in 2017. Hotel accommodations were provided by GE Healthcare for participation in a 1-day user meeting in 2017. No money provided directly. *Money paid to institution.
This study received funding from the Italian Ministry of Education, University, and Research within the Progetto di Ricerca di Interesse Nazionale framework (2010XE5L2R).
Indicates open access to non-subscribers at www.ajnr.org
References
- Received July 18, 2018.
- Accepted after revision October 29, 2018.
- © 2019 by American Journal of Neuroradiology


Jump to section
Related Articles
Cited By...
- Quantitative MRI in Multiple Sclerosis: From Theory to Application
- Lesion Volume in Relapsing Multiple Sclerosis is Associated with Perivascular Space Enlargement at the Level of the Basal Ganglia
- A Combined Radiomics and Machine Learning Approach to Overcome the Clinicoradiologic Paradox in Multiple Sclerosis
- Tissue damage detected by quantitative gradient echo MRI correlates with clinical progression in non-relapsing progressive MS
- Unraveling Deep Gray Matter Atrophy and Iron and Myelin Changes in Multiple Sclerosis
- The Development of Subcortical Gray Matter Atrophy in Multiple Sclerosis: One Size Does Not Fit All
- What Causes Deep Gray Matter Atrophy in Multiple Sclerosis?