
Abstract
BACKGROUND AND PURPOSE: The sensitivity of contrast-enhanced 3D-FLAIR has not been assessed in patients with idiopathic intracranial hypertension. The purpose of this study was to evaluate whether hyperintensity of the optic nerve/optic nerve head on contrast-enhanced 3D-FLAIR imaging is associated with papilledema in patients with idiopathic intracranial hypertension.
MATERIALS AND METHODS: A retrospective review was conducted from 2012 to 2015 of patients with clinically diagnosed idiopathic intracranial hypertension and age- and sex-matched controls who had MR imaging with contrast-enhanced 3D-FLAIR. Two neuroradiologists graded each optic nerve/optic nerve head on a scale of 0–3. This grade was then correlated with the Frisén Scale, an ophthalmologic scale used for grading papilledema from 0 (normal) to 5 (severe edema). To estimate the correlation between the MR imaging and Frisén scores, we calculated the Kendall τ coefficient.
RESULTS: Forty-six patients (3 men, 43 women) with idiopathic intracranial hypertension and 61 controls (5 men, 56 women) with normal findings on MR imaging were included in this study. For both eyes, there was moderate correlation between the 2 scales (right eye: τ = 0.47; 95% CI, 0.31–0.57; left eye: τ = 0.38; 95% CI, 0.24–0.49). Interreader reliability for MR imaging scores showed high interreader reliability (right eye: κ = 0.76; 95% CI, 0.55–0.88; left eye: κ = 0.87; 95% CI, 0.78–0.94). Contrast-enhanced 3D-FLAIR imaging correlates with the Frisén Scale for moderate-to-severe papilledema and less so for mild papilledema.
CONCLUSIONS: Hyperintensity of the optic nerve/optic nerve head on contrast-enhanced 3D-FLAIR is sensitive for the detection of papilledema in patients with idiopathic intracranial hypertension, which may be useful when prompt diagnosis is crucial.
ABBREVIATIONS:
- CE
- contrast-enhanced
- ICP
- intracranial pressure
- IIH
- idiopathic intracranial hypertension
- OD
- right eye
- ON
- optic nerve
- ONH
- optic nerve head
- OS
- left eye
Idiopathic intracranial hypertension (IIH) is an uncommon neurologic condition characterized by elevated intracranial pressure (ICP), which is associated with headaches, diplopia, and papilledema. In rare cases, vision loss has been described in IIH; in cases of fulminant IIH, this deficit has been documented to occur within days of symptom onset.1 Vision loss, however, can be halted or even reversed if detected in time, making prompt diagnosis of IIH critical.2 IIH is diagnosed clinically using the updated Modified Dandy Criteria, the clinical criterion standard that consists of the following: papilledema or other signs and symptoms related to generalized increased ICP, elevated ICP with normal CSF composition, and a neuroimaging study performed to exclude a cause of elevated ICP.1 The severity of papilledema in patients with IIH is graded by the Frisén Scale, the ophthalmologic scale for papilledema severity, which ranges from 0 to 5 and denotes normal, very early, early, moderate, marked, and severe papilledema.3⇓–5
In contrast to the clinical diagnosis of IIH, the neuroimaging diagnosis of IIH remains a diagnosis of exclusion. Historically, the role of imaging in IIH has been to exclude secondary causes of increased ICP in patients with clinically diagnosed papilledema.3 However, patients presenting with visual changes or other signs of increased ICP have undergone imaging before funduscopic examination.3 This has created an opportunity for neuroimaging to serve as a primary diagnostic tool for clinically suspected IIH. Several radiologic findings of papilledema and IIH have been previously described, including flattening of the globe, protrusion of the optic nerve (ON), a partially empty sella, and transverse sinus stenosis.6⇓⇓⇓⇓⇓–12 Postcontrast enhancement of the optic nerve head (ONH) is also a known finding in IIH.6,10 Additionally, hyperintensity of the ONH on diffusion-weighted imaging has also been described.3 However, DWI has several intrinsic limitations, which may restrict its use in the diagnosis of IIH. DWI is typically performed with thick sections limiting the visualization of the optic nerve and thereby decreasing the overall sensitivity of the imaging study; additionally, field distortions and other artifacts often seen with DWI in the region of the orbit further limit the sensitivity of DWI for the detection of ONH signal abnormalities.3
In the catalogue of descriptions of the radiologic findings of IIH, the MR imaging pulse sequences used in the previous studies are widely varying, with no study to date systematically evaluating the potential role of contrast-enhanced (CE) 3D-FLAIR imaging for the sensitive and specific detection of IIH. Hyperintensity of the ON on CE FLAIR imaging has been used previously in evaluating other abnormalities of the optic nerve, including neuropathy, neuritis, and atrophy.13,14 We present the first systematic investigation of CE 3D-FLAIR hyperintensity for the evaluation of the ON and ONH for the detection of papilledema in patients with IIH and also present corroborating clinical data that demonstrate both the sensitivity and specificity of our neuroimaging findings.
Materials and Methods
Subject Population and Controls
This retrospective study was approved by the University of Wisconsin-Madison institutional review board. A retrospective chart review was performed on consecutive patients with known disease seen in our neuro-ophthalmology clinic between January 2012 and December 2015. The inclusion criteria were patients who had been diagnosed with IIH by a staff neuro-ophthalmologist using the Modified Dandy Criteria and who also had contemporaneous contrast-enhanced MR imaging of the brain with CE 3D-FLAIR imaging. The severity of papilledema in the subject group was graded by a neuro-ophthalmologist using the Frisén Scale, the ophthalmologic scale for papilledema severity, which ranges from 0 to 5 and denotes normal, very early, early, moderate, marked, and severe papilledema.3⇓–5
Age- and sex-matched control subjects were identified sequentially and in chronologic order from a list of MR imaging studies of patients without IIH, retrieved by conducting a text search of the Radiology Information System of our institution. The search criteria for the text search included the desired age ± 2 years, sex parameters, the key words “unremarkable study” in the radiology report, and completion of the study between January 2012 and December 2015. A subsequent chart review was then performed on all identified control patients to further exclude control subjects with a history of intracranial pathology, increased ICP, a history of neurologic surgery, or any other history to suggest a possible diagnosis of IIH. This chart review included any clinic notes from the ordering physician as well as any neurology, neurosurgery, or ophthalmology notes if applicable. Clinical and demographic data were collected for all patients with IIH and controls (Table 1). All control patients were considered negative controls and were presumed to have normal funduscopic examination findings, given that there was no indication in the patient chart that the controls met the Modified Dandy Criteria.
Demographic and clinical information of study and control cohorts
Brain MR Imaging Acquisition
MR imaging was performed on 1.5T and 3T MR imaging scanners (GE Optima MR450w, GE Signa HDxt, GE Discovery MR750w; GE Healthcare, Milwaukee, Wisconsin). An 8-channel receiver head coil was used for image acquisition. All MR imaging contained the following sequence: contrast-enhanced 3D sagittal T2-weighted FLAIR images acquired on 1.5T and 3T magnets. The sagittal 3D-FLAIR sequence was performed as the initial sequence following the intravenous contrast injection of 0.1 mmol/kg of gadobenate dimeglumine (MultiHance; Bracco Diagnostics, Princeton, New Jersey). Coronal and axial reconstructions were subsequently created. The sagittal, coronal, and axial series were available for image review.
Neuroimaging Evaluation
A grading scheme for evaluation of the ON and ONH on CE 3D-FLAIR imaging was modeled on the 3- and 4-point scales used in previous studies to evaluate hyperintensity.3,6 The grading scale is as follows: 0 = normal; 1 = mild hyperintensity of the ON without involvement of the ONH; 2 = moderate hyperintensity of the ON and ONH as well as mild inversion of the ONH; and 3 = marked hyperintensity of the ON and ONH with severe inversion of the ONH (Fig 1). The degree of hyperintensity was ultimately a subjective evaluation of optic nerve signal intensity in relation to the signal intensity of the temporal lobe white matter. Two experienced neuroradiologists with Certificates of Added Qualification, blinded to clinical and demographic data, evaluated the signal intensity of the ON and ONH on CE 3D-FLAIR imaging for both patients with IIH and controls. The images for both the patients with IIH and controls were intermixed and presented to each blinded neuroradiologist in random order. Each ON was evaluated independently and was individually scored with the aforementioned grading scale. An ophthalmologic diagnosis of IIH using the Modified Dandy Criteria was viewed as the criterion standard; therefore, both the true presence and the true severity of the disease were determined by the ophthalmologic examination. True disease severity was graded by the neuro-ophthalmologist using the Frisén Scale.

CE 3D-FLAIR images obtained in 4 different patients illustrate the grades of edema seen within the optic nerve and optic nerve head on MR imaging: 0 = normal (A), 1 = mild hyperintensity of the ON without involvement of the ONH (arrows, B), 2 = moderate hyperintensity of the ONH as well as mild inversion of the ONH (arrows, C), and 3 = marked hyperintensity of the ONH with severe inversion of the ONH (arrows, D).
Statistical Methods
To assess interrater reliability (2 readers) for MR imaging on the 0- to 3-point grading scale and binary scale interpretation, we estimated the Cohen κ (quadratically weighted and unweighted, respectively) using the ‘psych’ package (Version 1.7.8; https://cran.r-project.org/web/packages/psych/psych.pdf) in R (Version 3.4.3; http://www.r-project.org/) along with 95% bias-corrected and accelerated–bootstrapped confidence intervals.15 For the binary MR imaging scale only, sensitivity and specificity estimates were calculated for each reader along with 95% Agresti-Coull confidence intervals. To estimate the correlation between MR imaging and Frisén Scale scores, we calculated a nonparametric correlation coefficient (Kendall τ) along with the associated 95% bias-corrected and accelerated–bootstrapped confidence interval (4000 iterations) for each eye. Because optic nerve appearance on MR imaging and fundoscopy is thought to be temporally associated with one another, a sensitivity analysis was conducted via bootstrap simulation to determine whether patients whose MR imaging and funduscopic images were obtained >30 days apart were significantly influencing the estimated correlation between MR imaging and Frisén Scale scores.
Results
Demographic and Clinical Characteristics
During the study period, 78 patients were clinically diagnosed with IIH on the basis of their clinical funduscopic examination findings by our neuro-ophthalmology colleagues. Following the application of exclusion criteria (no imaging performed, imaging performed at a referring facility, imaging without CE 3D-FLAIR, date of imaging outside the study parameters, and a history of intracranial pathology or instrumentation), 46 patients were included in our study. The study population consisted of 3 men and 43 women with a mean age of 29.6 ± 11 years. The incidence of IIH is significantly higher among women, especially young women and women with obesity. That disparity is reflected therefore in both our patient population and also in our control sample. Frisén Scale scores for the study patients ranged from 0 to 5, with a histogram pictured in Fig 2. Sixty-one patients with normal findings on MR imaging were included in this study. The control population consisted of 5 men and 56 women, with a mean age of 30.9 ± 11.7 years. The indications for MR imaging in these patients were the following: headache (n = 26; 42.6%), inner ear symptoms such as hearing loss or vertigo (n = 11; 18.0%), nonspecific neurologic symptoms such as confusion (n = 5; 8.2%), vision changes (n = 4; 6.6%), neuropathies (n = 4; 6.6%), screening for masses in oncology or patients with transplants (n = 3; 4.9%), trauma (n = 2; 3.3%), pituitary symptoms (n = 2; 3.3%), seizures (n = 2; 3.3%), and anosmia (n = 1; 1.6%).
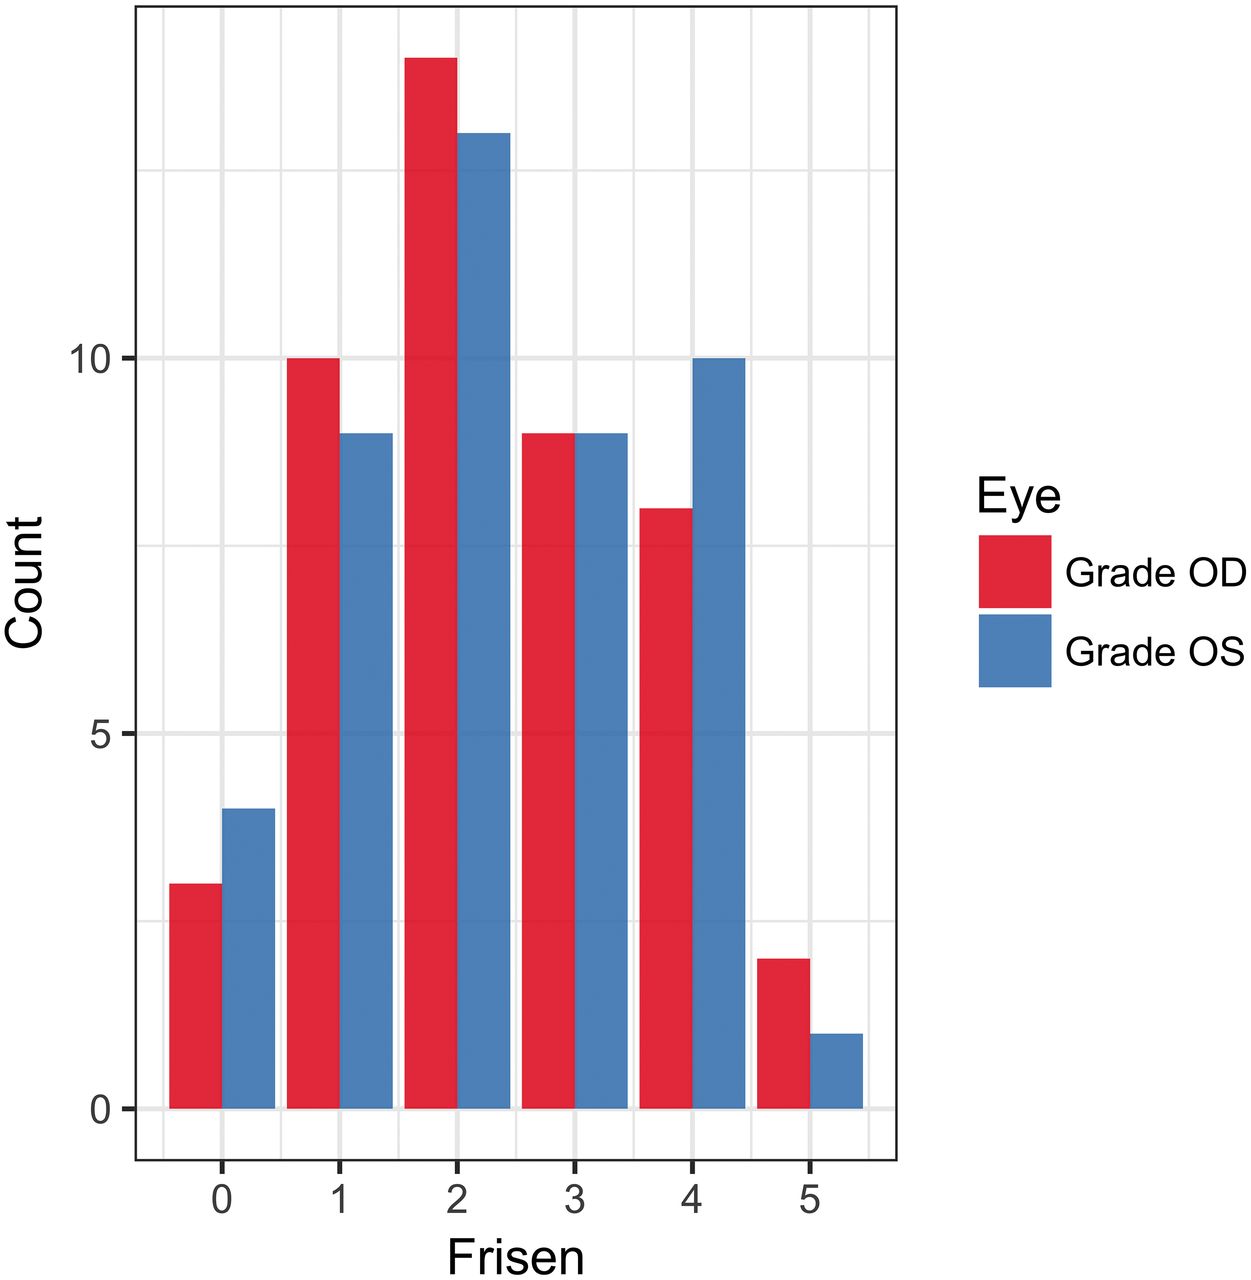
Histogram of observed Frisén Scale scores in the patient group for both OD and OS.
ON and ONH CE FLAIR Imaging Evaluation
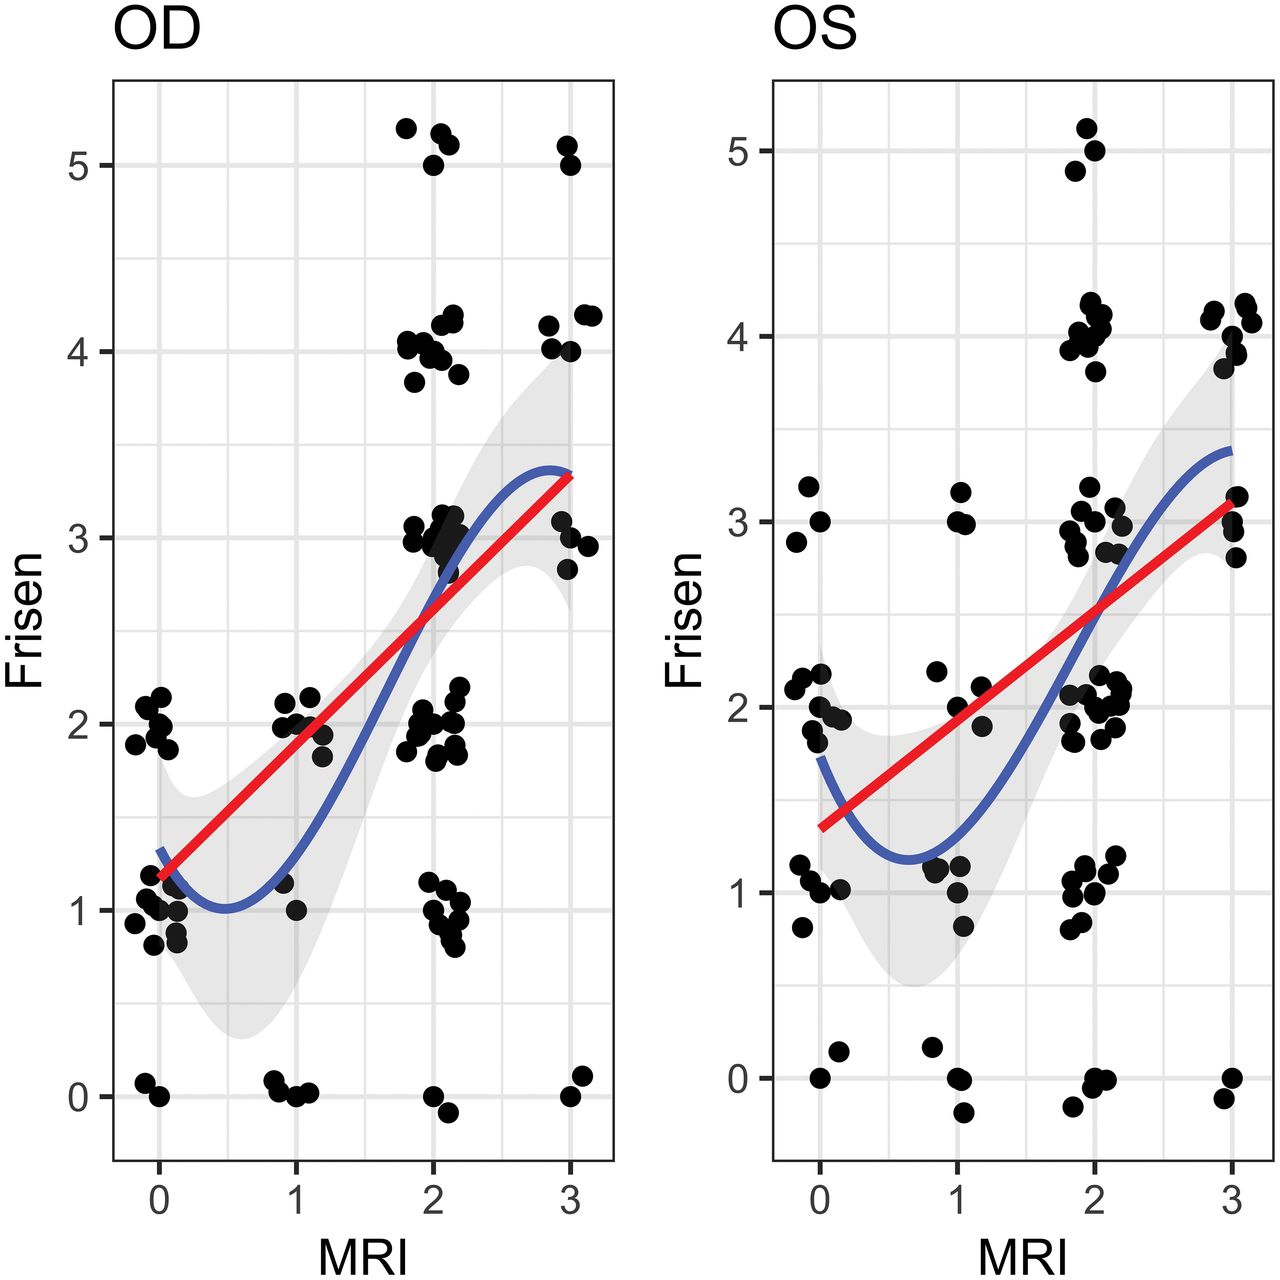
Following blinding of clinical and demographic data, the ON and ONH in each patient (IIH and controls) were independently evaluated by both readers. MR imaging findings were considered positive if given any nonzero score on the scale in our study. Each reader found that there was a greater incidence of hyperintensity of the ON/ONH on CE 3D-FLAIR imaging among the patients with IIH than among the control group. For reader 1, hyperintensity of at least 1 ON was 84.4% sensitive (95% CI, 75.7%–90.4%) and 100% specific (95% CI, 96.3%–100%) for the presence of papilledema. The correlation between reader 1's evaluation of the papilledema grade as measured on the scale of our study and the papilledema grade per the neuro-ophthalmologic Frisén Scale was as follows: right eye (OD): τ = 0.48; 95% CI, 0.32–0.61; left eye (OS): τ = 0.43; 95% CI, 0.24–0.57. For reader 2, hyperintensity of at least 1 ON was 77.1% sensitive (95% CI, 67.7%–84.4%) and 87.7% specific (95% CI, 80.6%–92.5%) for the presence of papilledema. The correlation between reader 2's evaluation of the papilledema grade as measured on the scale of our study and the papilledema grade per the neuro-ophthalmologic Frisén Scale was as follows: OD: τ = 0.46; 95% CI, 0.13–0.61; OS: τ = 0.33; 95% CI, 0.05–0.50. When we combined the scores from both readers, the correlation between the 2 scales was as follows: OD: τ = 0.47; 95% CI, 0.31–0.57; OS: τ = 0.38; 95% CI, 0.24–0.49 (Fig 3).

Measured Frisén Scale and MR imaging scores for patients positive for IIH (with added jitter) for both OD and OS. The blue line represents the estimated cubic polynomial of best fit (with a 95% confidence band) and the red line represents the estimated linear regression.
Interreader reliability for the detection of abnormal signal intensity within the ON of those with IIH was assessed using a Cohen κ unweighted score and showed moderate-to-substantial agreement between the 2 readers (OD: κ = 0.73; 95% CI, 0.36–0.92; OS: κ = 0.76; 95% CI, 0.36–0.94). Interreader reliability for MR imaging grades on the scale of our study was assessed using the Cohen unweighted κ (quadratic) and showed substantial-to-almost-perfect agreement between the 2 readers (OD: κ = 0.76; 95% CI, 0.55–0.88; OS: κ = 0.87; 95% CI, 0.78–0.94).
The range of time between the funduscopic evaluation and MR imaging in our study population was 0–86 days. Subgroup analysis conducted on a restricted group of patients with IIH who had undergone imaging or fundoscopy within 30 days of one another did not yield any statistically significant differences in results. The P values for the differences in the correlation coefficients between the study population and the restricted group are listed in Table 2.
P values for differences in the study population correlation coefficient and the restricted group correlation coefficient
Discussion
In this retrospective study, we sought to determine the sensitivity and specificity of CE 3D-FLAIR imaging to detect papilledema in patients with IIH and to further quantify the relationship between our proposed imaging measures of papilledema and the Frisén Scale, a clinical neuro-ophthalmologic grading scale of papilledema severity. Our results demonstrate that postcontrast FLAIR hyperintensity of the ON and ONH is strongly correlated with a clinical diagnosis of IIH and that postcontrast FLAIR hyperintensity of at least 1 ON is at once a robust, sensitive, and specific sign of papilledema. In an extension of our work, we present additional evidence of a positive correlation between the Frisén Scale and our proposed imaging measures of papilledema, highlighting both the clinical utility of our study and its translational potential.
3D-FLAIR imaging affords several built-in advantages when imaging the ON because it addresses many of the well-known challenges that come with optic nerve imaging. Optimal imaging of the optic nerve includes suppression of the orbital fat surrounding the optic nerve to circumvent high signal intensity and chemical shift artifacts, and fluid suppression to suppress the high signal from the CSF surrounding the optic nerve. Both fluid and fat suppression can be easily achieved with FLAIR imaging.16 While FLAIR can be acquired with a 2D or 3D acquisition, 3D-FLAIR has been shown to be superior to 2D-FLAIR for imaging optic neuropathy, highlighted by its ability to generate multiplanar reconstructions to follow tortuous ONs as well as the high spatial resolution afforded by 3D-FLAIR imaging.16 Because FLAIR imaging is also a standard feature of many brain imaging protocols, findings related to IIH in the optic nerve may be detected even if clinical concern has not yet prompted a request for orbit-specific imaging. Other sequences such as steady-state free precession sequences (eg, FIESTA or CISS) have been shown to adequately detect optic nerve findings seen with IIH, but unlike FLAIR, are often supplementary sequences performed for a specific indication.
Our neuroimaging findings of high postcontrast FLAIR signal in the optic nerve and optic nerve head are also consistent with prevailing biologic and biomechanical models of elevated intracranial pressure in which elevated intracranial pressure leads to axoplasmic stasis and subsequent neurotoxicity.17⇓⇓⇓⇓–22 Axoplasmic stasis is a phenomenon of interrupted axonal transport that results in swelling of nerve fibers, organelle aggregation, and subsequent metabolic waste accumulation leading to cytotoxicity.22 Elevated intracranial pressure is hypothesized to lead to the mechanical transduction of increased pressure along the optic nerve sheath that leads to compression of the surrounding vasculature and the resultant venous stasis.22 This venous stasis potentially accounts for the enhancement often seen at the optic nerve head in IIH.10,23 Other similar hypotheses and models propose the development of axonal ischemia occurring in the setting of increased ICP, which mechanically compresses the ciliary circulation.3,24 It is likely that multiple factors contribute to the edema and enhancement seen at the level of the optic nerve head.
Several studies in the literature have shown increased conspicuity of changes related to optic neuropathy in patients with suspected optic neuritis using a CE FLAIR technique.13,14 They theorized that the increased conspicuity on CE FLAIR is predominantly related to T2/FLAIR signal prolongation, with alternative potential contributions from enhancing scar, ongoing demyelination, or other mechanisms resulting in blood-brain barrier breakdown.13 We hypothesized that the observed hyperintensity within the ON and ONH in patients with IIH is related to synergistic effects between the edematous changes within the ON and ONH manifested on FLAIR and concomitant venous stasis, which may also be seen as enhancement, thus likely contributing to the observed increased sensitivity of this imaging sign on CE 3D-FLAIR. Venous status may result in breakdown of the blood-retinal barrier, ultimately leading to enhancement that is isolated to the optic nerve head in patients with IIH.10,23 It is unknown, however, how the timing of contrast relative to the acquisition of the 3D-FLAIR sequence affects the signal hyperintensity appreciated in the optic nerve and optic nerve head in these patients. At our institution, the 3D-FLAIR sequence is performed as the initial sequence after the administration of gadobenate dimeglumine (MultiHance). To fully understand the relative contribution of the T2 effects seen on FLAIR versus postcontrast effects, future investigation is needed to evaluate the sensitivity and specificity of 3D-FLAIR without contrast in patients with IIH.10,25
While CE 3D-FLAIR imaging shows evidence of papilledema in patients with IIH, with a reasonable amount of sensitivity and specificity, the correlation between the Frisén Scale and our scale was only moderately positive. The correlation differs with the different degrees of severity, with a more linear correlation for cases of moderate-to-severe papilledema and no correlation for cases of mild papilledema. This discrepancy could be partially due to the inherent subjectivity of our scale and reader disagreement on the subtleties of mild hyperintensity in the optic nerve versus normal signal. Image noise present in the axial and coronal reconstructions may also be a contributing factor to the discrepancy observed between the readers in cases of mild papilledema, but it is likely not a confounding factor in more severe cases of papilledema. The variability and discrepancy in mild states of disease have also been shown in previous studies.3 Viets et al,3 who investigated increased diffusion signal on DWI as an indicator of papilledema in patients with IIH, also found that their sign became more sensitive as the Frisén Scale grade increased. This finding suggests that hyperintensity of the optic nerve on FLAIR imaging cannot be used for a definitive diagnosis of all severities of IIH but may be useful for the detection of more severe IIH.
Whether the papilledema grade correlates with visual outcome is controversial.4,26 The papilledema grade has not been found to be correlated with the severity of visual impairment.27,28 However, some studies have also found that only patients who present with “obvious” papilledema on physical examination ever develop clinically meaningful visual impairment.28 In this subset of patients, the evidence suggests that the papilledema grade does correlate with the amount of vision loss at higher grades of papilledema.28,29 Additionally, patients who present with vision loss at the time of diagnosis also tend to have poor visual outcomes.24 This finding would suggest that the most useful diagnostic imaging study would be one that detects papilledema in patients who would ultimately be found to have moderate-to-severe papilledema on funduscopic examination.
The limitations of our study are those primarily related to the retrospective study design. It was not possible to obtain funduscopic photographs for the control group; therefore, the controls were assumed to have negative funduscopic examination findings (Frisén Scale = 0). Therefore, despite the best attempts to exclude control patients with a history of IIH, intracranial pathology, or instrumentation, a chart review cannot fully ensure that all control patients were true-negative controls. Another potential limitation is that a designated temporal relationship between a funduscopic photograph and MR imaging was not one of the inclusion criteria for this study. However, a subgroup analysis of patients who underwent MR imaging and had funduscopic photos within 30 days of one another did not show markedly different results than those presented here. Another limitation of this study is that the FLAIR images were not compared with postcontrast T1-weighted sequences. This limitation was due to the heterogeneity in neuroimaging protocols used in both the study and control populations, leading to a variety of different postcontrast sequences performed, thus limiting the ability to directly compare sequences.
Conclusions
Herein, we present the first application of CE 3D-FLAIR imaging for the detection of papilledema in patients with clinically diagnosed IIH and demonstrate that hyperintensity of the optic nerve on CE 3D-FLAIR is a sensitive and specific sign for papilledema in patients with IIH. Additionally, we show a moderately positive correlation between the degree of hyperintensity and the severity of papilledema as measured on the neuro-ophthalmologic Frisén Scale and demonstrate that this correlation is strongest in patients with severe papilledema. Therefore, significant hyperintensity of the optic nerve on CE 3D-FLAIR imaging is a useful detection tool for IIH in high-risk patients in whom prompt diagnosis is critical but neuro-ophthalmologic evaluation is not readily available.
Footnotes
Disclosures: John-Paul J. Yu—RELATED: Grant: National Institutes of Health KL2 Award, Brain and Behavior Research Foundation.* *Money paid to the institution.
J-P.J.Y. was supported by the University of Wisconsin School of Medicine and Public Health and the Department of Radiology, the Brain and Behavior Research Foundation Young Investigator Grant, and by the Clinical and Translational Science Award program, through the National Institutes of Health National Center for Advancing Translational Sciences, grant ULTR002373.
The content is solely the responsibility of the authors and does not necessarily represent the official views of the National Institutes of Health.
Indicates open access to non-subscribers at www.ajnr.org
References
- Received August 2, 2018.
- Accepted after revision November 23, 2018.
- © 2019 by American Journal of Neuroradiology


