
Abstract
BACKGROUND AND PURPOSE: Hypertension, one of the most important risk factors for strokes, is associated with altered arterial anatomy and function. In this study, we compared the visualization of the LSAs by 3T 3D-TOF-MRA and DSA and quantitatively examined the LSAs in patients with hypertension by using 3D-TOF-MRA.
MATERIALS AND METHODS: We first examined 126 patients with 3D-TOF-MRA and DSA and determined the number of LSAs. In addition, we examined 60 patients with hypertension and 60 nonhypertensive volunteers with 3D-TOF-MRA and determined the quantitative differences between the LSAs of these 2 groups.
RESULTS: The mean number of LSA stems visualized by DSA and 3D-TOF-MRA on 1 side was 4.1 ± 0.74 and 3.9 ± 0.94, respectively (P = .0617). The average number of LSA stems on both sides was 4.7 ± 0.8 in patients with hypertension and 6.3 ± 1.9 in nonhypertensive volunteers (P < .0001). The mean number of LSAs in the young hypertensive group (<50 years of age) and its age-matched nonhypertensive group was 4.8 ± 1.1 and 7.6 ± 1.2, respectively (P < .0001) and that in the old hypertensive group (≥50 years of age) and its age-matched nonhypertensive group was 4.6 ± 0.9 and 5.0 ± 1.0, respectively (P = .1088).
CONCLUSIONS: LSA detection showed good correlation between 3T 3D-TOF-MRA and DSA. As determined by 3D-TOF-MRA, there was a significant decrease in the number of LSA stems in patients with hypertension compared with that in nonhypertensive volunteers; moreover, the difference in young subjects was more than that in the elderly.
Abbreviations
- ACA
- anterior cerebral artery
- BP
- blood pressure
- CTA
- CT angiography
- DSA
- digital subtraction angiography
- LSA
- lenticulostriate artery
- MCA
- middle cerebral artery
- MOTSA
- multiple overlapping thin-slab acquisition
- MRA
- MR angiography
- 3D-TOF-MRA
- 3D time-of-flight MR angiography
- MIP
- maximum intensity projection
- SENSE
- sensitivity encoding
- SLINKY
- sliding interleaved Ky
- TONE
- tilted optimized nonsaturating excitation
Hypertension is considered to be one of the most important risk factors for strokes.1–3 Hypertension can alter the vascular structure, mechanics, and function of small arteries and arterioles.4,5 These changes disturb the structure and function of microcirculation, resulting in increased vascular resistance and reduced blood flow through the microvessels.5 LSAs are some of the most important vascular structures in the human brain and the sites of many neurologic diseases, though their diameter is not >0.5 mm.6 Ischemic and hemorrhagic cerebral strokes often occur in the areas of the brain supplied by these perforating arteries.7,8 Lacunar infarcts account for >20% of all strokes, and the basal ganglia are involved in 35%–44% of intracerebral hemorrhages.9,10 Thus, in vivo imaging of LSAs could provide important insights for understanding the pathophysiology and mechanism of microvascular diseases associated with hypertension.
Currently, DSA and CTA are the 2 key techniques used to visualize cerebral vessels. DSA uses the invasive intra-arterial approach, while CTA requires contrast agents that exhibit adverse effects ranging from minor allergic reactions to stroke.11 MRA is a noninvasive method for diagnosing vascular diseases, and it is rapidly becoming a critical tool for evaluating the condition of intracranial vessels.12 With the development of high-field-strength MR imaging, it is now possible to precisely and noninvasively visualize the microvasculature of the human brain, such as LSAs, in vivo, by using 3D-TOF-MRA.13–15
This study was divided into 2 parts: In the first part, we compared LSAs visualized by clinical 3T MRA and those observed on DSA. In the second part, we performed quantitative analysis of the LSA images obtained by 3T 3D-TOF-MRA and determined the differences between the LSAs of patients with hypertension and nonhypertensive volunteers.
Materials and Methods
Patients
Part 1.
We selected 126 participants (56 men and 70 women) from consecutive patients who underwent both MRA and DSA for suspected intracranial aneurysm, arteriovenous malformation, subarachnoid hemorrhage, arteriostenosis, and so forth. The patients who had disease on both sides were excluded. One hundred twelve sides of cerebral arteries of these patients were abnormal. We evaluated 140 sides of normal cerebral arteries: The right-side arteries were evaluated in 78 patients and the left-side arteries, in 62 patients. Informed consent was obtained from each participant. All patients were Chinese and between 24 and 84 years of age (mean age, 49.53 ± 8.1 years).
Part 2.
We enrolled 60 patients with hypertension and 60 nonhypertensive volunteers in this study. All the participants were selected from consecutive outpatients. Hypertension was defined as systolic/diastolic BP of ≥140/90 mm Hg according to the seventh report of the Joint National Committee on Prevention, Detection, Evaluation, and Treatment of High Blood Pressure.16 The participants were comfortably seated for at least 5 minutes before measurement of their BP. A single BP measurement was recorded from the first and fifth Korotkoff sounds by using a mercury sphygmomanometer. Each measurement was performed at least twice for each reading. The patients were divided into hypertensive and nonhypertensive groups on the basis of their BP measurements. In the case of patients with hypertension, a definite diagnosis of hypertension by a physician was required.
All the participants underwent fasting MRA examinations in the morning; they had to avoid strenuous exercise and be comfortably seated for at least 5 minutes before the examination. The patients with hypertension who took antihypertensives underwent this examination before taking the drugs. The BP was measured before and after the scan according to the above-mentioned procedure. The patients with hypertension and those without hypertension were divided into 6 groups according to their ages (≥20, ≥30, ≥40, ≥50, ≥60, and ≥70 years, respectively). There were 10 patients (5 men and 5 women) in each group. The patients in the hypertensive and nonhypertensive groups were age- and sex-matched. Informed consent was obtained from each participant. All participants were Chinese and between 21 and 79 years of age (mean ages, 53.41 ± 9.2 and 54.78 ± 8.5 years for patients and volunteers, respectively) (Table 1).
Demographic comparison of patients with hypertension and nonhypertensive volunteers
MRA Examination
For all participants, MRA was performed on a 3T system (Achieva X-Series; Philips Healthcare, Best, the Netherlands) with an 8-channel SENSE receiver head coil. TOF-MRA was performed with the following parameters: TR/TE, 35/7 ms; flip angle, 20°; FOV, 250 × 190 × 108; 4 slabs (180 sections); section thickness, 0.8 mm; matrix, 732 × 1024; and acquisition time, 8 minutes 56 seconds We used several techniques to ensure superior image quality for visualizing small cerebral arteries and aneurysms, including the SENSE technique, TONE, MOTSA, and SLINKY. The acquired image datasets were then transferred to a workstation (EWS, Philips Healthcare), where image reconstruction was performed by using a 1024 × 1024 matrix with an MIP software package (Volume Inspection, Philips Healthcare). MIPs were reconstructed for coronal slabs (thickness, 20 mm; overlap, 10 mm; 9 sections) and axial slabs (thickness, 20 mm; overlap, 10 mm; 5 sections) from the axial raw dataset of the TOF-MRA scans. We created an MIP of the region of interest by observing the LSAs primarily in the main trunk of the MCA and the ACA. In the first part, we determined the extent of visible LSAs in the normal side from both the coronal- and axial-slab MIPs combined with the raw data. Herein, we report the number and origin of the visible LSA stems. In the second part, we determined the extent of visible LSAs for both sides from both the coronal- and axial-slab MIPs, combined this data with the raw data, and reported the number of LSA stems.
DSA Examination
An interventional neuroradiologist performed DSA when clinically feasible immediately after MRA (the interval between MRA and DSA varied from 1 hour to 14 days; median time, 11.6 days). Conventional 2D-DSA was performed on a monoplanar digital angiography unit (Axiom Artis VB22N; Siemens, Erlangen, Germany) with a 1024 × 1024 matrix and a 17- to 20-cm FOV. The contrast medium was injected at a flow rate of 4–5 and 2–3 mL/s in 2 projections; therefore, a total of 10 mL of medium was injected into the internal carotid artery, and 7 mL was injected into the vertebral artery. The image data were transferred to a workstation (syngoXWP VA70B, Siemens) for analysis.
Statistical Analyses
In the first part, a Student (independent) t test was used for analysis. We determined the number of visible LSA stems (originating from the A1, M1, and M2) by the 2 methods (DSA and MRA). In the second part, the LSA stems of patients with hypertension and nonhypertensive volunteers were analyzed quantitatively. The differences between the mean values of the 2 groups were analyzed by using the Student (independent) t test. The differences in the sex, number of smokers, and morbidity rate of diabetes between the 2 groups were analyzed by using the χ2 test. The interobserver variability between the 2 readers who counted the LSAs was assessed on the basis of the κ values. SAS software (SAS Institute, Cary, North Carolina) was used for analysis, and the difference was considered to be statistically significant when P < .05.
Results
The κ value of indicated strong agreement between the 2 readers (κ value > 0.75).
In the first part, 3D-TOF-MRA with MIP clearly showed multiple LSA stems originating from the MCA and ACA. We determined the origin and counted the number of LSAs (Fig 1). The total number of LSAs visualized from the 2 slabs of MIP images of 3D-TOF-MRA of 126 subjects is shown in Table 2. There was no statistically significant difference between the mean number of the LSA stems of 1 side visualized on DSA and MRA (4.1 ± 0.74 and 3.9 ± 0.94 per side, respectively; P = .0617). The maximum number of LSA stems visualized by both DSA and MRA on 1 side was 5.

3T 3D-TOF-MRA and DSA images of the LSAs (in 69-year-old woman). A and B, 3D-TOF-MRA with MIP shows that 4 LSA stems branch from the right MCA. C, DSA shows that the number of LSA stems on 1 side is 4.
Number and origin of LSAs on MRA and DSA
In the second part, the average number of LSA stems on both sides in patients with hypertension was 4.7 ± 0.8 and that in nonhypertensive volunteers was 6.3 ± 1.9 (P < .0001) (Figs 2 and 3). There was a statistically significant difference between the number of LSA stems in the 2 groups. The demographic comparison of patients with hypertension and nonhypertensive volunteers is shown in Table 1. We divided all patients with hypertension and nonhypertensive volunteers into 2 groups: young individuals (<50 years) and old individuals (≥50 years). The average number of LSA stems on both sides in the young hypertensive group was 4.8 ± 1.1, whereas that in the age-matched nonhypertensive group was 7.6 ± 1.2 (P < .0001). The average number of LSA stems on both sides in the old hypertensive group was 4.6 ± 0.9, whereas that in the age-matched nonhypertensive group was 5.0 ± 1.0 (P = .1088). The hypertension duration was >10 years in 39 patients and <10 years in 21 patients, and the number of LSA stems on both sides in these patients was 4.4 ± 0.9 and 5.6 ± 1.1, respectively (P < .0001).

3T 3D-TOF-MRA images of the LSAs of a patient with hypertension (a 39-year-old woman, BP = 154/100 mm Hg). Coronal MIP with a slab thickness of 20 mm (A) and axial 20-mm MIP (B) clearly show the LSAs branching from the MCA. The total number of the LSA stems counted from both sides is 4.
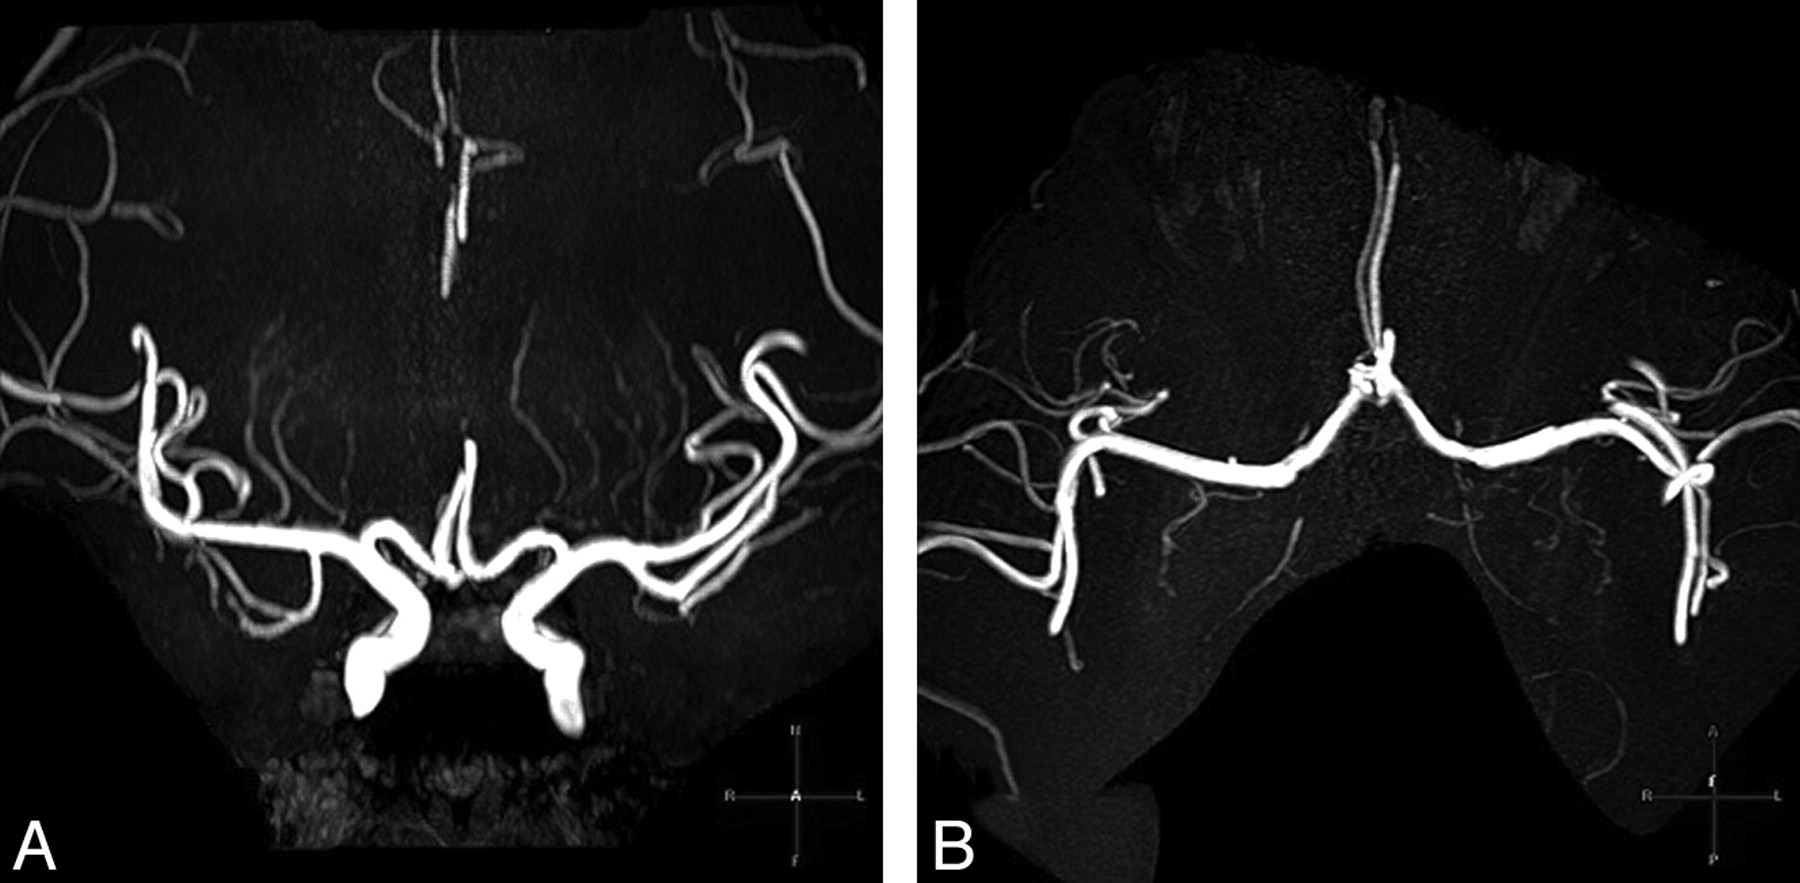
3T 3D-TOF-MRA images of the LSAs of an age-matched nonhypertensive volunteer (a 32-year-old woman, BP = 126/78 mm Hg). Coronal MIP with a slab thickness of 20 mm (A) and an axial 20-mm MIP (B) clearly show the LSAs branching from the MCA and the ACA. The total number of the LSA stems counted from both sides is 7.
Discussion
DSA is considered the criterion standard for angiography.7 The anatomy of LSAs has been previously studied by using DSA.17,18 However, because DSA is highly invasive, it is not easy to obtain information with this procedure. DSA requires not only the administration of a contrast medium but also x-ray exposure. Cho et al13 and Von Morze et al19 studied LSAs by using MRA and concluded that it is possible to visualize the anatomic structures in human brain, such as LSAs, in vivo, by using a 7T system. However, a 7T scanner is not used in clinical practice.
In the first part of our study, we used 3T 3D-TOF-MRA to detect LSAs without administering contrast media. A phased-array coil and short TEs were used to increase the quality of MRA images, which was achieved by using strong gradients and long acquisition times. A high signal intensity–to-noise ratio improved scan quality greatly through wide acquisition matrices (≤732 × 1024), which did not produce grainy images. The scanning time was extended to 8 minutes 56 seconds to increase the resolution. We used TONE to improve the display of outflow from a 3D volume. To smooth the uneven background suppression, which might be the main disadvantage of TONE, we simultaneously applied MOTSA and SLINKY. The scanning field was divided into 4 slabs, and the overlapping thickness was one-fourth of the thickness of each slab, which afforded a smoother vessel appearance than that obtained from the conventional MRA. Furthermore, SLINKY improved the display of vessels with slow blood flow, which allowed the visualization of complex vascular lesions.
The results of the first part of the study indicated that there was no statistically significant difference between MRA and DSA for detecting LSA stems. Therefore, we observed LSA stems in the second part of the study. We found that the number of LSA stems between patients with hypertension and nonhypertensive volunteers was noticeably different. The possible explanations for this finding are as follows.
First, because hypertension resulted in microvascular rarefaction in various organs, the absolute number of LSAs may be reduced.20 Hypertension alters the structure and function of microcirculation. Furthermore, it alters the mechanisms regulating vasomotor tone, which results in enhanced vasoconstriction or reduced vasodilator responses. Moreover, there are anatomic alterations in the structure of individual precapillary resistance vessels, such as an increase in their wall-to-lumen ratio. Finally, changes in the microvascular network lead to reduction in the number of arterioles or capillaries within the vascular beds of various tissues, which is called vascular rarefaction.5
Second, it may be difficult to visualize small vessels on 3T MRA. On one hand, this difficulty is because of the narrowing of the peripheral small arteries and arterioles. Small vessel disease is a key pathologic characteristic of hypertension, which specifically involves the narrowing and vasoconstriction of the peripheral small arteries and arterioles and increases peripheral vascular resistance. Such narrowing is not only associated with increased blood pressure but also with systemic markers of inflammation and possibly endothelial dysfunction.21 Hence, the diameter of a number of LSAs in patients with hypertension may be below the imaging resolution of 3T MRA.22 On the other hand, visualization may be hampered because of the decrease in signal intensity; this lowered intensity is attributed to reduced blood flow through the microvessels caused by increased peripheral vascular resistance and/or structural changes in the LSAs associated with hypertension.
We also found that there was a significant difference in the number of stems of the LSAs between patients with hypertension and nonhypertensive volunteers <50 years of age. However, there was no difference in the older group (≥50 years). The difference between the 2 groups disappeared with age, possibly because of other factors independent of hypertension. The density of cerebral microvasculature decreases with age,23 and luminal narrowing (caused by mural diseases such as atherosclerosis, hyalinosis, and arteriosclerosis) is one of the distinguishing features of aging adults.24 After 60 years of age, retinal arteriolar diameter decreases with age, and this effect is independent of hypertension.25 The anatomic and physiologic features of retinal arterioles are similar to those of cerebral arterioles; therefore, changes in retinal arteriolar diameter may reflect similar changes in cerebral arterioles.26
There was a significant difference in the number of LSA stems in patients with different durations of hypertension, which suggested that the duration of hypertension had some effect on the small intracranial vessels. Some studies suggested a decrease in the arteriolar width equivalents, which is associated with the cumulative microvascular damage from hypertension with time.21,25
Smoking, obesity, and diabetes mellitus are associated with the incidence of cardiovascular disease and stroke. However, in this study, there were no statistically significant differences in the number of smokers, body mass index, and the morbidity of diabetes between patients with hypertension and nonhypertensive volunteers. Therefore, the results suggested that hypertension was associated only with the number of LSAs.
Conclusions
Both 3T 3D-TOF-MRA and DSA can be used for visualizing LSAs and observing microvascular structures in vivo. This study provides additional evidence of a direct relationship between cerebral microvascular changes and hypertension.
Acknowledgments
We thank Qiang Shi for help with data analysis.
Indicates open access to non-subscribers at www.ajnr.org
References
- Received November 8, 2010.
- Accepted after revision March 13, 2011.
- © 2011 by American Journal of Neuroradiology
In this issue


Jump to section
Related Articles
Cited By...
- Visualization of Lenticulostriate Arteries on CT Angiography Using Ultra-High-Resolution CT Compared with Conventional-Detector CT
- Visualization of Lenticulostriate Arteries by Flow-Sensitive Black-Blood MR Angiography on a 1.5T MRI System: A Comparative Study between Subjects with and without Stroke