Article Text

Abstract
Background On average, cognition declines as people age, but improvement can also occur.
Objective To evaluate the dynamics of age-related changes in brain structure and cognitive function in patients with mild Alzheimer's disease (AD) and mild cognitive impairment (MCI) and in healthy control (HC) older adults.
Methods High-resolution 3-Tesla MRI and clinical data were obtained from the Alzheimer's Disease Neuroimaging Initiative in 187 subjects (a cohort aged 55–91 years; AD=43, MCI=84, HC=60). At 24 months, 151 people had clinical and 128 had MRI follow-up. Brain structure was assessed using the Medial Temporal Atrophy Scale (MTAS) and the Brain Atrophy and Lesion Index (BALI). Cognition was assessed using the Mini-Mental State Examination (MMSE) and the Alzheimer Disease Assessment Scale-cognitive subscale (ADAS-cog). Responsiveness was tested. Changes were analysed using a multistate dynamic model, adjusted for age, gender, ApoE4 genotype and vascular risk factors.
Results Over 2 years, decline in brain structure and cognition predominated, each showing detectable effect sizes (Cohen's d=0.33 for MTAS, 0.32 for BALI, 0.41 for MMSE, 0.38 for ADAS-cog; standard response mean=0.71, 0.69, 0.50 and 0.47, respectively). Structural improvement was observed (10.2% in BALI and 0.8% in MTAS), as was cognitive improvement (23.2% MMSE, 27.2% ADAS-cog). Most people (66.7%) whose BALI score improved also improved in either the MMSE or ADAS-cog. No patient with MCI whose MTAS or BALI improved converted to AD.
Conclusions Despite average decline in brain structure, improvement was observed and related to cognition and MCI–AD conversion. Ageing-related brain changes reflect a dynamic process.
- Alzheimer's Disease
- Cognition
- Dementia
- Mri
- Neuroradiology
Statistics from Altmetric.com
Introduction
On average, as people age, cognition declines. Even so, stability is common and cognitive improvement often occurs. Such improvement is seen in mild cognitive impairment (MCI), even though it is a significant risk for dementia1 and occurs with important pathological changes.2 Compellingly, a recent report that closely replicated the MCI criteria used in clinical studies, confirmed that in community-based older adults, clinically important improvement (or as they termed it, ‘reversion’ to normal cognition) occurred in one-third of people with incident MCI.3 If not just decline, but also improvement can occur in a pre-dementia state, what does that tell us about brain ageing? The hypothesis of cognitive dynamics says that what happens in the ageing brain reflects the interaction between factors that impair cognitive function and those that resist impairment.4 ,5 Thus, the brain is less an innocent bystander, passively losing out and instead is more an active combatant. In most cases, improvement results from therapeutic interventions,6 ,7 but even in the pretreatment era, investigators reported both stability and improvement in individuals, including people with dementia.8–11
Understanding how improvement might be observed and whether it is real or just a problem of reliability has motivated us to develop multi-state models that examine change. These models allow us to evaluate changes in all directions (decline, stability, improvement). By modelling cognitive test scores, we have been able, in several datasets, to assay the intrinsic dynamics of age-related changes in brain function; this has yielded very similar results, replicable across different populations, even with different measures of cognitive function.12 ,13 Compared with evaluating change in cognition, a more severe test of the hypothesis of the dynamics of brain ageing would be to demonstrate it with structural brain changes.
To facilitate the simultaneous evaluation of multiple possible structural changes, we first developed the Brain Atrophy and Lesion Index (BALI), which summarises structural changes common in the ageing brain.14 ,15 The same multistate, multivariable model used to assay change in cognition12 ,13 was then used to evaluate change in the BALI. Such precise modelling requires data on people whose brain had been well characterised in longitudinal inquiries. For this, we queried the MRI and clinical data on patients with Alzheimer's disease (AD), MCI and healthy control (HC) subjects from the Alzheimer's Disease Neuroimaging Initiative (ADNI) database.16 Our specific goals were to investigate (1) the frequency, magnitude and agreement between short-term (24 months) change in brain structure and cognition and their change in relation to change in diagnosis and (2) how common risk factors affect brain structural and cognitive dynamics.
Subjects and methods
Data
Data used in the preparation of this article were obtained from the ADNI database.16 Launched in 2003 by the National Institute on Aging, the National Institute of Biomedical Imaging and Bioengineering, the Food and Drug Administration and private pharmaceutical companies and non-profit organisations, as a multimillion, 5-year public–private partnership, the primary goal of ADNI is to test whether serial MRI, positron emission tomography, other biological markers and clinical and neuropsychological assessments can be combined to measure the progression of MCI and early AD. ADNI is the result of efforts of many co-investigators from a broad range of academic institutions and private corporations. The principal investigator of ADNI is Michael W Weiner. A complete listing of ADNI investigators is available at http://www.loni.ucla.edu/ADNI/Collaboration/ADNI_Manuscript_Citations.pdf.
Subjects have been recruited from over 50 sites across the USA and Canada. The initial goal of ADNI was to recruit 800 adults (ages 55–90 years); approximately 200 cognitively normal older individuals to be followed up for 3 years, 400 people with MCI to be followed up for 3 years and 200 people with early AD to be followed up for 2 years.
Data on all of the 187 subjects (a cohort aged 55–91 years; 50.3% women) who had high-field (3-Tesla) MRI scans were retrieved from the ADNI dataset for this analysis. At baseline, 43 people had AD, 84 had MCI and 60 were cognitively healthy (HC). Over the 24-month follow-up, four people died (mean duration before death=8.3±6.5 months) and 32 withdrew (mean duration=17.5±7.8 months). Of the remaining 151 who completed the 24-month clinical assessments, 128 (AD=27, MCI=55, HC=46) also had repeat 3T MRIs. Missing cases were due to problems with scheduling, imaging acquisition, imaging quality or other diagnoses.
Clinical assessments
Two global cognitive measures were used: the 30-point Mini-Mental State Examination (MMSE), where a higher score is better and the 70-point Alzheimer's Disease Assessment Scale-cognitive subscale (ADAS-cog), in which a lower score is better. These assessments were performed before MRI scanning (mean interval 44.3±21.4 days (median 39 days) for the MMSE and 7.1±14.5 days (median 3 days) for the ADAS-cog). At follow-up the interval was shorter: 3.9±12.1 days (median=0 days) for both.
Diagnostic categorisation (ie, AD, MCI and HC) was made by ADNI site physicians in accordance with the National Institute of Neurologic and Communicative Disorders and Stroke/Alzheimer's Disease and Related Disorders Association (NINCDS/ADRDA) criteria and was reviewed by ADNI clinical monitors. Data on the cerebrospinal fluid biomarkers (amyloid beta Aβ 1–42 and phosphate-τ) and the apolipoprotein E4 (ApoE4) were retrieved from the ADNI laboratory bio-specimen databases. Baseline ADNI medical history and physical examination data were included on heart disease, hypertension, cardiovascular diseases, peripheral vascular disease, hypercholesterolaemia and smoking. These vascular risk factors were combined into a single summarising variable; a score was calculated for each subject as the count of vascular risk factors presented in the subject divided by six (ie, scored between 0 and 1).
Brain structural evaluations
The high-resolution anatomical MRI was acquired using a gradient echo sequence (TR=2300–3000 ms, TI=853–900 ms, flip angle=8–9°, FOV=256–260×240 mm, in-plane resolution=0.94–1×1 mm, slide thickness=1.2 mm).17 Images were evaluated in a random order by two experienced neuroradiologists, who were blind to subjects’ demographics, diagnosis and scan time. The Medial Temporal Atrophy Scale (MTAS) assesses bilateral medial temporal lobe atrophy (MTA), a characteristic MRI biomarker for AD and cognitive decline. It evaluates the width of the choroidal fissure and the temporal horn and the height of hippocampus to yield a score from 0 (no MTA on either side) to 8 (the most severe MTA; see online supplementary appendix 1).18 ,19 The BALI was established to summarise several common changes in the ageing brain, in response to the increasing need to quantify the combined effects of multiple coexisting brain deficits.20 ,21 The BALI rating schema adapted scales that evaluate lesions in the deep white matter, periventricular, basal ganglia regions and the infratentorial regions, deficits in the cortical grey matter, the extent of dilated small vessels and global atrophy, to yield a score ranging from 0 to 25 (a larger number represents more deficits; online supplementary appendix 1).14 ,15
Statistical analysis
For objective one, evaluation of how frequently changes occurred, non-parametric Kruskal–Wallis and χ2 tests were used, respectively, to examine group differences in interval variables and differences in categorical and/or ordinal variables. To evaluate the agreement between change in brain structure and cognitive function, we used correlation and regression analyses (linear and non-linear) and related brain structural measures and cognitive test scores to age and diagnosis. To estimate the magnitude of changes over 24 months in brain structure and cognition in differently denominated measures, we calculated two responsiveness tests: Cohen's d22 and standardised response means.23 In each case, the difference between change in scores forms the numerator; the denominator for the former is the pooled SD, compared with the SD of the change score for the latter. To evaluate inter-rater agreement, we calculated intraclass correlation coefficients for the MTAS and BALI scores.
To best compare models of state transitions in brain structure, the MTAS and BALI were each recoded to seven states (S0–S6; see online supplementary appendix 2). At these sample sizes, using just seven states allows both an even distribution of the various states, with sufficient numbers in each.13 Here S0 (denoting ‘no deficits’) represented the healthiest state and S6 the most impaired state. Likewise, the MMSE and ADAS-cog scores were recoded, using the convention that S0 represented the fewest test score errors and S6 the most (see online supplementary appendix 2). The multi-state transition model itself has two parameters to describe, respectively, each of the background components and the rate of deficit increment.12 ,13 Model parameters were estimated using a generalised linear model with Poisson distribution and a linear link function; for which age, sex, diagnosis, ApoE4 genotype and the vascular risk factor score were examined in a univariable model and used as confounders in a multivariable model. The Akaike information criterion and Bayesian information criterion were used to assess the goodness of fit of the generalised linear models. Correlation coefficients were calculated to illustrate how the models fit the empirical distribution of transition densities.
All analyses were performed using SPSS V.17.0 software package and codes developed using Matlab R2007. The significance level was set at p<0.05.
Results
Diagnostic groups did not differ significantly in their mean age, education level or proportion married (table 1). People with MCI were more often men, whereas more women were found in the AD and HC groups. As expected, a significant difference in cognitive performance (MMSE, ADAS-cog), cerebrospinal fluid biomarkers, ApoE4 status and brain structural deficits (MTAS, BALI) existed across diagnostic groups. Vascular risk factors were common in each group, though typically less often present in HC than in MCI and AD (table 1). Worsening in brain structure was significantly correlated with age, both for the overall sample (figure 1) and for people with MCI (figure 2). Weak but significant associations between cognition and age were found for HC (r=0.28–0.37; p=0.044–0.007) and stable MCI (r=0.26–0.31; p=0.056–0.016), but not for AD or MCI converters.
Baseline characteristics of the sample as grouped by outcomes

Baseline values of brain structural MRI measures (A, B) and cognitive measures (C, D) linked with those at 24-month follow-up for all subjects. ADAS-cog, Alzheimer's Disease Assessment Scale-cognitive subscale; BALI, Brain Atrophy and Lesion Index; MMSE, Mini-Mental Status Examination; MTAS, Medial Temporal Lobe Atrophy Scale. Symbols represent observational data (red diamonds: Alzheimer's disease (AD); blue circles: mild cognitive impairment (MCI); green triangles: healthy controls (HC). Lines represent curve fitting using an exponential function: f(x)=a·exp(b·age) at baseline (dashed lines) and at follow-up (solid lines). In A, baseline: a=0.368, b=0.028, r=0.466, p<0.001; follow-up: a=0.624, b=0.022, r=0.605, p<0.001. In B, baseline: a=2.557, b=0.019, r=0.840, p<0.001; follow-up: a=3.928, b=0.014, r=0.775, p<0.001. The correlation was not significant in C or D (p>0.05 in each case).
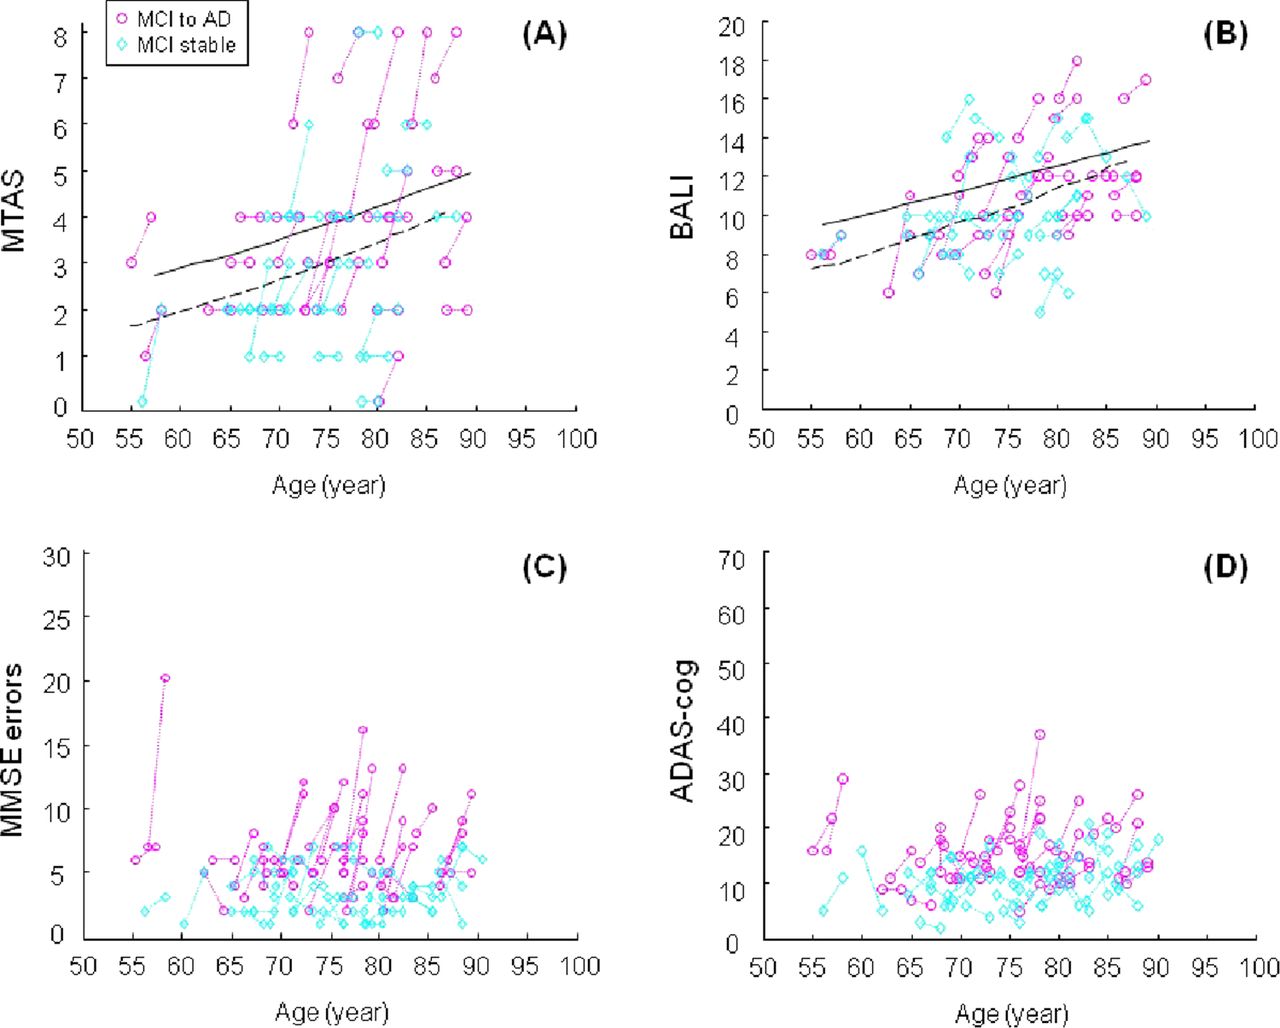
Baseline values of brain structural MRI measures (A, B) and cognitive measures (C, D) linked with those at 24-month follow-up for subjects with mild cognitive impairment (MCI). ADAS-cog, Alzheimer's Disease Assessment Scale-cognitive subscale; BALI, Brain Atrophy and Lesion Index; MMSE, Mini-Mental Status Examination; MTAS, Medial Temporal Lobe Atrophy Scale. Symbols represent observational data (purple circles: subjects who converted form MCI to Alzheimer's disease (AD); cyan circles: subjects who remained as MCI. Lines represent curve fitting using an exponential function: f(x)=a·exp(b·age) at baseline (dashed lines) and at follow-up (solid lines). In A, baseline: a=0.378, b=0.028, r=0.667, p<0.001; follow-up: a=0.690, b=0.022, r=0.583, p<0.001. In B, baseline: a=2.741, b=0.018, r=0.677, p<0.01; follow-up: a=4.836, b=0.012, r=0.600, p<0.001. The correlation was not significant in C or D (p>0.05 in each case).
Structural changes were moderately correlated with each other and variably with cognitive changes; change in the ADAS-cog was highly correlated with change in the MMSE (table 2). In general, the modal category of change for each of the MMSE, ADAS-Cog and BALI was decline (figure 3). As for the changes in cognition, structural changes were readily detectable, as demonstrated by both Cohen's d (MTAS=0.33; BALI=0.32; MMSE=0.41; ADAS-cog=0.38) and the standardised response mean (MTAS=0.71; BALI=0.69; MMSE=0.50; ADAS-cog=0.47). Considering the 128 subject with complete data, the numbers with any degree of worsening for MMSE, ADAS-cog and BALI were 68 (53%), 75 (59%) and 72 (56%), respectively; in contrast, the modal change in the MTAS represented stability, seen in 75 people (59%) (see online supplementary appendix 3).
Correlation coefficients of brain structure and cognitive function changes
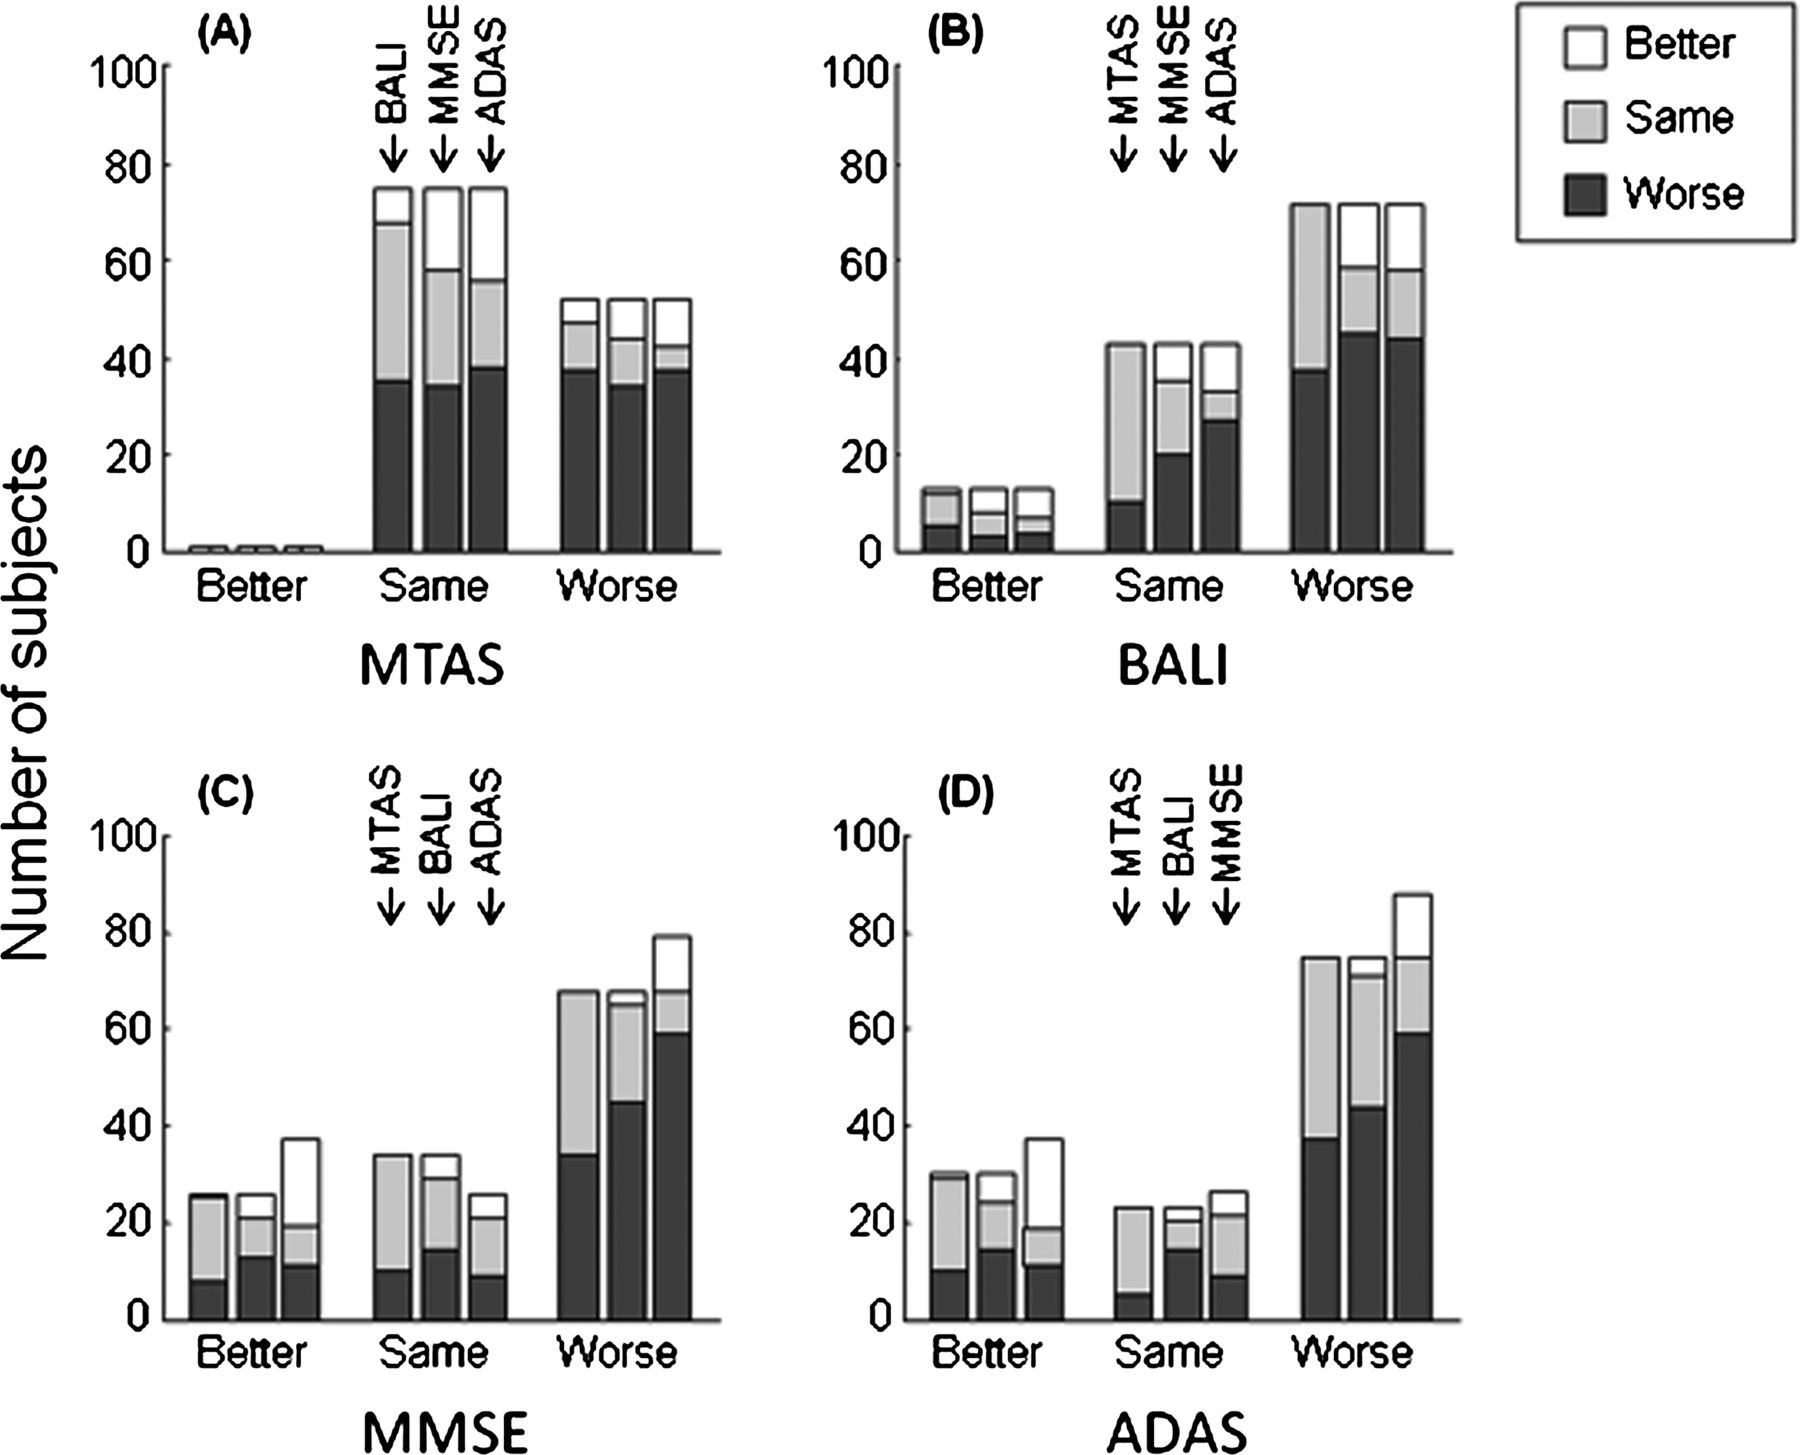
Changes in the measures of brain structure (A, B) and those of cognitive function (C, D) over 24 months in relation to changes in the other measures. ADAS-cog, Alzheimer's Disease Assessment Scale-cognitive subscale; BALI: Brain Atrophy and Lesion Index; MMSE, Mini-Mental Status Examination MTAS, Medial Temporal Lobe Atrophy Scale. A change was termed as a one-point difference in the measurement and was represented using better (improvement), stable and worse.
Despite decline being most common, BALI scores improved in 10% of subjects. BALI improvement was associated with a better chance of improvement in the cognitive test scores (figure 3, see online supplementary appendix 3). Of the 13 people in whom the BALI score showed improvement, six improved on the ADAS-cog, three were stable and four were worse (mean ADAS-cog change with BALI, improvement=0.3-point improvement compared with a mean 2.9-point worsening overall). In contrast, for the 72 people with worse BALI scores, 14 improved on the ADAS-cog, 14 were stable and 44 were worse (mean ADAS-cog change with BALI worsening=3.6 points). The MMSE scores showed a similar pattern. Considering the specific brain structures, most improvement recorded by the BALI involved periventricular lesions (54%); the rest included lesions in the deep white matter and in the infratentorial structures. Of note, none of the patients with MCI with BALI improvement was diagnosed with AD at the 2-year follow-up. Only one person (in the HC group) showed an improvement in the MTAS; this person also had improved BALI, MMSE and ADAS-cog scores. Improvement in the BALI, MMSE and ADAS-cog scores was more often seen in people with MCI who did not progress to AD (see online supplementary appendix 4).
Compared with the apparently irregular changes in the individual raw test scores (figures 1 and 2), state transition analysis demonstrated dynamic changes in both brain structure and cognitive function that were notable for their orderliness (figure 4). Starting from a given non-zero state at baseline (S1–S5), the 24-month outcome states (stabilisation and varying degrees of decline or improvement) were highly correlated with the multistate dynamic model (correlation coefficient r=0.67 for MTAS, r=0.73 for BALI, r=0.74 for MMSE, r=0.73 for ADAS-cog; ps<0.001). When considered independently, age, baseline brain structure state and the vascular risk factor index each contributed to transitions in brain structure (ps<0.001). Baseline brain structure (ps<0.010) and vascular risk factors (ps<0.035) each contributed also to state transitions in cognition, as did the baseline cognitive state and ApoE4 (ps<0.001). In a multivariable analysis, both baseline MTAS state (regression coefficient B=1.07, 95% CI 0.86 to 1.29, p<0.001) and baseline BALI state (B=0.59, 95% CI 0.20 to 0.99, p=0.003) affected MTAS transition, whereas BALI transitions were significantly affected by the baseline BALI state (p<0.001), but not by MTAS (table 3). Adjusted for age, sex and education, the MTAS contributed the most to both the MMSE and ADAS-cog transitions (ps<0.001). Removing the MTAS from this model, the contribution of each of the BALI, vascular risk factor index and ApoE4 to MMSE and ADAS-cog became significant (ps=0.009–0.041).
Factors determining brain structure and cognition state transitions over 24 months in a multivariable generalised linear model

Probabilities of state transitioning of brain structure and cognition over 24 months. Transitions from six baseline states (S0–S5) are presented. The x axis shows the various states at follow-up. Symbols represent the observational data—red circles: the Medial Temporal Lobe Atrophy Scale (MTAS); blue diamonds: Brain Atrophy and Lesion Index (BALI); green inverse-triangles: Mini-Mental Status Examination (MMSE); cyan triangles: Alzheimer's Disease Assessment Scale-cognitive subscale (ADAS-cog). Lines represent the probabilities of transitions from initial state n to any state k according to the Poisson distribution with the Poisson mean = a + b n (where n=0, 1, ...6).12 The fitting was significant at a=1.1 and b=0.9 with the regression coefficient r=0.667 for MTAS, 0.726 for BALI, 0.736 for MMSE and 0.730 for ADAS-cog (p<0.001 in each case).
Discussion
This study demonstrates that brain structural changes over 2 years, as measured using the ADNI 3T MRI protocol,16 ,17 conformed to a general pattern of dynamics that previously had been seen with changes in cognitive function24 and that were replicated here using the ADNI ADAS-cog and MMSE data. On average, a small but clinically detectable decline over 24-months was seen. Despite average decline, substantial proportions improved. The changes in brain structure and in cognitive function were correlated with each other and followed a notably characteristic pattern that could be well described by a multistate dynamic model. The strikingly orderly nature of the dynamic changes is readily illustrated by comparing raw changes scores (figure 1) with the output of the dynamic model (figure 4). Of some clinical importance, no one with MCI whose BALI score improved was diagnosed with dementia at the 24-month follow-up.
Our data must be interpreted with caution. (1) This is not a representative cohort study; participants tended to be healthier and better educated. Further research with larger samples followed up for longer periods is needed to test generalisability. (2) As visual rating scales, the structural measures inherently lack the precise quantification afforded by more detailed evaluations, but are reliable and feasible.25 ,26 The semiquantitative nature also allowed us to define discrete states, facilitating the transition modelling. (3) Given that the BALI rating requires high-field MRI, we used only 3T data. Although this limits generalisability, as high-field MRI becomes standard in both clinical and research settings, this will be a lesser concern and indeed will allow these data to serve as an initial reference standard for future studies. (4) Finally, in using the MMSE and ADAS-cog, this study employed only global cognitive assessments; the dynamics of change in more discrete states is less well understood. Indeed we suspect that the dynamic model requires global measures to investigate how states change with age.
We recognise that this study may not provide the final word on the validity of improvement in brain structure, but the data do allow for the case to be made using a programme of content, construct and criterion validity. Regarding construct validity, we note that the patients with higher baseline BALI and MTAS scores (indicating greater impairment) had MMSE, ADAS-cog and biomarker scores that also showed greater impairment. As expected, the stronger correlations in change scores were between measures within the same domain—that is, BALI–MTAS and MMSE–ADAS-cog correlations were each higher than any structure–cognition correlations. In regression analyses, the changes in structure or in cognition were significantly related to each other and related to changes in cognitive test scores, even when controlling for age, sex and education. Construct validity can also be inferred by the similar magnitude of change in the scale-free Cohen's d (MTAS=0.33, BALI=0.32) and the standardised response mean (MTAS=0.71; BALI=0.69).
Perhaps most persuasive is predictive validity, an aspect of criterion validation, traditionally viewed as the highest indication of a justified belief.27 Among the people with MCI at baseline, no one whose BALI score improved was diagnosed with dementia at the 24-month follow-up. Likewise, the distribution of all change states, as predicted by the baseline states, conformed well to the dynamic model (r>0.66 for each instrument). This study thus joins analyses from several other datasets using different cognitive measures, showing that the dynamic model of age-related changes in brain function holds.13 ,24 Extending the model to brain structural changes is building on an established foundation.
Content validity, although generally held to be the weakest form of validation, for some readers might be key. For them, the idea of improved brain structure might fail on its face, compared with the simple alternative of measurement unreliability. Such a stance would be understandable, especially in light of the skepticism which greeted the proposition that patients with MCI might actually improve during follow-up. More likely than improvement was unreliability of data—enabled, so the argument went, by faulty (‘retrofitted’) criteria from epidemiological studies. Recent studies suggest otherwise, especially a report from the Mayo Clinic Study of Aging, in which one-third of incident cases of MCI had improved at follow-up.3 With such strong evidence that cognitive test score improvement is possible and clinically meaningful, it becomes more plausible that improvement can involve brain structure. Further, note that inter-rater reliability estimates of BALI and MTAS were consistently high at both baseline and at the 2-year follow-up (ICC range 0.89–0.94). It is highly unlikely that instrumental unreliability would be so consistent.
Structural brain improvement has been reported after a range of interventions,28–30 including in older adults with dementia.6 Increased brain volumes and cortical thickness have also been shown (if little remarked upon) in other studies on AD using MRI,31 including ADNI.32 Our study draws attention to the fact that despite a background of average decline, brain structure can improve in some individuals. Such improvement appears to be possible even in mild AD or MCI and even in people of advanced ages.5 ,29–32 Physiologically, this might arise from such mechanisms as the plasticity evident in axonal sprouting, white matter repair and even compensatory neurogenesis, as well as with enhanced cerebral circulation, nutrition and metabolism.33–36 Whatever the mechanisms, improvement first needs to be recognised as real if it is to be studied for the insights it might offer into the fight against age-related cognitive decline.
Improvement in brain structure was seen by virtue of employing the BALI, which was developed to measure global brain structure, in a similar way to development of the ADAS-cog as a global cognitive measure. In short, the improvement here is remarkable to us not just because it conforms to the dynamic model, but because it is visible with this measure and more sensitive to improvement than the MTAS; the latter is a more focal evaluation, albeit a critical one. Note that only one person improved on the MTAS (59% were stable), compared with 13% improvement on the BALI (32% were stable). People who improved on the BALI did so mostly in periventricular and white matter lesions, suggesting that structural change may be more possible in certain areas than in others, as might be changes related to vascular injury/damage. Ongoing research is testing this hypothesis. The arguments for the possibility of real improvement do not exclude instrumental factors, either in neuroimaging or more subjective tests. There always exists the possibility for error in data acquisition, processing, evaluation, rating and analysis, and other areas. It would be exceptional, however, if all this error resulted in apparent improvement.
The data also raise additional questions. As improvement in brain structure and cognition can occur, this suggests that damage can possibly be resisted too. This does not mean that risks for progression can be ignored; these will remain important, including risks seen in association with specific structural changes.37–39 Instead, these data call attention to the need to understand why some people improve whereas others do not. No research arises from dismissing variations simply as unreliable, which is why we call attention to improvement. Further, there are pragmatic consequences for how we analyse risk. Especially, given that dementia occurs chiefly in very old people, it will also be necessary to use models that evaluate more than average change in survivors. Looking only at cognition as ‘worse/not worse’ does not allow us to understand how protection might work. Unless we look for it specifically, we will only know that some level of a risk factor less often resulted in worsening; protection from worsening is not the same as being associated with improvement. Equally, we need techniques, such as index variables, to understand how risk factors work in very old adults, who are likely to have more than one potential risk factor present. For example, an earlier report by our group showed that an index variable comprising factors that were individually not associated with dementia risk was a more powerful predictor for risk than traditional risk factors considered in isolation.40
In summary, this study, using cognitive and MRI data, draws to attention the fact that even when decline dominates, improvement can be seen in both brain function and structure, intrinsic to a dynamic process. This should encourage studies of why some people improve and others are stable, even in the face of dementia.
Acknowledgments
The authors acknowledge Janet Marshall and Sarah Kehoe for proofreading the manuscript, the ADNI database administrators for their proficient help with data retrieval and information verification and the ADNI data and publication committee for prompt approvals of data usage and manuscript submission.
References
Supplementary materials
Supplementary Data
This web only file has been produced by the BMJ Publishing Group from an electronic file supplied by the author(s) and has not been edited for content.
Files in this Data Supplement:
- Data supplement 1 - Online Appendix 1
- Data supplement 2 - Online Appendix 2
- Data supplement 3 - Online Appendix 3
- Data supplement 4 - Online Appendix 4
Footnotes
-
Contributors XS obtained access to the data, conducted data analyses, prepared the results and wrote the first draft of the manuscript. AM designed the mathematical models, helped with mathematical modelling, data analysis’ and result presentation. NZ, WC evaluated and rated the images and helped with data processing and analysis. KR conceptualised the research, reviewed data analysis and result presentation and helped write the first draft of the manuscript. All listed authors contributed to the interpretation of the results and worked on and agreed the final version of the manuscript.
-
Funding This research was supported by operating research grants from the Canadian Institutes of Health Research (MOP-209888) and from the Nova Scotia Health Research Foundation (MED2006–2086).
-
Competing interests XS receives research grants support from the National Research Council Canada, Nova Scotia Health Research Foundation and the Capital District Health Authority Research Foundation and has no conflict of interest with this work. AM receives research grants support from the Canadian Institutes of Health Research and has no conflict of interest with this work. NZ, WC received the National Research Council of Canada – Ministry of Education of China fellowships to conduct research in Canada and have no conflict of interest with this work. KR is supported by the Dalhousie Medical Research Foundation as the Kathryn Allen Weldon Professor of Alzheimer Research. KR has the following financial disclosures: Scientific advisory board: Elan/Wyeth North American Advisory Board on bapeneuzemab. Speaker honorarium: Bristol Myers Squibb sponsored talk at the International Congress on Alzheimer's Disease meeting, Honolulu, Hawaii. Journal advisory board member: Neuroepidemiology (2002), Journal of Gerontology—Medical Sciences (2003–2005), Alzheimer's Research & Therapy (2008), BMC Medicine (2009), Chinese Journal of Geriatrics (2010). Employment: president and chief scientific officer: DementiaGuide Inc. Research Support other than above: Canadian Institutes of Health Research: the Canadian Dementia Knowledge Translation Network Grant; Canadian Institutes of Health Research and the National Natural Science Foundation of China: The Canada China Joint Health Research Initiative; quantification of health status changes in China and in Canada; Alzheimer Society of Canada: Fellowship support award to a PDF in the group; DementiaGuide, Inc legal proceedings: Expert witness for Tory's LLP, on behalf of Eisai and Pfizer Canada.
-
Ethics approval Ethics approval for the secondary data analysis was provided by the ethics board of the Capital District Health Authority, Halifax, Nova Scotia, Canada. Written informed consent was obtained from each subject at each of the ADNI sites at the time of data collection.⇓
-
Provenance and peer review Not commissioned; externally peer reviewed.
-
Data sharing statement Data used in the preparation of this paper were obtained from the Alzheimer's Disease Neuroimaging Initiative (ADNI) database with permission. Data collection and sharing for this project was funded by the Alzheimer's Disease Neuroimaging Initiative (ADNI) (National Institutes of Health grant U01 AG024904). ADNI is funded by the National Institute on Aging, the National Institute of Biomedical Imaging and Bioengineering and through generous contributions from the following: Abbott; Alzheimer's Association; Alzheimer's Drug Discovery Foundation; Amorfix Life Sciences Ltd; AstraZeneca; Bayer HealthCare; BioClinica, Inc; Biogen Idec Inc; Bristol-Myers Squibb Company; Eisai Inc; Elan Pharmaceuticals Inc; Eli Lilly and Company; F Hoffmann-La Roche Ltd and its affiliated company Genentech, Inc; GE Healthcare; Innogenetics, N.V.; Janssen Alzheimer Immunotherapy Research & Development, LLC; Johnson & Johnson Pharmaceutical Research & Development LLC; Medpace, Inc; Merck & Co, Inc; Meso Scale Diagnostics, LLC; Novartis Pharmaceuticals Corporation; Pfizer Inc; Servier; Synarc Inc and Takeda Pharmaceutical Company. The Canadian Institutes of Health Research is providing funds to support ADNI clinical sites in Canada. Private sector contributions are facilitated by the Foundation for the National Institutes of Health (http://www.fnih.org). The grantee organisation is the Northern California Institute for Research and Education and the study is coordinated by the Alzheimer's Disease Cooperative Study at the University of California, San Diego, USA. ADNI data are disseminated by the Laboratory for Neuro Imaging at the Rev August 16 2011 University of California, Los Angeles. The ADNI research was also supported by NIH grants P30 AG010129, K01 AG030514 and the Dana Foundation. A complete list of ADNI investigators can be found at http://adni.loni.ucla.edu/wp-content/uploads/how_to_apply/ADNI_Acknowledgement_List.pdf. The ADNI investigators contributed to the design and implementation of ADNI and data sharing, but did not participate in analysis or writing of this report. For up-to-date information about ADNI and data sharing, visit http://www.adni-info.org.