Article Text

Abstract
OBJECTIVES To test the hypothesis that irrecoverable neurological deficit in multiple sclerosis is associated with axonal loss.
METHODS 1H magnetic resonance spectroscopy (MRS) was carried out in a group of patients with clinically definite multiple sclerosis (n=31).
Using this technique, the apparent concentration of NA ([NA] the sum of N-acetyl aspartate (NAA), a neuronal marker, and N-acetylaspartylglutamate has been compared in four groups of patients with multiple sclerosis classified as relapsing-remitting, secondary progressive, primary progressive, benign, and a control group.
RESULTS In the patients with relapsing-remitting disease (n=9) there was a highly significant reduction of apparent NA (median 8.73 mM, range 6.86 mM-10.74 mM, P=0.0008) from an area of high signal compared with the control group (median 11.97 mM, range 10.55 mM-14.5 mM). In the patients with secondary progressive disease (n=10), there was again a highly significant reduction of apparent NA (median 7.82 mM, range 3.5 mM-10.3 mM, P=0.0003) from an area of high signal compared with the control group. In the patients with primary progressive disease (n=6) there was once again a highly significant reduction of apparent NA (median 8.83 mM, range 6.95 mM-9.89 mM, P<0.002) from an area of high signal compared with the control group. In the patients with benign disease, however, there was no significant difference in the apparent NA (median 10.5 mM, range 8.53 mM-12.8 mM, P>0.05) from an area of high signal compared with the control group. In the patients with benign disease (n=5) there was also no significant difference in the apparent NA (median 10.74 mM, range 8.58 mM-13.4 mM, P>0.3) from an area of normal appearing white matter compared with the control group. In the patients with primary progressive disease, however, there was a significant reduction of apparent NA from an area of normal appearing white matter (median 8.78 mM, range 8.7 mM-12.38 mM, P< 0.025) compared with the control group. There was a significant inverse correlation between [NA] from lesions in the patients with multiple sclerosis and disability as measured on the Kurtzke expanded disability scale score (r= -0.364, 0.05>P> 0.02).
CONCLUSION These findings support the hypothesis that axonal loss is important in the development of disability in multiple sclerosis. They also provide evidence for axonal loss in normal appearing white matter in patients with primary progressive disease.
- multiple sclerosis
- N-acetyl aspartate
- disability
Statistics from Altmetric.com
It is well recognised that the clinical course of multiple sclerosis may follow various patterns. Most patients have a relapsing, remitting course at onset1 although after a variable interval many will develop progressive disability on a background of superadded relapses.2 In about 30% of patients however, the disease adopts a benign course in which minimal disability is seen after 10 years from symptom onset.3 In 10 to 15% of patients with multiple sclerosis the disease process is progressive from onset (one year progressive disease). These patients tend to be male, are older at the onset of symptoms, and often present with a spastic paraparesis.2 Magnetic resonance imaging studies in these patient groups2 4 have shown important differences in the distribution, size, and frequency of lesion development together with differing degrees of blood-brain barrier breakdown as evidenced by the presence of enhancement after the administration of gadolinium-DTPA. However, to date there has been poor correlation between the degree of disability in the various patient subgroups and lesion load measured from conventional MRI.5 6
Although conventional MRI is sensitive in detecting the lesions of multiple sclerosis, it disclosed neither demyelination nor axon loss itself. Proton magnetic resonance spectroscopy (MRS) is a nuclear magnetic resonance technique which has the potential to detect axon loss non-invasively during life. The normal proton spectrum is dominated by N-acetyl derived groups (NA; the sum of N-acetyl aspartate (NAA) and N-acetylaspartylglutamate).7 The predominant component of the NA peak is NAA, an amino acid of unknown function which has been shown in experimental studies on neonatal rats to be contained almost exclusively within neurons.8 A loss of neurons (cell bodies and axons) would be predicted to cause a persistent reduction in the concentration of NAA. That this is so has been shown in diseases characterised by neuronal loss.9-12 To test the hypothesis that irrecoverable neurological deficit in multiple sclerosis is associated with axon loss, the apparent concentration of NA has been compared in four groups of patients classified as relapsing-remitting, secondary progressive, primary progressive, and benign.
Materials and methods
PATIENTS
Patients with clinically definite multiple sclerosis13 were recruited from the National Hospital for Neurology and Neurosurgery. The study was approved by the joint ethics committee at the Institute of Neurology and the National Hospital for Neurology and Neurosurgery, London. Informed consent was obtained from all patients before each study.
The patient groups were defined as follows:
(1) Relapsing-remitting disease (n=9): these patients had a history of relapses and remission without gradual deterioration, excluding benign cases. They had a median age of 31(range 26-49 years) and a median disease duration of three (range 1-12 years). The median Kurtzke expanded disability status score (EDSS) was 3.5 (range 2.0-5.5)
(2) Benign disease (n=9): these patients had relapsing-remitting disease of at least 10 years of duration of disease with a disability on the Kurtzke EDSS ⩽3.0. They had a median age of 45 (range 39-63) years and a median disease duration of 20 (range 10-35) years. The median Kurtzke EDSS score was 2.5 (range 1.0-3.0)
(3) Secondary progressive disease (n=10): these were patients presenting with a relapsing-remitting course with evidence of progressive deterioration for at least six months with or without superimposed relapses. They had a median age of 46 (range 21-55) years and a median disease duration of 13.5 (range 5-25) years. The median Kurtzke EDSS was 7.0 (range 4.0-8.0).
(4) Primary progressive disease (n=8): these patients had progressive deterioration from symptom onset without any relapses or remissions. They had a median age of 42 (range 37-47) and a median disease duration of 4.5 (range 1.5-19) years. The median Kurtzke EDSS was 6.0 (range 5.0-7.5)
Nine healthy controls were also studied (median age 40 (range 18-57) years). The controls were recruited from members of staff at the National Hospital for Neurology.
MAGNETIC RESONANCE IMAGING AND SPECTROSCOPY
Brain MRI and MRS were performed with a 1.5 T GE Signa whole body scanner using a standard quadrature head coil. The study commenced with a T2 weighted fast spin echo imaging sequence (TR 3000 ms, TEf 80 ms) (5 mm slices with 2.5 mm gap, 256×256 matrix, echo train length 8 ). After imaging, a volume of interest ranging between 3.5 ml and 6 ml was prescribed which in the patient group incorporated a chronic high signal lesion or an area of normal appearing white matter.
Lesions were determined to be chronic if they were unchanged on imaging over a period of six months or greater. Large lesions were chosen to minimise partial volume effects. If a sufficiently large enough lesion could not be identified on imaging then spectra were collected from normal appearing white matter alone. In several of the patients it was not possible to collect spectra from an area of high signal and normal appearing white matter because of time constraints and patient compliance. An MR image of the voxel was then obtained to ensure accurate localisation. Water suppressed 1H spectra were obtained using a STEAM sequence.14 15 Acquisition indices were TR 2000 ms, TM 12 ms, and TE 135 ms; 256 averages were collected using an eight step phase cycle in about nine minutes; 1024 points were collected, with a spectral width of 750 Hz. Shimming to a line width of about 1.5 Hz. and water suppression were reoptimised for each new location. In the control group, spectra were collected from an area of periventricular white matter similar in volume and site to the lesions studied in the multiple sclerosis groups.
Data processing included 1.5 Hz line broadening for filtering, Fourier transformation, and zero order phase correction. No baseline correction was applied. Peak areas were determined using a line fitting programme (“SA / GE”, GE Milwaukee WI, USA). Peaks were fitted to a gaussian line shape using a Marquardt fitting procedure. Absolute concentrations for the metabolites were calculated using the fully relaxed water signal as an internal standard of reference.16 Metabolite concentrations [met] were calculated from the equation [Met] = [H2O] × 2/PI × T1corr× T2corr × S0 MET / S0 H2O × 1/2[R]
where S0 MET and S0 H2O denote the signal intensities for metabolites and water respectively, [H2O] is the brain water concentration from the volume of interest. The water concentration from the voxel of interest was calculated by comparing the signal intensity from the proton density images in the putamen with the region of interest in the hemispheric white matter. The putamen was chosen as this region of the basal ganglia is not affected by deposition of heavy metal in healthy controls.17 Furthermore, a recent study by Grimaudet al 18 has shown no evidence of hypointensity on T2 weighted images to suggest increased deposition of heavy metals in the putamen of patients with multiple sclerosis.
The water concentration of normal appearing grey matter has been taken as 45.5 M.19 In the control groups the concentration of water in white matter has been taken as 39.75 M.19T1corr and T2corr are T1and T2 correction values based on published T1 and T2 times from parietal white matter for the metabolites studied.20 As absolute T1 and T2 values were not calculated for patients and controls, the term apparent concentration is used. 2/PI denotes the proton index and refers to the number of protons in each metabolite (three for NAA, three for creatine, nine for choline) The value of 2 represents the two protons in H2O. R = R metabolite-R waterand accounts for different receiver attenuator settings.
Statistical analysis was performed with a Mann-Whitney confidence interval and test. Results are expressed as a median value together with the range and P value. A Spearman’s rank correlation test was also used and results are expressed as an r value together with levels of significance.
Results
MRS LESIONS
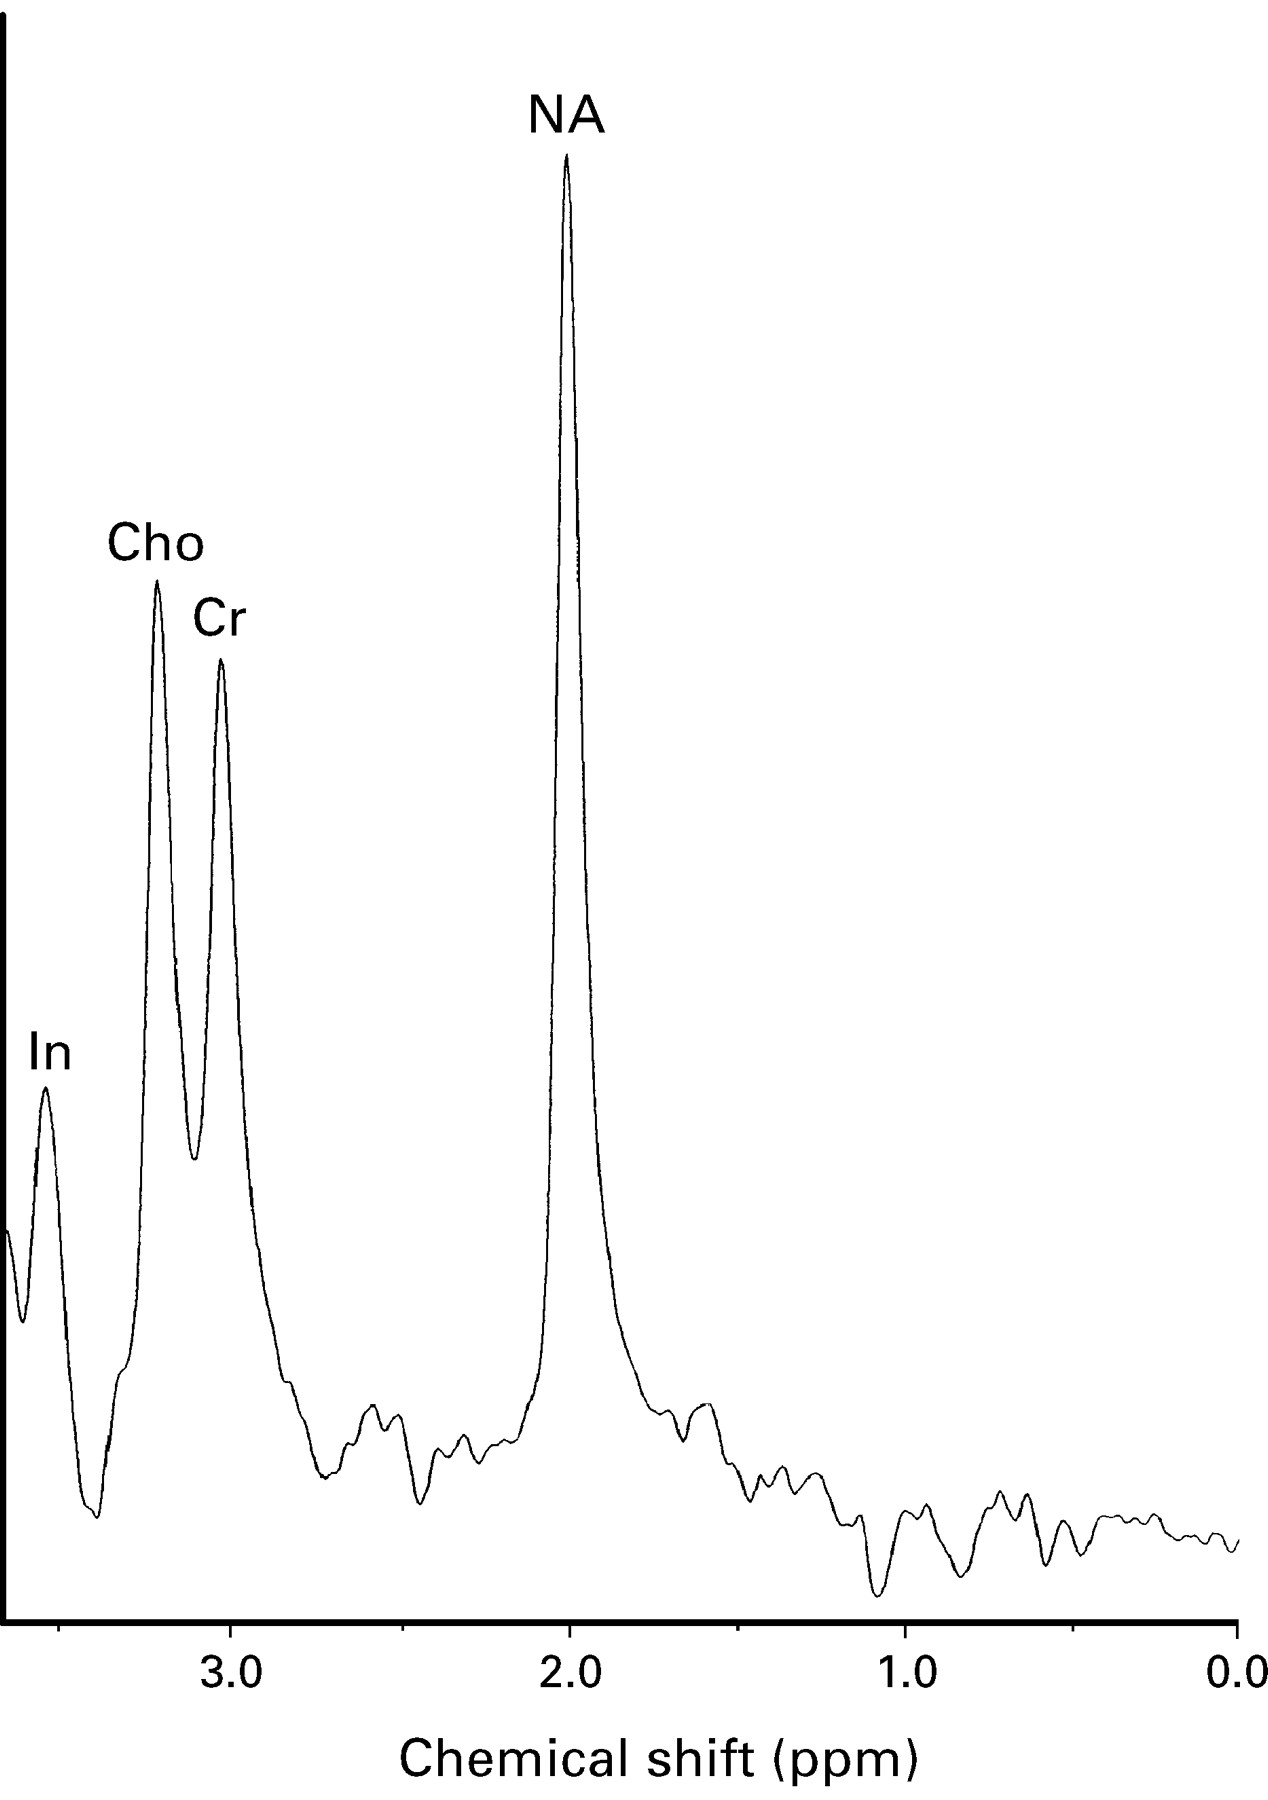
Figure 1 shows a spectrum from a healthy control. Metabolic assignments are based on published data.21

1H MRS (TE 135 ms TR 2000 ms, volume 4 ml) from periventricular parietal white matter in a healthy 40 year old control).
All patients in the relapsing-remitting and secondary progressive groups had lesions large enough to be studied with single voxel spectroscopy. In the benign group six patients had lesions large enough to study with MRS. Similarly, in the primary progressive group, six patients had at least one lesion of sufficient size to study with spectroscopy.
Relapsing-remitting patients
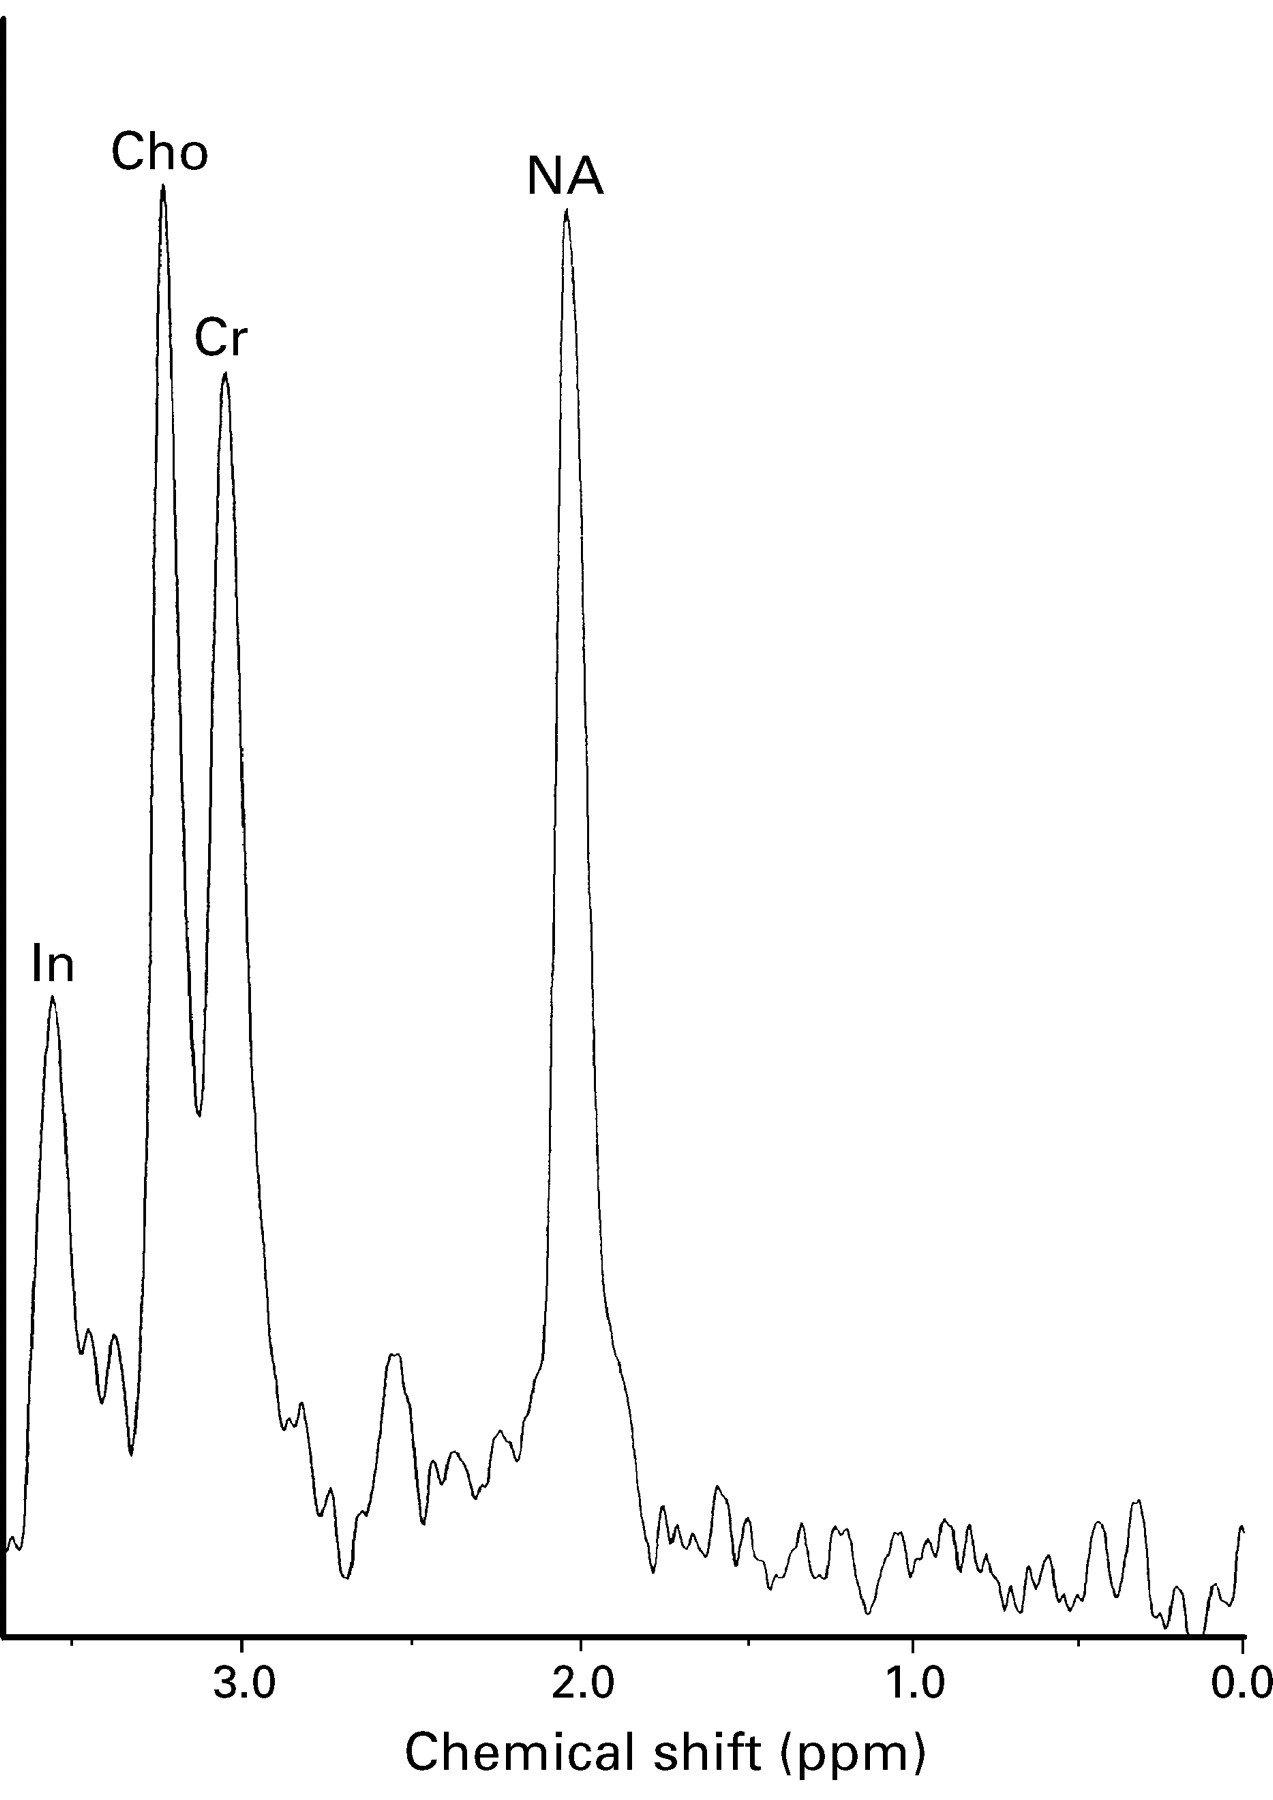
In the patients with multiple sclerosis with relapsing remitting disease (n=9) there was a highly significant reduction of apparent NA (median 8.73 mM, range 6.86 mM-10.74 mM, P=0.0008) from an area of high signal compared with the control group (median 11.97 mM, range 10.55-14.5 mM). The apparent creatine concentration in the same group from an area of high signal was reduced (median 8.3 mM, range 7.0 mM-12.1 mM, P=0.29) compared with controls (median 9.05 mM, range 8.1 mM-11.7 mM) although this did not reach significance. There was no significant difference in the apparent choline concentration between the relapsing-remitting lesion group (median 1.73 mM, range 1.27 mM-2.5 mM, P=1) and controls (median 1.66 mM, range 1.29 mM-1.9 mM) (fig2).

1H MRS (TE 135 ms TR 2000 ms, volume 5ml) from a chronic parietal white matter lesion in a patient with relapsing-remitting multiple sclerosis (patient 12) showing reduction of [NA].
Secondary progressive patients
In the patients with secondary progressive disease (n=10),there was again a highly significant reduction of apparent NA (median 7.82 mM, range 3.5 mM-10.3 mM, P=0.0003) from an area of high signal compared with the control group. The apparent creatine concentration in the same group from an area of high signal was reduced (median 7.89 mM, range 4.83 mM-10.3 mM, P=0.1) though again this did not reach significance. There was no significant difference in the apparent choline concentration between the secondary progressive lesion group (median 1.78 mM, range 1.36 mM-2.18 mM, P=0.48) and controls (fig 3).

1H MRS (TE 135 ms TR 2000 ms, volume 4.1 ml) from a chronic parietal white matter lesion in a patient with secondary progressive multiple sclerosis (patient 19) showing reduction of [NA].
Primary progressive patients
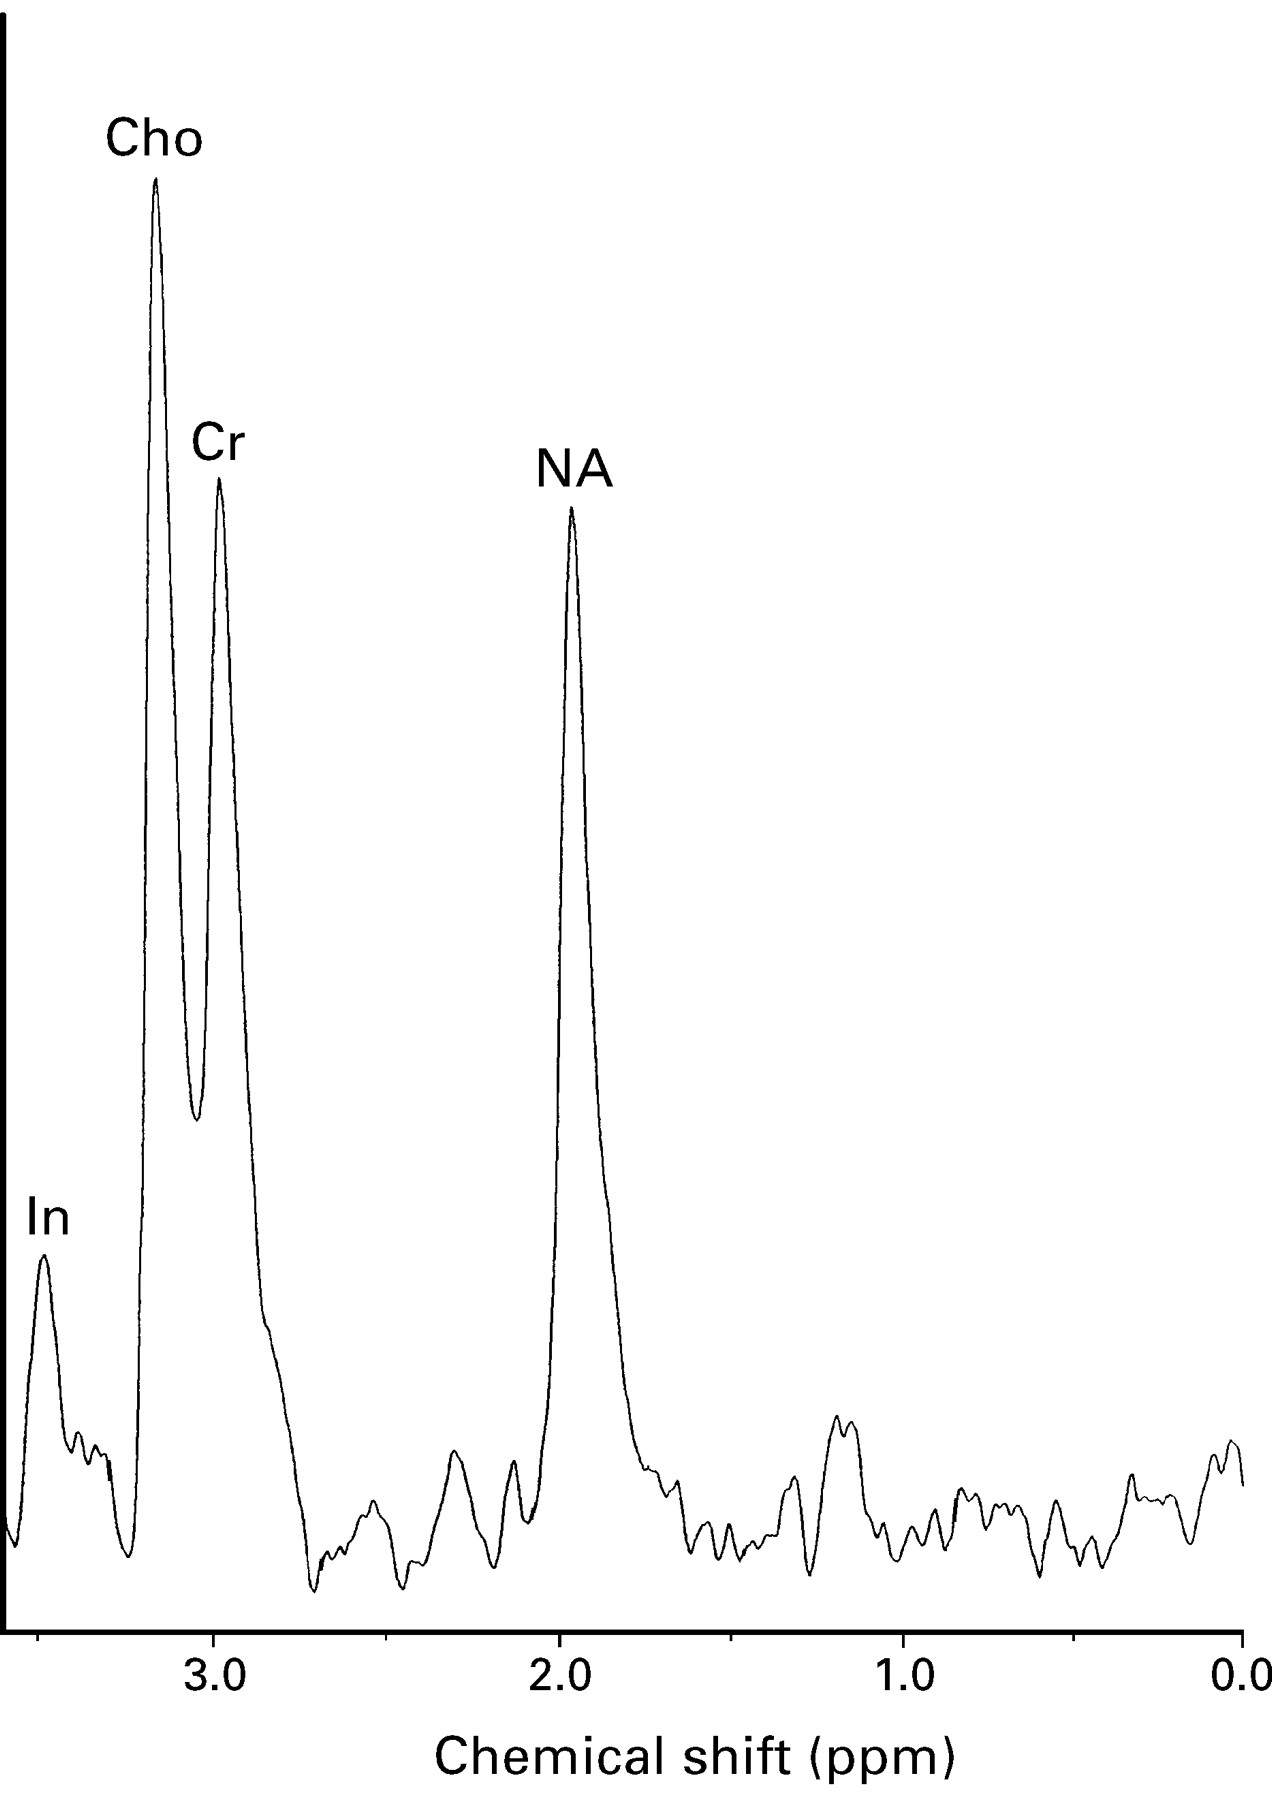
In the patients with multiple sclerosis with primary progressive disease (n=6) there was once again a highly significant reduction of apparent NA (median 8.83 mM, range 6.95 mM-9.89 mM, p<0.002) from an area of high signal compared with the control group. The apparent creatine concentration in the same group from an area of high signal was reduced (median 7.39 mM, range 6.47 mM-12.4 mM, P>0.08) although again this did not reach significance. There was no significant difference in the apparent choline concentration between the primary progressive lesion group (median 2.0 mM, range 1.3 mM-2.28 mM, P>0.20) and controls (fig 4).

1H MRS (TE 135 ms TR 2000 ms, volume 5.3 ml) from a chronic parietal white matter lesion in a patient with primary progressive multiple sclerosis (patient 30) showing reduction of [NA].
Benign patients
In the patients with benign disease there was no significant difference in the apparent NA (median 10.5 mM, range 8.53 mM-12.8 mM, P>0.05) from an area of high signal compared with the control group. The apparent creatine concentration in the same group from an area of high signal was reduced (median 7.7 mM, range 5.96 mM-11 mM, P>0.4) although this did not reach significance. There was no significant difference in the apparent choline concentration between the benign lesion group (median 1.75 mM, range 1.08 mM-2.25 mM, P>0.34) and controls (fig 5).

1H MRS (TE 135 ms TR 2000 ms, volume 4.4 ml) from a chronic parietal white matter lesion in a patient with benign multiple sclerosis (patient 6) showing a relative preservation of [NA].
MRS NORMAL APPEARING WHITE MATTER
Primary progressive patients
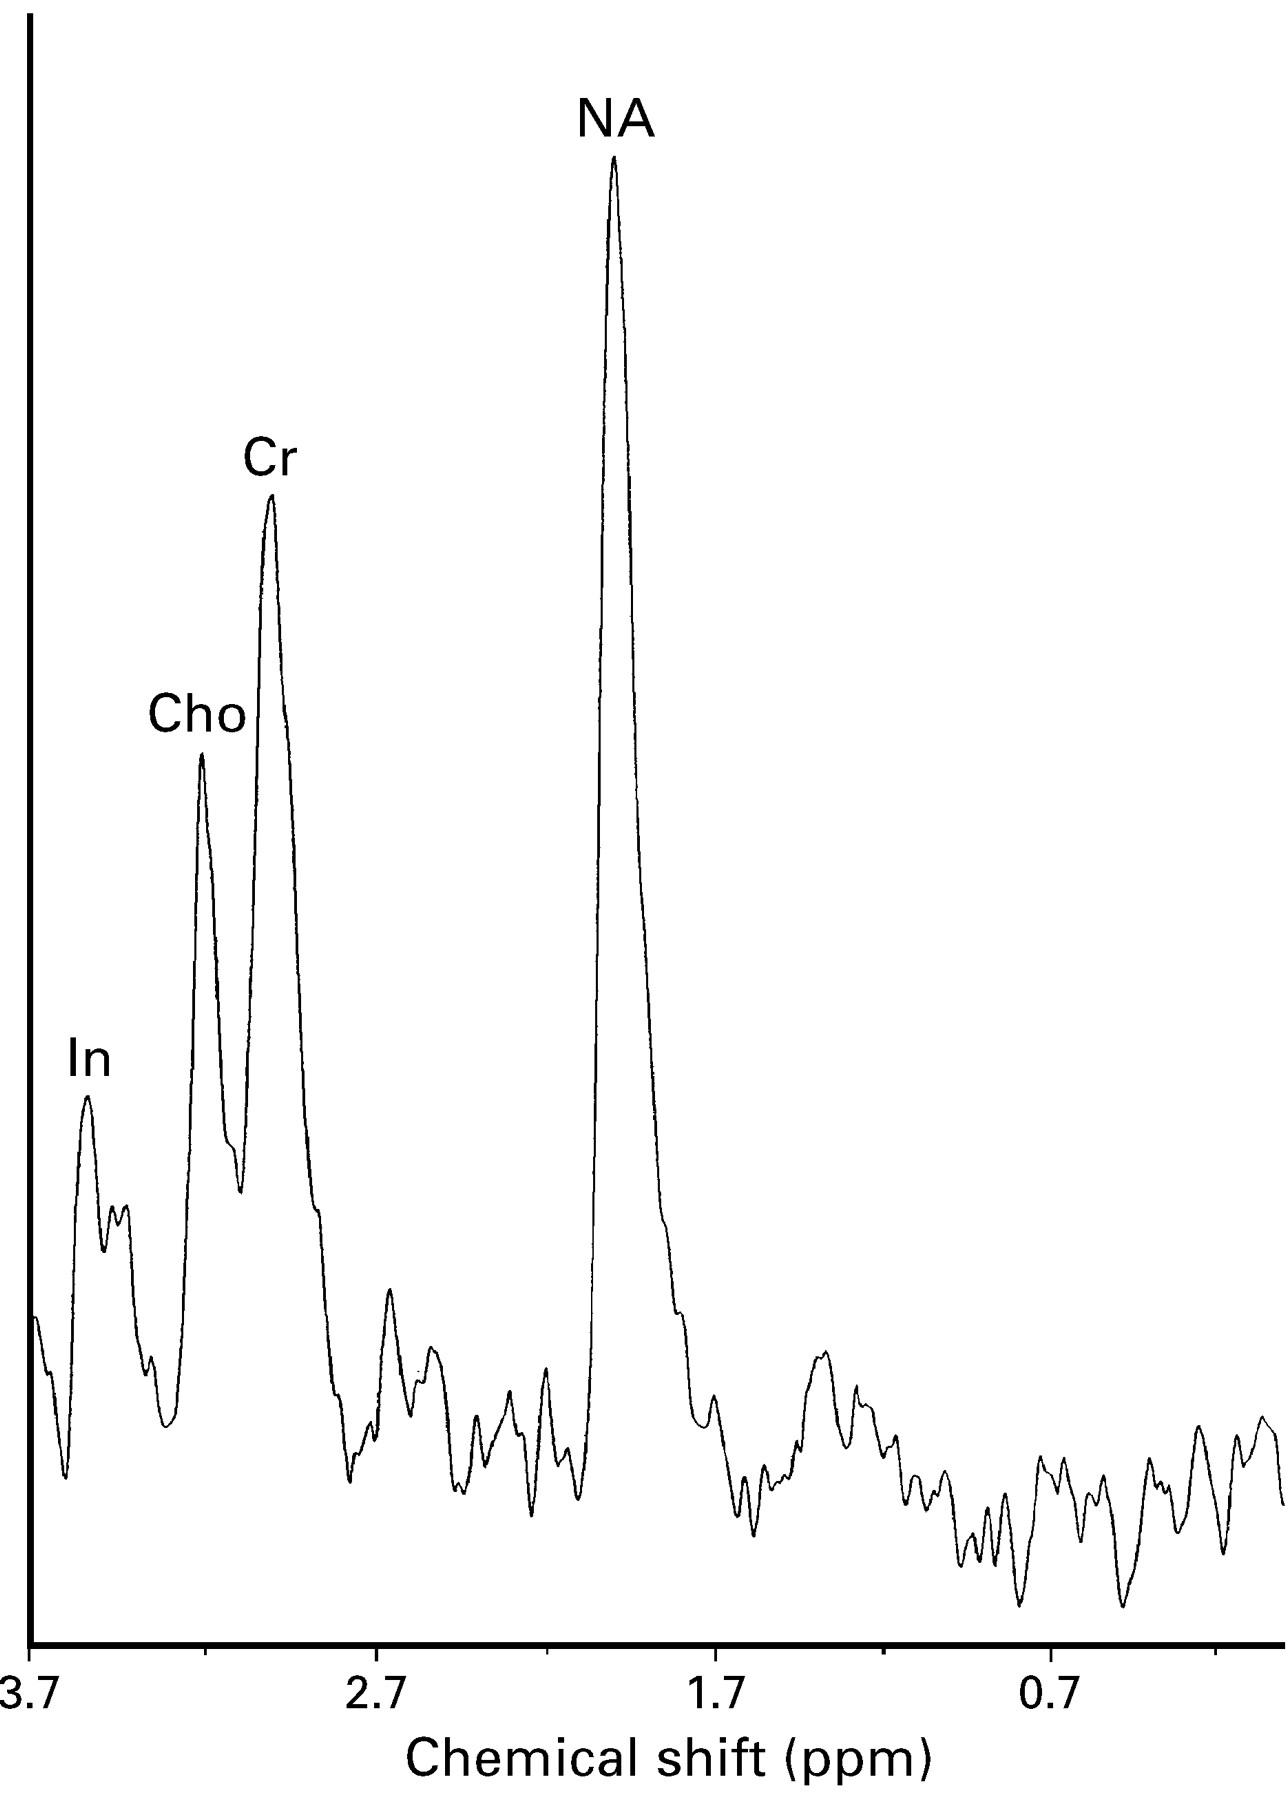
In the patients with primary progressive multiple sclerosis there was a significant reduction of apparent NA from an area of normal appearing white matter (median 8.78 mM, range 8.7 mM-12.38 mM, P< 0.025) compared with the control group (fig 6). The apparent creatine concentration in the primary progressive group from an area of normal appearing white matter (median 8.9 mM, range 6.46 mM-9.49 mM, P>0.5)did not differ from the control group. There was no significant difference in the apparent choline concentration from normal appearing white matter in the primary progressive lesion group (median 1.44 mM, range 0.96 mM-2.53 mM, P>0.14) and controls.

1H MRS (TE 135 ms TR 2000 ms, volume 4.8 ml) from an area of normal appearing white matter in a patient with primary progressive multiple sclerosis (patient 30) showing reduction of [NA].
Benign patients
In the patients with multiple sclerosis with benign disease (n=5), there was no significant difference in the apparent NA (median 10.74 mM, range 8.58 mM-13.4 mM, P>0.3) from an area of normal appearing white matter compared with the control group. The apparent creatine concentration in the benign group from an area of normal appearing white matter (median 9.15 mM, range 8.68 mM-9.76 mM, P>0.9) did not differ from the control group. There was no significant difference in the apparent choline concentration between the benign lesion group (median 1.82 mM, range 1.72 mM-2.28 mM, P>0.12) and controls.
It was not possible to collect spectroscopic data from normal appearing white matter in the patients with relapsing-remitting and secondary progressive disease.
There was a small significant inverse correlation between [NA] from lesions in all patients with multiple sclerosis taken collectively and disability as measured on the Kurtzke EDSS (r= -0.364, 0.05>P>0.02)
Discussion
There are three major findings in this study. The first is the relative preservation of [NA] from lesions in the patients with benign multiple sclerosis compared with [NA] from lesions in the primary progressive, secondary progressive, relapsing-remitting patients, and normal appearing white matter from the control group. The second finding of note is a small but nevertheless significant correlation between the reduction of [NA] from a multiple sclerosis lesion and the degree of disability measured on the Kurtzke EDSS. Finally, this study has shown a reduction of [NA] from normal appearing white matter in the primary progressive group of patients with multiple sclerosis compared with the preservation of [NA] from normal appearing white matter in the benign group of patients with multiple sclerosis and healthy controls.
[NA] IN MULTIPLE SCLEROSIS LESIONS
Lesions from the patient groups with progressive and relapsing-remitting multiple sclerosis showed a significant reduction in the median [NA]. The demonstration of a reduced [NA] in these patient groups is in keeping with previous studies on multiple sclerosis lesions, in which a reduction in the NAA/creatine ratio22-24 or an absolute reduction of [NA] has been found.16 25
However, an original finding in the present study is the relative preservation of [NA] from lesions in patients with multiple sclerosis with benign disease. The incidence of benign multiple sclerosis varies in different series from between 15% and 40%.3 26 27The pathophysiological mechanisms that lead to a benign course are not fully understood. Studies with MRI in the brain6 or spinal cord28 have shown little or no relation between disability and lesion load.
Given that the principal component of NA is N acetyl aspartate, an amino acid almost exclusively localised within neurons and their processes,8 the relative preservation of [NA] from lesions in the benign group may reflect a relative preservation of axons in these lesions. It may be that the less pronounced initiating inflammatory event in benign multiple sclerosis produces less axonal disruption and a preserved capacity for axonal repair.
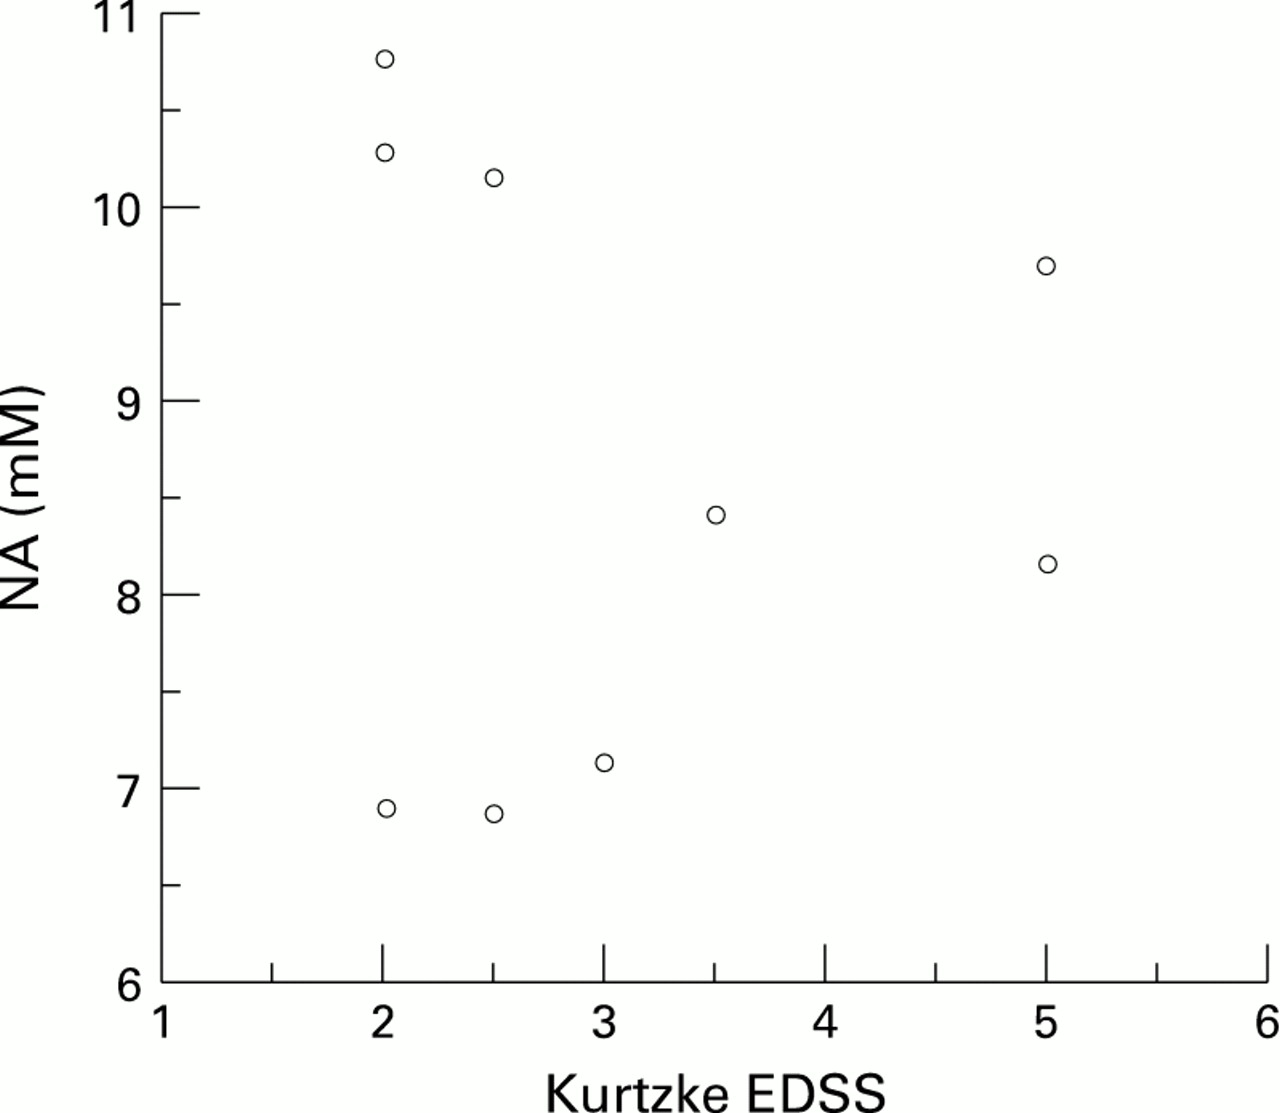
The patients in the primary progressive and secondary progressive groups had a significantly higher median Kurtzke EDSS than the patients in the benign group. It is perhaps suprising that the relapsing-remitting group showed such a large reduction in the median [NA] given that several of the patients in this group had minimal disability. There is, however, a tendency for the patients with minimal disability in this group to have the highest [NA] (fig 7). It is probable that some of the patients in this group will have a benign form of the disease over time and thus would be expected to have a preservation of NA in lesions. An obvious explanation for this finding is that the patients in the relapsing-remitting group who had higher [NA] tended towards a shorter duration of disease (table).
Duration of disease, Kurtzke EDSS, and [NA] in the multiple sclerosis lesion subgroups

[NA] from lesions v Kurtzke EDSS in patients with relapsing-remitting disease.
CORRELATION BETWEEN THE REDUCTION OF [NA] FROM A MULTIPLE SCLEROSIS LESION AND THE DEGREE OF DISABILITY MEASURED ON THE KURTZKE EDSS
This study has also shown a weak correlation between the reduction of [NA] from multiple sclerosis lesions and increased disability as measured on the Kurtzke EDSS (fig 8). That only a modest correlation was found is not suprising. Previous investigators have failed to show a correlation between a reduction in NAA and disability,29probably because, as in the present study, lesions and normal appearing white matter in the periventricular areas were examined which are not clinically eloquent30 except in relation to cognitive function.31 32 A study described previously by our group concentrated on an area of the brain that was clinically eloquent and showed a stronger correlation between a reduction of NAA and the Kurtzke EDSS.25 Furthermore, a spectroscopic study of acute symptomatic lesions showed a strong negative correlation between reduction of NAA and disability.33

Kurtzke EDSS v [NA] in patients in all subgroups of multiple sclerosis.
REDUCTION OF [NA] FROM NORMAL APPEARING WHITE MATTER IN THE PATIENTS WITH PRIMARY PROGRESSIVE MULTIPLE SCLEROSIS
The other finding of note in this study was the significant reduction of [NA] in normal appearing white matter in patients with primary progressive multiple sclerosis (fig 6) compared with normal appearing white matter from patients with benign multiple sclerosis and white matter from healthy controls. Other studies have noted a qualitative reduction in the NAA:creatine ratio from normal appearing white matter in patients with multiple sclerosis.24 34Such a reduction is likely to reflect microscopical abnormalities, which have been documented in pathological studies.35 A diffuse pathological process in primary progressive multiple sclerosis may explain the tendency towards increased disability in these patients despite the relative lack of visible lesions on MRI.2
OTHER FINDINGS
In the present study there was a tendency for the creatine concentration to be reduced in lesions from all multiple sclerosis groups although this was not significant. This is in keeping with a recent postmortem study by Davies et al 36which showed an absolute reduction of both NA and creatine from multiple sclerosis lesions studied 48 hours after death whereas areas of normal appearing white matter studied showed normal metabolite concentrations. There was no significant difference between the creatine concentration from normal appearing white matter in the benign and primary progressive patients compared with controls.
IMPLICATIONS FOR FUTURE STUDIES
The present study has shown a reduction in [NA] from lesions in those subgroups of patients with a greater degree of clinical disability. By contrast, patients with benign multiple sclerosis showed a preservation of NA from lesions and normal appearing white matter indicating a less destructive pathological process in this patient group. Patients with primary progressive multiple sclerosis showed, in addition to a low [NA] from lesions, a reduction of [NA] from normal appearing white matter, perhaps indicating a more diffuse pathological process in this subgroup.
Some of the patients in the relapsing-remitting group who had minimal disability showed a preservation of [NA]. These patients tended to have a shorter duration of disease. It therefore cannot be concluded that spectroscopy of lesions is predictive of clinical outcome in patients with relapsing-remitting multiple sclerosis. The findings from the present study, however, are of enough interest to pursue this issue further. With the advent of β-interferon, an agent that reduces the frequency of evidence of new disease activity in early relapsing-remitting multiple sclerosis37 38 it has become more necessary to find a reliable means of predicting clinical outcome at an early stage of the disease. A future longitudinal spectroscopic trial of patients with relapsing-remitting disease with minimal clinical disability and a wide range of duration of disease should provide the answer to whether spectroscopy could be a useful tool for this purpose.
Acknowledgments
This work has been generously supported by a grant from the Multiple Sclerosis Society of Great Britain and Northern Ireland. Software for spectroscopic analysis was provided by General Electric (GE Milwaukee, WI, USA).