Article Text

Abstract
OBJECTIVES Multiple sclerosis lesions appear as areas of high signal on T2 weighted MRI. A proportion of these lesions, when viewed on T1 weighted MRI, appear hypointense compared with surrounding white matter. These hypointense T1 lesions are thought to represent areas of greater tissue damage compared with the more non-specific, total T2 lesion load. This study aimed to better characterise the properties of high signal T2 lesions with differing appearances on T1 weighted MRI using quantitative MR techniques.
METHODS Eleven patients with secondary progressive multiple sclerosis were studied. Two high signal T2 lesions were selected from each patient—one of which appeared hypointense and one isointense on a T1 weighted image. A voxel was positioned around each lesion and for this volume of brain the metabolite concentrations were estimated using proton MR spectroscopy (1H-MRS) and the T1 relaxation time within each voxel calculated from a T1 map generated using a multislice technique.
RESULTS Compared with isointense T1 lesions, hypointense T1 lesions exhibited a significantly lower absolute concentration of N-acetyl derived metabolites (tNAA) and a significantly higher absolute concentration of myo-inositol (Ins). T1 relaxation time correlated significantly with both tNAA (r=−0.8, p < 0.001) and Ins (r=0.5, p=0.012). There was no correlation between T1 relaxation times and creatine/phosphocreatine or choline containing compounds.
CONCLUSIONS Prolonged T1 relaxation times seem to reflect the severity of axonal damage or dysfunction (inferred by a low tNAA) and possibly also gliosis (inferred by a high Ins) in chronic multiple sclerosis lesions.
- multiple sclerosis
- spectroscopy
- T1
- relaxation time
Statistics from Altmetric.com
Magnetic resonance imaging has become established as the most sensitive paraclinical test for the detection of dissemination in multiple sclerosis and is being widely utilised in phase III drug trials as a secondary outcome measure.1-5 High signal areas on T2 weighted imaging (T2 lesions) do not, however, distinguish between inflammation, oedema, demyelination, gliosis, and axonal loss. Some of these pathological processes are likely to be irreversible contributing to the overall disability of a patient whereas others are less likely to do so. This may help explain the weak correlation between T2 lesion load and clinical disability.6 7
A proportion of high signal T2 lesions appear hypointense, compared with surrounding white matter, when viewed on moderately T1 weighted images (hypointense T1 lesions). Some of these hypointense T1 lesions may represent acute lesions that enhance after the administration of a contrast agent. Most, however, will reflect chronic lesions and remain as low signal areas on enhanced T1 weighted images. Several, but not all, MRI studies of these chronic multiple sclerosis lesions have suggested that they represent areas of severe focal tissue damage with T1 lesion load correlating more strongly with disability compared with total T2 lesion load.8-12
Histopathological studies from both biopsy13 and postmortem14 15 brain tissue provide further evidence that hypointense T1 lesions are indeed associated with more severe tissue damage including axonal loss, and also with increased extracellular fluid. The severity of the tissue damage seems to be reflected by the degree of the hypointensity, determined semiquantitatively,14-17 and with the T1 relaxation time.17
Proton MR spectroscopy (1H-MRS) is a non-invasive technique which enables in vivo quantification of metabolite concentrations in brain tissue. The principal peak in a normal spectrum is produced byN-acetyl derived metabolite groups (tNAA), consisting mainly of N-acetyl aspartate (NAA) but also including a small amount ofN-acetyl aspartylglutamate (NAAG). These metabolites are almost exclusively restricted to neurons18 19 in adults and therefore their concentration is thought to reflect axonal density and/or function. A smaller peak is produced by myo-inositol (Ins), the concentration of which has been reported to be increased in multiple sclerosis lesions.20-22 Ins has been identified as a glia-specific marker for in vivo MR studies.23 It is highly concentrated in astrocytes where it acts as an osmolyte24 25 and the increased concentration found in multiple sclerosis lesions may therefore be a reflection of gliosis. Other peaks seen in a normal spectrum are those attributed to creatine/phosphocreatine (Cre) and choline-containing compounds (Cho).
The aims of this study were: (1) using tNAA as a surrogate marker for axonal density, to see if it is reduced in chronic hypointense T1 lesions; (2) using Ins as a surrogate marker for gliosis to see if it is increased in hypointense T1 lesions; (3) to study the relation of quantitative T1 relaxation time with T1 hypointensity—to understand the importance and specificity of T1 relaxation effect on the images; (4) to study the relation between quantitative T1 relaxation time and tNAA and Ins to see if it might be an alternative measure of axonal density and gliosis.
Methods
PATIENTS
Eleven patients with secondary progressive multiple sclerosis were studied. The median age was 40 years (range 30–44 years) and the median score on the expanded disability status scale (EDSS)26 was 6.5 (range 5–7.5). Six were men and five were women. They had had multiple sclerosis for a median of 10 years (range 6–18 years) and had been in the secondary progressive stage of the illness for a median of 6 years (range 3–8 years). All the patients were participating in an open labelled study into the safety of 8 mIU interferon β-1b administered subcutaneously in secondary progressive multiple sclerosis. The study was performed during a routine 9 month follow up visit. Before this, the patients had been involved in a 3 year double blind placebo controlled trial of the effectiveness of interferon β-1b in the treatment of secondary progressive multiple sclerosis.4
Comparisons of median (range) T1 relaxation times and absolute metabolite concentrations between isointense and hypointense lesions
MR IMAGING PROTOCOL
Magnetic resonance imaging was performed on a 1.5 Tesla General Electric (GE) Signa Horizon EchoSpeed scanner. Dual echo fast spin echo (FSE) and T1 weighted axial localising images, with a 5 mm slice thickness and a 1.5 mm interslice gap, were acquired (FSE: TR 3000 ms, effective TE 14/84 ms; T1: TR 540 ms, TE 20 ms). By comparing the FSE and T1 weighted images, two voxels were chosen from each subject around lesions identified as areas of high signal on the T2 weighted image. Lesions were selected to include one judged to be isointense compared with surrounding white matter, and one judged to be hypointense compared with surrounding white matter on the T1 weighted image from each patient (figs 1 and 2). The study was restricted to include only lesions in the parietal white matter at the level of the lateral ventricles of the brain to minimise the effect of regional differences in metabolite concentrations on the results.27 Care was taken to exclude CSF and grey matter from the voxel. The volume of the voxel was adjusted so that about 50% or more contained lesion. The median voxel size was 1.5 cm3 (range 1–2.5 cm3).
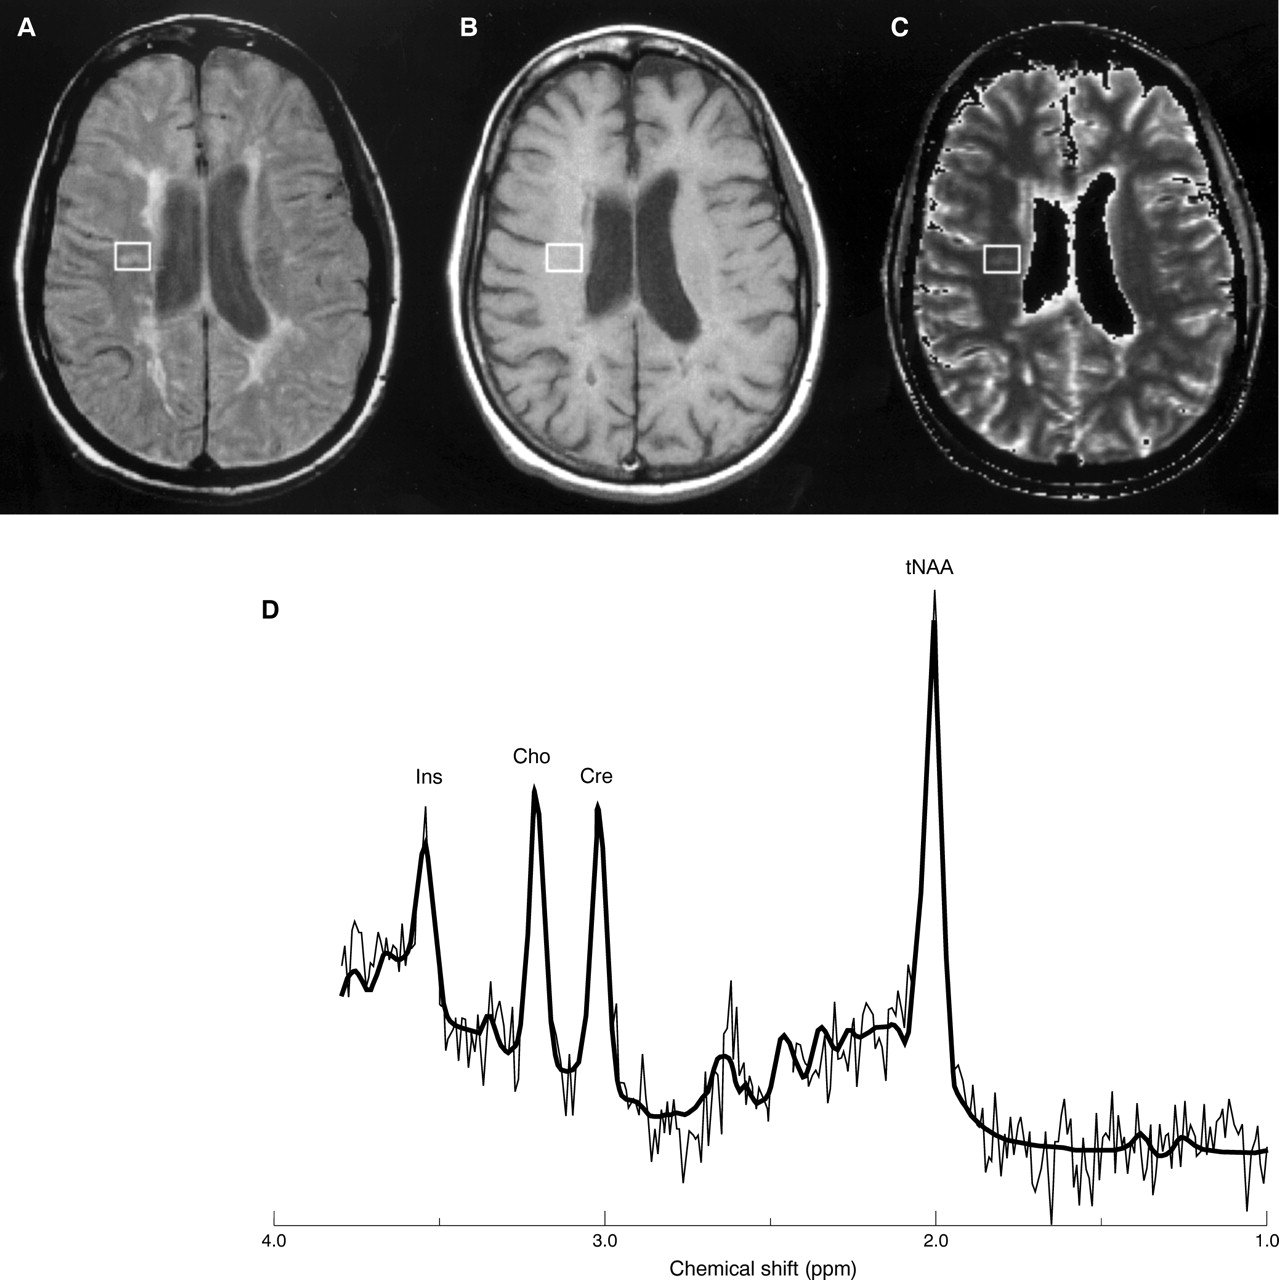
Voxel positioned over a lesion from the “isointense” group. (A) Axial proton density weighted, (B) T1 weighted MRIs, and (C) calculated T1 map. (D) The spectrum from this voxel was then acquired with PROBE and processed using the LCModel (tNAA 10.7 mM, Ins 5.4 mM, Cho 1.7 mM, Cre 5.8 mM).

Voxel positioned over a lesion from the “hypointense” group in the same patient. (A) Axial proton density weighted, (B) T1 weighted MRIs, and (C) calculated T1 map. (D) The spectrum from this voxel was then acquired with PROBE and processed using the LCModel (tNAA 7.1 mM, Ins 8.8 mM, Cho 1.6 mM, Cre 5.2 mM).
Single voxel 1H-MRS was acquired using a PRESS sequence with TR 3000 ms, TE 30 ms, 192 averages and an eight step phase cycle. Automatic shimming and water suppression were applied as part of the PROBE acquisition method (GE Medical Systems). Metabolic concentrations were estimated using the LCModel technique. LCModel analyses an in vivo spectrum as a linear combination of model spectra of metabolite solutions in vitro and provides absolute quantification by reference to an external calibration standard. It is an automated technique, which thus minimises user variability.28 An ongoing quality assurance programme ensured the accuracy and reproducibility of the tNAA values by regularly rescanning a pair of phantoms containing known concentrations of NAA.
The mean T1 relaxation times of the tissues within the spectral voxels were calculated from T1 maps generated using a previously reported multislice technique.29 In brief, T1 was calculated from a pair of gradient echo image sets with scanning parameters (TR/TE/flip angle/NEX=1500 ms/11s /45 degrees /1.5; 50 ms/11 ms/45 degrees/3). Pure axial contiguous slices of 5 mm thickness, 256×128 matrix, and 24×24 field of view were positioned such that three whole slices fell exactly and entirely within the in plane dimension of the spectral volume (15 mm). Corrections were made for head coil radio frequency field non-uniformity and for the influence of pulse sequence slice profile.29
Mean voxel T1 values were calculated within the area covered by the spectral voxel in each slice using the image display program “Dispimage”.30 As the voxel area was identical in each slice, the mean of these three values was then taken to give the mean for the entire voxel. The T1 relaxation time was also calculated for an equivalent sized volume of normal appearing white matter (NAWM) in each of the subjects in a similar region of the brain.
STATISTICAL ANALYSIS
Comparisons between the groups of T2 lesions that appeared hypointense and those that appeared isointense on T1 weighted MRI were performed using the Wilcoxon signed rank test. The Spearman rank correlation coefficient (r) was calculated to investigate the correlations between T1 relaxation times and metabolite concentrations with the voxels of brain tissue.
Results
Twenty two high signal T2 lesions were studied—one isointense and one hypointense T1 lesion from each of the 11 patients with secondary progressive multiple sclerosis. All the lesions were judged to be chronic by their presence on a previous MRI brain image performed 9 months earlier as part of the interferon β-1b trial.
The T1 relaxation times of hypointense T1 lesions were significantly longer in hypointense T1 lesions compared with isointense T1 lesions (table). The T1 relaxation time of the “isointense” T1 lesions was however, significantly longer than NAWM (median 700 ms, range 640–800 ms; p=0.004).
The tNAA was significantly lower in the hypointense T1 lesions compared with the isointense lesions (isointense T1 lesion: median 8.2 mM, range 6.9–10.7 mM; hypointense T1 lesion: median 7.2 mM, range 4.5–8.6 mM; p=0.03). The Ins was significantly higher in the hypointense T1 lesions (isointense T1 lesions: median 5.5 mM, range 3.8–8.0 mM; hypointense T1 lesions: median 7.8 mM, range 6.6–10.6 mM; p=0.003). There were no significant differences in the absolute concentrations of Cre and Cho between the two groups (table).
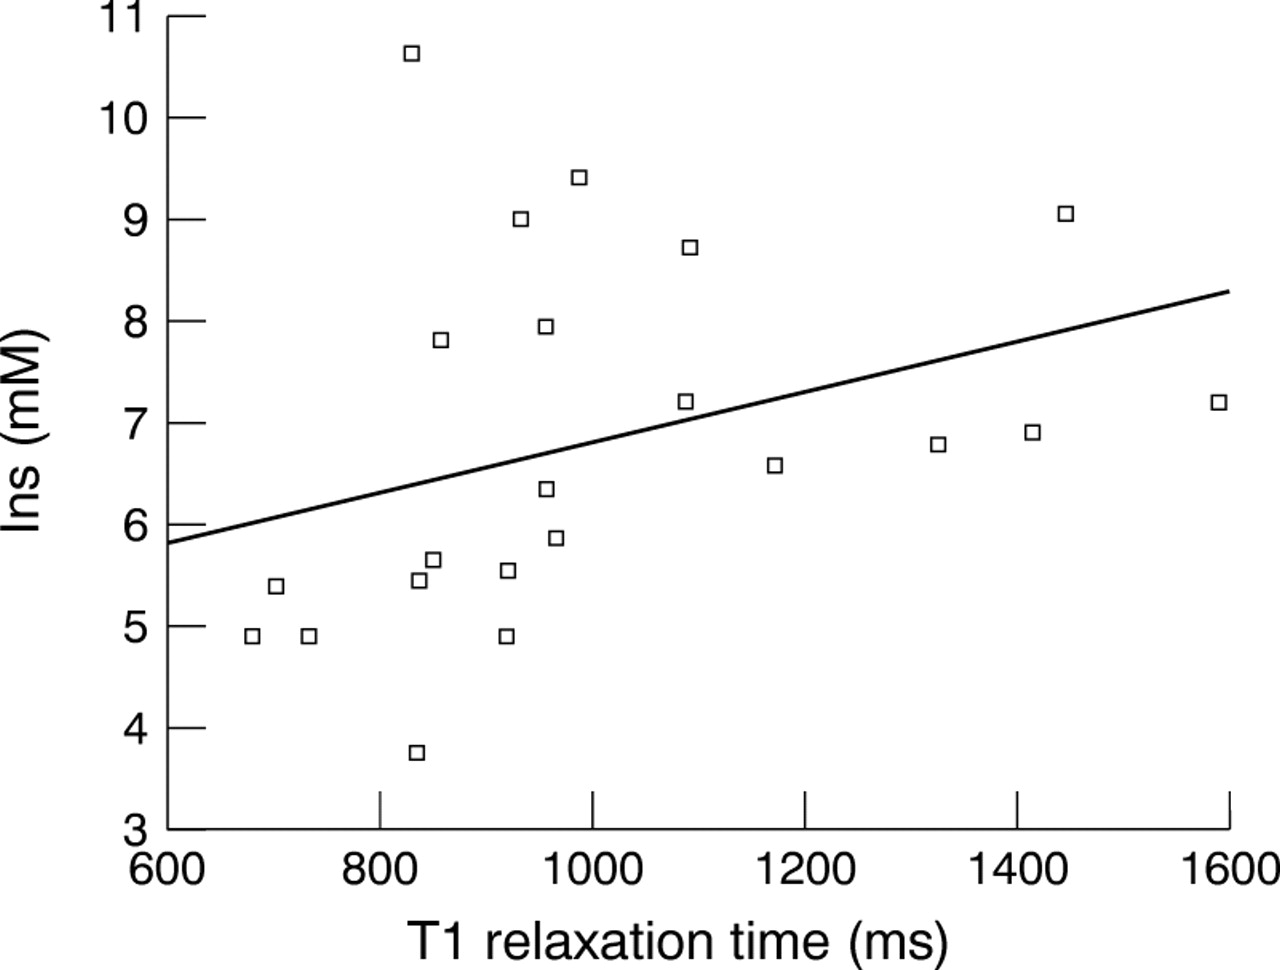
T1 relaxation time correlated significantly with tNAA (r=−0.8, p<0.001, fig 3) and Ins (r=0.5, p=0.01, fig 4). There was no significant correlation between T1 relaxation time and Cre or Cho. tNAA correlated significantly with Ins (r=−0.5, p=0.02).

Scatter plot demonstrating the relation between tNAA (mM) and T1 relaxation time (ms) (r=−0.8, p<0.001).
Scatter plot demonstrating the relation between Ins (mM) and T1 relaxation time (ms) (r=0.5, p=0.01).
Discussion
This study has shown tNAA to be significantly lower in hypointense T1 lesions compared with isointense T1 lesions in multiple sclerosis and that there is a significant inverse correlation between tNAA and T1 relaxation time. In addition, there was a significantly higher Ins in hypointense T1 lesions compared with isointense T1 lesions. We also found Ins to significantly correlate with T1 relaxation time.
1H-MRS studies in multiple sclerosis have shown the peak attributed to N-acetyl derived groups to be reduced in acute and chronic lesions and in normal appearing white matter in established multiple sclerosis.31-33 This reduction can be partially reversible over a 4 to 8 month period in acute multiple sclerosis lesions.21 By confining our study to lesions known to be at least 9 months old, this transient reduction should have been avoided. tNAA seems to reflect the density or function of axons and its greater reduction in hypointense T1 lesions may reflect the more extensive axonal damage that has been reported in histopathological studies13-15 There may also be a dilutional effect caused by the increased extracellular space which is thought to occur in these lesions13 and which may also contribute to their prolonged T1 relaxation time. Our findings of an inverse correlation between tNAA and T1 relaxation time are in keeping with a recent MR spectroscopic report correlating NAA with T1 relaxation time.17
In addition to T1 and NAA, a third MR marker of focal tissue destruction is the magnetisation transfer ratio (MTR). Interestingly, several reports have correlated reduced lesion MTR with reduced NAA34 35 and with prolonged T1, the last either measured directly17 or inferred from the appearance of T1 hypointensity.15 16 36
An increase of Ins in multiple sclerosis lesions has been noted previously20-22 but the finding in our study that this correlates with the degree of T1 hypointensity has not. Ins has a short T2 and therefore is difficult to detect using spectroscopic acquisition with a long echo time, as has been previously used in a spectroscopic study of hypointense T1 lesions.17 Gliosis is a characteristic feature in chronic multiple sclerosis lesions and the increased Ins may reflect this. Support that gliosis may contribute to the hypointense lesions comes from experimental studies that have shown it to cause an increase in T1 relaxation time.37 The correlation found between NAA and Ins might imply that the degree of gliosis is related to the severity of axonal damage.
Cre has also been suggested to be a glial marker17 owing to the higher concentration of creatine in astrocytes than neurons, at least in rat cells.19 Previous reports in multiple sclerosis have described variable patterns, including increased38 and decreased17 concentrations of Cre in multiple sclerosis lesions compared with normal appearing white matter. Such variable findings may reflect a varying balance of cell types—for example, fewer axons, more astrocytes, plus the dilutional effect of a variably expanded extracellular space. In the present study, no significant differences were found in Cre concentration between isointense and hypointense lesions.
The technique for measuring T1 relaxation time has previously been shown to be robust. It was accurate, with errors assessed to be less than 5%29 when measured in phantoms. Our results for the median T1 relaxation time of normal appearing white matter were consistent with the published reference ranges from multicentre studies for this tissue using a 1.5 Tesla MR scanner.39 The overlapping ranges of T1 relaxation time measurements in lesions judged visually to be hypointense or isointense, as well as in normal appearing white matter highlights the problems with qualitatively assessing lesions. Hypointense T1 lesions occur in a continuous spectrum, with appearances from almost isointense through to markedly hypointense. The hypointense lesion load is very dependent on the MRI sequence used and the subjective opinion of the observer. The use of heavily T1 weighted sequences would greatly increase the apparent T1 lesion load. A moderately T1 weighted sequence therefore acts as a “filter” to only show up those lesions with a very prolonged T1.40 Although the T1 relaxation time was significantly different in hypointense and isointense lesion groups in this study, the values of some individual lesions did overlap. This may be an indication that quantitative T1 measurement is a more reliable indicator of tissue/lesion status and that hypointensity is affected by other MR parameters—for example, proton density or T2 relaxation.
It is not known what effect, if any, interferon β-1b may have on our results. A treatment effect of interferon β on hypointense T1 lesion load accumulation has been found in several studies.12 41 42 Whether or not interferon β-1b causes an alteration in T1 relaxation time or metabolite concentration within the lesions has yet to be determined. Further studies evaluating the relations between these MR parameters should include treatment naive patients and other clinical subgroups.
In summary, our findings suggest that T1 relaxation time measurement may reflect the severity of axonal loss/dysfunction and possibly also gliosis in chronic multiple sclerosis lesions. T1 relaxation time provides a robust technique for quantifying tissue status and provides information about the degree of tissue damage which the qualitative classification of the lesion into being hypointense or not on moderately T1 weighted images may not. Future treatment trials and studies into the pathogenesis of multiple sclerosis may benefit from the measurement of T1 relaxation time either to track changes occurring in individual lesions or to set absolute, reproducible thresholds for the measurements of T1 lesion loads.
Acknowledgments
The NMR Unit is supported by a generous grant from the Multiple Sclerosis Society of Great Britain and Northern Ireland. PAB and PDM are sponsored by Schering AG. SML is sponsored by Biogen. We thank Mr DG MacManus and Mr A Lowe for their assistance with this study.