Article Text

Abstract
OBJECTIVES To measure the sensitivity and specificity of five MRI sequences to subarachnoid haemorrhage.
METHODS Forty one patients presenting with histories suspicious of subarachnoid haemorrhage (SAH) were investigated with MRI using T1 weighted, T2 weighted, single shot fast spin echo (express), fluid attenuation inversion recovery (FLAIR), and gradient echo T2* sequences, and also by CT. Lumbar puncture was performed in cases where CT was negative for SAH. Cases were divided into acute (scanned within 4 days of the haemorrhage) and subacute (scanned after 4 days) groups.
RESULTS The gradient echo T2* was the most sensitive sequence, with sensitivities of 94% in the acute phase and 100% in the subacute phase. Next most sensitive was FLAIR with values of 81% and 87% for the acute and subacute phases respectively. Other sequences were considerably less sensitive.
CONCLUSIONS MRI can be used to detect subacute and acute subarachnoid haemorrhage and has significant advantages over CT in the detection of subacute subarachnoid haemorrhage. The most sensitive sequence was the gradient echo T2*.
- magnetic resonance imaging
- subarachnoid haemorrhage
Statistics from Altmetric.com
Computed tomography has been the imaging investigation of choice in cases of suspected subarachnoid haemorrhage (SAH) since its introduction into clinical practice because of high sensitivity to acute SAH, short scan times, and widespread availability. Lumbar puncture is performed in cases of suspected SAH with negative CT.
The sensitivity of CT to SAH is more than 90% within 1 day of the haemorrhage1-3 but falls off rapidly with time and approaches 0% at 3 weeks.1 4 5 Although much of these data relate to previous generations of scanners, more recent results from higher resolution scanners show only modest improvements.2 3 This is because contrast resolution rather than spatial resolution is the limiting factor for sensitivity. Brain CT remains relatively insensitive to SAH more than a few days old especially in cases where the bleed is small. This is a particular problem as these patients are usually in good condition and have the most to lose from a missed diagnosis of SAH and subsequent rebleed from a ruptured aneurysm.
As CT cannot exclude SAH, lumbar puncture is used as the longstop of investigation. Lumbar puncture has the advantage that its sensitivity remains high for several weeks after the ictus.6
Conventional MR T1 and T2 weighted images are relatively insensitive to SAH. Scan times for MRI are longer and allow less access to the patient than CT, making it unsuitable for confused or restless patients. For these reasons MRI has not had a role in the detection of SAH until recently. In 1994 Noguchi et al 7 reported the use of a FLAIR sequence in the detection of SAH in three cases. Since then other reports have confirmed the usefulness of FLAIR in this role.8-12 There has been general agreement that the sensitivity of MRI to SAH increases over the few days after the bleed.9 10 13 As this is the time period over which the sensitivity of CT falls MRI would be expected to be to be more sensitive than CT after a time interval from the haemorrhage.
MR scanning protocol
We have assessed the sensitivity of five MRI sequences for the detection of SAH. To our knowledge this use of the T2* sequence has not been previously studied. In view of the dependence of sensitivity of CT and MR on time from the bleed we have divided the series into two groups. Subacute cases were scanned between 4 and 14 days from the haemorrhage and acute cases within 4 days.
Materials and methods
All patients presenting to the departments of Neurology and Neurosurgery at the Royal Hallamshire Hospital with a history compatible with SAH from March 1998 to April 1999 were considered candidates for the study. Only those well enough to have MR scans without sedation or anaesthesia were entered. It was also required that all patients studied should not have had the source of the SAH operated on before the MRI. Some patients could not be included because it was not possible to scan them before they were operated on due to limited MRI availability. After these restrictions 41 patients entered the study out of a total 126 patients, with SAH of all grades and from all causes, excluding trauma, presenting to the hospital. There were 25 female and 16 male patients, age range 22–76 with a mean of 41 years. Twenty two patients underwent MR examination in the acute phase and 19 in the subacute phase. In three patients the CT was done during the first 4 days from the ictus and the MR after 4 days. The CT results are thus from 25 acute cases and 16 subacute cases and are included for completeness but do not form a directly comparable group with the MR sequences.
All patients had CT before the MR study. Brain CT was done on various scanners installed in hospitals within the Sheffield neurology referral area between 1985 and 1999. Scan protocols differed slightly from one to another. For these reasons the CT scans do not form a homogeneous group.
In all cases where the CT was negative for SAH a lumbar puncture was performed. The diagnostic test used for SAH was the spectrophotometric detection of bilirubin. The patient was considered to have had an SAH unless both the CT and lumbar puncture were negative.
All MRI was performed on a 1.5T system with 27 mT/m gradients (Eclipse, Picker Medical Systems, Cleveland, Ohio, USA). Five MR sequences were assessed. These were a spin echo T1 sequence, a fast spin echo T2 sequence, a single shot fast spin echo T2 (express) sequence, a fluid attenuation inversion recovery (FLAIR) sequence, and a gradient echo T2* sequence. The full MR scanning protocol is presented in the table. The total scanning time was 40 to 45 minutes for each patient. The MR and CT images were assessed independently by two from a pool of four experienced neuroradiologists (PDG, CAJR, TP, TH). The radiologists were told that SAH was suspected clinically but were not told the CT result (and had not seen the CT) when reviewing the MR. Similarly those reviewing the CT did not have access to the MR or its result. They were given no other details. A positive diagnosis of SAH was made if high signal was seen in the subarachnoid space on T1 or FLAIR images (FLAIR images suppress the normally high signal from CSF). An SAH was diagnosed on T2* images if loss of signal with “blooming” was seen in the subarachnoid space (figs 1-3).
Sensitivity was measured by dividing the number of cases with SAH detected by the sequence in question by the total number of SAHs in the gorup.
An additional measure of the sensitivity of the imaging methods relative to each other is also presented. The presence or absence of blood was recorded on all scans in the following eight locations: interhemispheric fissure, suprasellar cistern, right sylvian fissure, left sylvian fissure, perimesencephalic cisterns, ventricles, and intraparenchymal and frontal/parietal sulci. To assess the sensitivity of an MR sequence a location was assumed to contain blood if it was found to be positive on any of the MR sequences or CT. The proportion of this total found to be positive using a particular sequence was taken as a guide to the sensitivity of that sequence relative to the others detailed in the table. For example, in the 15 SAH positive cases in the subacute group there was a total of 8×15 or 120 locations of which 60 were positive for blood on at least one of the MR or CT images. Of these 60, 42 were positive on the T2* sequence giving T2* a “relative locational sensitivity” of 70%. This locational analysis does not give absolute sensitivities because we do not have an absolute test with which to positively exclude blood in a particular location. We offer this analysis because it allows relative sensitivities to be calculated on larger numbers than absolute sensitivities.
The five MR sequences were also used to scan 59 patients who did not have suspected SAH and hence did not have SAH excluded by lumbar puncture.To measure the specificity of the imaging methods these scans were reported by two from a pool of four radiologists in the same way as the study population of 41. No false positives were found
Ninety five per cent confidence intervals (95% Cis) were calculated using binomial distributions.
Results
Of the 22 patients who underwent MR examination in the acute phase, 16 had had an SAH and six were negative on CT and lumbar puncture. Of the 19 subacute patients, 15 had had an SAH and four had not. Two patients presented as having ischaemic stroke. In these two patients MR showed ischaemic change typical of post-SAH vasospasm; T2* imaging showed the SAH. Lumbar punctures were done after the MR because SAH had not previously been expected (both of these lumbar punctures were positive). It was not possible to determine the exact time of the SAH but the duration of symptoms meant neither could have been within 4 days of the haemorrhage so both were included in the subacute group. All other cases in the study presented with a sudden headache or sudden collapse with or without associated symptoms. One patient died within 10 days of the ictus from vasospastic stroke; all others were alive after 6 months. This good survival rate reflects the requirement that all patients entered in the study had to be well enough to be scanned without sedation or anaesthesia.
SENSITIVITIES
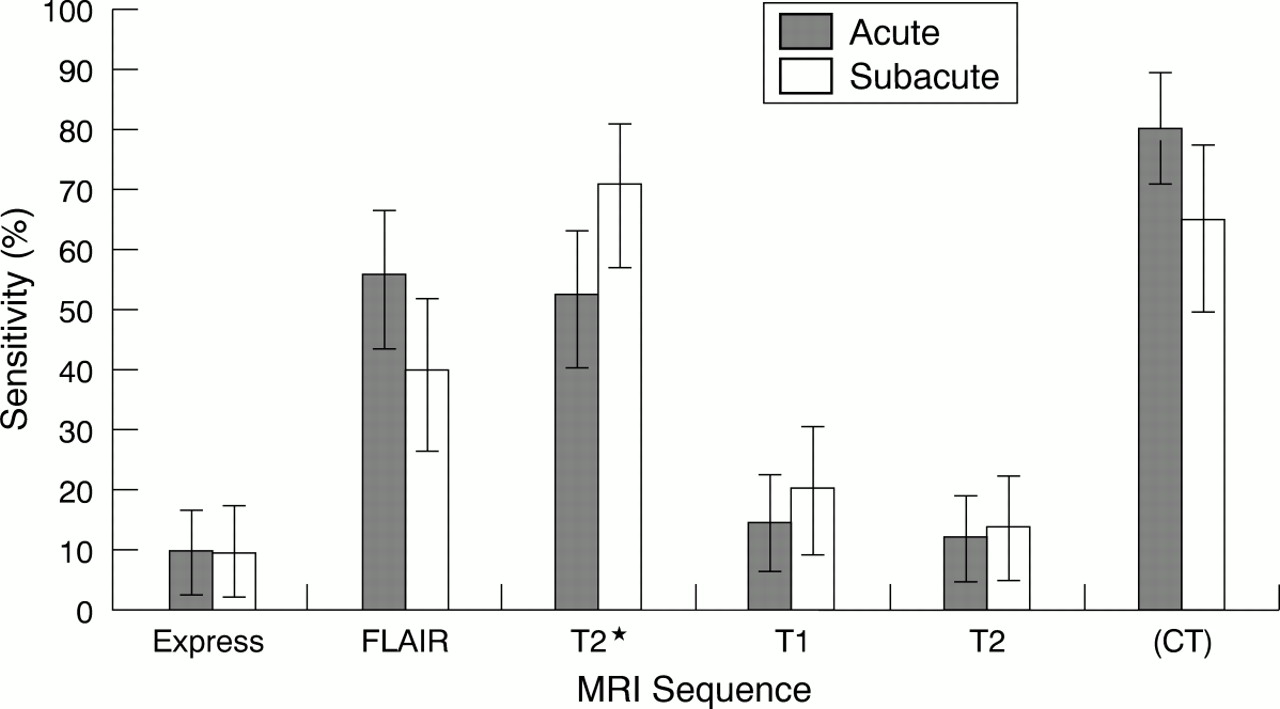
Figure 4 shows sensitivities as the number of patients in whom SAH was demonstrated by the individual modalities divided by the total number of patients who had SAH demonstrated by the CT and lumbar puncture combination.

Histogram showing the sensitivities of the five sequences (and of CT) in the acute and subacute periods; 95% CIs are based on binomial distributions.
The sensitivities for the MR sequences compared with the CT and LP combination in the acute group were T1 50%, T2 56%, express 50%, FLAIR 81%, and T2* 94% (and CT 95%). The one case missed by the T2* sequence was also missed by all other MR sequences and only seen on CT.
In the subacute group the overall sensitivities were T1 33%, T2 47%, express 33%, FLAIR 87%, and T2* 100% (and CT 75%). If the groups were pooled the overall time independent sensitivities were T1 42%, T2 52%, express 42%, FLAIR 84%, and T2* 97% (and CT 90%).
RELATIVE LOCATIONAL SENSITIVITIES
Figure 5 gives the results of relative locational sensitivity analysis and shows the proportions of locations that were positive on the various modalities. The total number of locations examined in the acute group was 128. Fifty five of them were positive on at least one MR sequence and a further 22 were positive on CT but negative on MR.

Histogram showing the results of the relative locational sensitivity analysis in the acute and subacute periods—the number of locations which are positive on the specific sequence (or CT) divided by the total number of locations found to be positive on any sequence or CT; 95% CIs are based on binomial distributions.
In the subacute group a total of 48 out of 120 locations were positive on at least one MR sequence and a further 12 were positive on CT but not MR. Locations found to be positive on the three CT scans in the subacute group which were obtained during the acute time period were counted. This was on the grounds that although the amount of blood in a location may decline by redistribution after an SAH, any location found to be positive early is likely to remain so to some extent for as long as the CSF abnormalities persist. Because there is no absolute standard of positivity for a given location, the absolute sensitivities of the various sequences cannot be derived from these data. These sensitivities are a guide to the technical performance of the sequences relative to each other but are less clinically relevant than the case sensitivities. Again T2* was the most sensitive sequence.
SPECIFICITY
Ten patients were scanned who had negative lumbar puncture for SAH. None of these had any positive locations (total of 80 locations) on any CT or MR sequence suggesting that these imaging investigations have low false positive rates. The five MR sequences were performed on 59 patients who did not have suspected SAH (24 had strokes, 15 had tumours, 10 had CNS infections, and 10 had miscellaneous conditions). No SAHs were later diagnosed in this group. All of these were negative on all sequences. Thus 69 scans on SAH negative patients were negative. The false positive rate is therefore less than 1:69 giving a specificity of more than 98.5% (95% CI 96.75–100%). It must be borne in mind that the population studied was selected in that all patients were referred to a specialist neurology centre. A more confident statement about specificity would require the examination of a less selected population of patients.
The specificity of the T2* sequence deserves further comment. The T2* sequence gives low signal in regions where the magnetic field strength varies over short distances as occurs at boundaries between tissues of differing magnetic susceptibility such as bone and soft tissue. The resulting field variation and hence low signal extends beyond the boundary into the tissues on each side as a “bloom”. The bone surfaces of the skull base thus yield areas of low signal. An example from the lesser wing of the sphenoid can be seen in fig 2 D. Such low signal cannot be reliably distinguished from low signal due to subarachnoid blood. The test is not reliable around the skull base for this reason. In this study locations where this ambiguity arose were counted as negative on T2*. We recommend using the T2* and FLAIR sequences together, the specificity of FLAIR around the skull base complementing the sensitivity of T2* elsewhere.

An acute SAH. Brain CT was performed on the day of the haemorrhage; MR scans were taken 48 hours later. (A) CT shows blood in the interhemispheric fissure which is not seen on a comparable MR cut with (B) a T1 weighting sequence or (C) a fast spin echo T2 weighting sequence. (D) SAH is seen on the gradient echo T2* image as an area of low signal. Lower cuts on the same patient show interhemispheric, sylvian, and cisternal blood on (E) CT and (F) T2* MR.
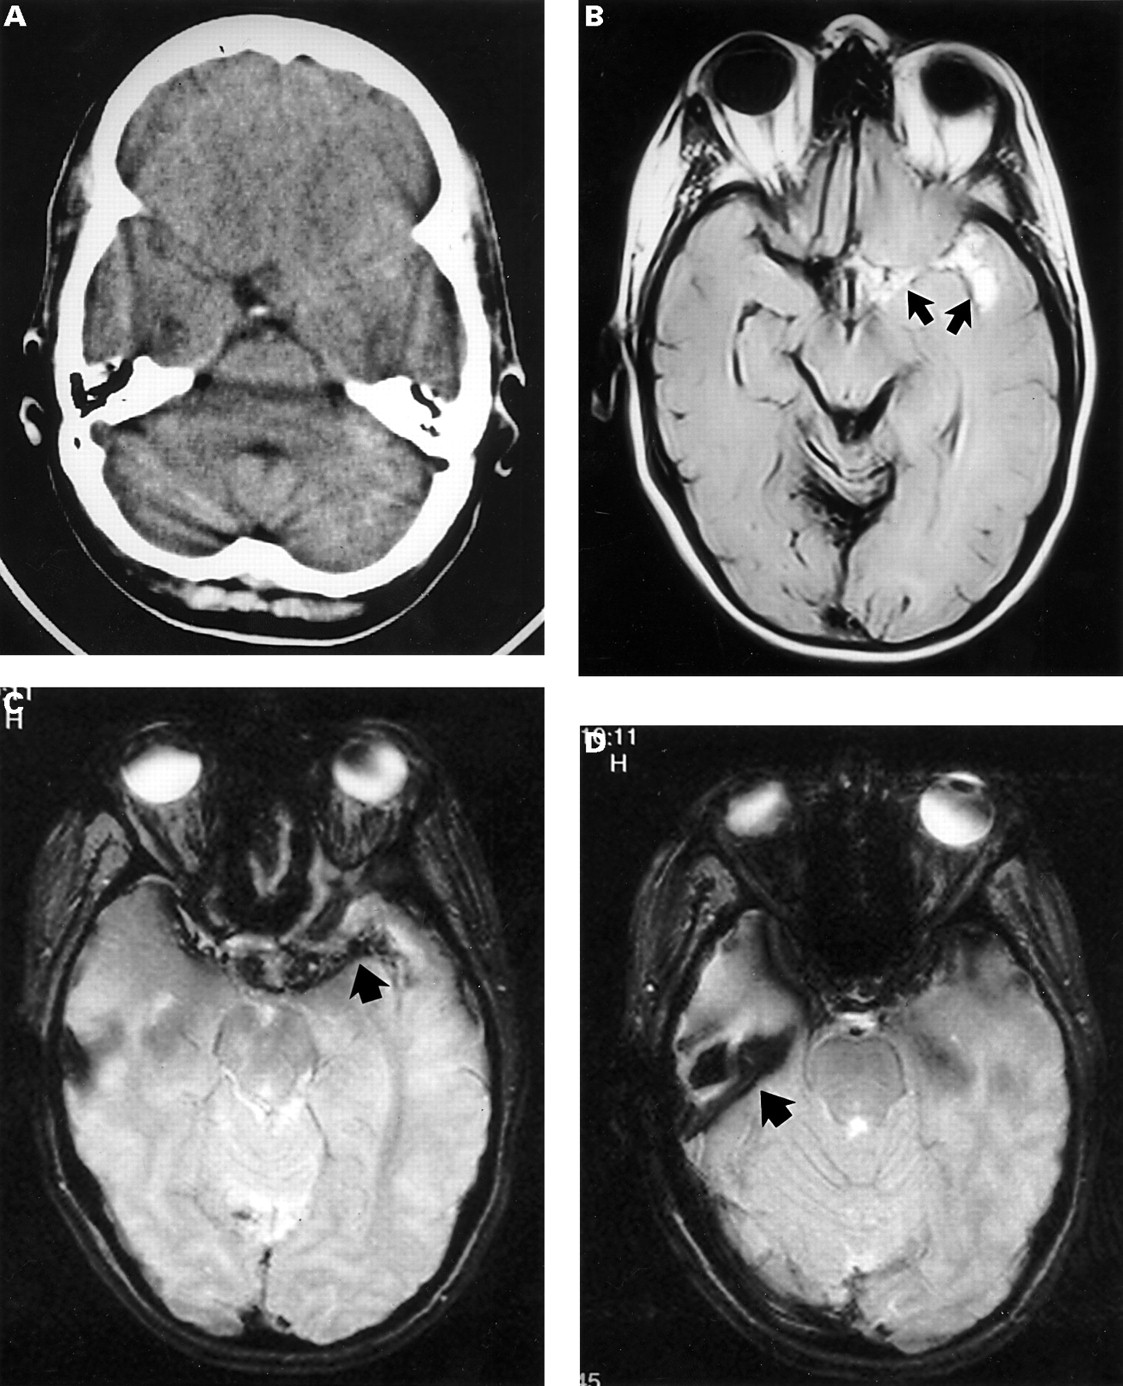
A subtle subacute SAH. (A) Brain CT was done 7 days after the haemorrhage and shows abnormal isointense material in the suprasellar cistern and along the path of the left middle cerebral artery towards the sylvian fissure. (B) A comparable slice of FLAIR MR imaging done 24 hours after the CT. It shows the abnormality more clearly as high signal material in the left side of the suprasellar cistern and left sylvian fissure (arrows) in keeping with subacute SAH. (C) The same area shows as low signal on T2* MR imaging (arrow). (D) One slice down from C illustrates a problem with the T2* images. The low signal arising from the boundary between tissues of differing susceptibility—in this case the surface of the right lesser sphenoid wing (arrow)—obscures any additional low signal due to blood in the sylvian fissure and could be misinterpreted as blood. This is one reason why we regard the FLAIR and T2* sequences as complementary rather than alternatives.

A CT negative SAH as confirmed by lumbar puncture. (A) Brain CT taken 4 days after the onset of headache is normal. The MR scans were done within 1 hour of the CT. (B) The T2* image closest to the slice of A. It shows an area of low signal (arrow). (C) The corresponding FLAIR image shows high signal from the same area (arrow). Note the different angulation used for CT and MR images.
Discussion
The pathophysiology of SAH and the physical principles of CT explain the change in sensitivity of CT in detecting SAH with time from ictus. x Ray techniques including CT produce tissue contrast because of the proportion of the incidentx ray beam that is stopped (attenuated) by the tissue. This relies on two factors: the amount of tissue traversed by the beam and the attenuation coefficient of the tissue. The attenuation coefficient bears a direct relation to the electron density of the tissue. Fresh haemorrhage has the same electron density as brain and other soft tissues and so hyperacute (within 2 hours of ictus) SAH may not be seen directly on CT. As reabsorption of serum from a haematoma progresses the local packed cell volume, and hence electron density, increases making acute SAH visible as a high attenuating “white” area. With the passage of further time SAH becomes less visible on CT principally because of two processes. Firstly, CSF circulation redistributes focal SAH into other parts of the subarachnoid space and ventricular system. The resulting dilution reduces the conspicuity on CT. Secondly, reabsorption of serum is followed by reabsorption of the protein component, which also leads to reduced conspicuity. Consequently the sensitivity of CT to SAH falls drastically over the first 14 days from ictus.4
Magnetic resonance imaging does not directly rely on the electron density of substances for its contrast resolution. The MR signal principally relies on proton (hydrogen nuclei) density, and T1 and T2* (which includes the T2 component) relaxation times. The different physical and chemical states of iron within haemorrhage have profound effects on the MR signal.14 Standard spin echo MR sequences are considered to be insensitive in detecting acute haemorrhage; however, MR imaging offers two possibilities for improved detection of SAH, both of which depend on the appearance of haemoglobin and its breakdown products.
The protein component produces high T2 signal which is swamped by the bright T2 signal from CSF on a conventional T2 weighted image. FLAIR sequences suppress the CSF signal and allow the signal from globin and its breakdown products to be seen. FLAIR has been reported to be a sensitive test for SAH in the subacute phase.7-12 15
Iron in the form of Fe3+ or Fe2+ is paramagnetic. The presence of paramagnetic species in the CSF leads to localised perturbations in the magnetic field “seen” by the MR visible hydrogen nuclei. This leads to an increase in the precession rate in the immediate vicinity of Fe ions on the atomic scale and hence a faster dephasing and loss of T2* signal. Gradient echo sequences with significant T2* weighting are particularly sensitive to this localised change and are thus suited to detecting SAH, even in the acute stage.
The combination of lumbar puncture and CT is sensitive and specific for acute SAH. CT suffers from a loss of sensitivity to SAH in the subacute phase. Methods of MRI, particularly FLAIR and T2*, may be able to supplement CT in this situation. Both FLAIR and T2* can be performed on standard MR scanners. The major finding of this study is that appropriately selected MR sequences are sensitive and specific in the detection of SAH. This is by contrast with the widespread view in the clinical neuroscience literature although recent reports7-10 12 13 15 show the value of FLAIR in detecting SAH. The practical outcome of this work is that MR using FLAIR and T2* sequences together is a valuable tool in the detection of SAH and may be useful in the following situations:
-
In late presenting SAH where the improved sensitivity over CT may avoid the need for lumbar punctures in some cases
-
In SAH presenting atypically. These will often involve MR scanning where SAH may not be suspected but features suggestive of sequelae may be found, in which case T2* and FLAIR sequences may enable the diagnosis to be made as happened in the two cases reported here
-
As an additional test in cases where the clinical picture, CT, and lumbar puncture give inconclusive or contradictory results or in situations where CT or lumbar puncture cannot be done
-
In the context of a more extensive MR investigation of SAH. With the advance of MR technology other modalities relevant to SAH such as perfusion weighted scanning and MR angiography have become available. Although at present the clinical impact of these techniques is still under investigation it seems probable that in the future MR will offer alternatives to conventional investigations such as lumbar puncture and catheter angiography in some cases. This may allow a less invasive and more streamlined approach to the investigation of SAH in the future.
Conclusions
Sensitivity to SAH varied among the five MR sequences studied from 50% to 94% in acute SAH and from 33% to 100% in subacute SAH. The most sensitive sequences were FLAIR and T2* with T2* performing slightly better than FLAIR. The sensitivity of T2* was 94% under 4 days from the ictus and 100% between 4 and 14 days. Our data suggest a specificity of more than 98.5% (95% CI (96.75—100)%) but scanning of an unselected population would be needed to confirm this.