Article Text

Abstract
OBJECTIVES To explore volume changes of the entorhinal cortex (ERC) and hippocampus in mild cognitive impairment (MCI) and Alzheimer's disease (AD) compared with normal cognition (NC); to determine the powers of the ERC and the hippocampus for discrimination between these groups.
METHODS This study included 40 subjects with NC, 36 patients with MCI, and 29 patients with AD. Volumes of the ERC and hippocampus were manually measured based on coronal T1 weighted MR images. Global cerebral changes were assessed using semiautomatic image segmentation.
RESULTS Both ERC and hippocampal volumes were reduced in MCI (ERC 13%, hippocampus 11%, p<0.05) and AD (ERC 39%, hippocampus 27%, p<0.01) compared with NC. Furthermore, AD showed greater volume losses in the ERC than in the hippocampus (p<0.01). In addition, AD and MCI also had cortical grey matter loss (p< 0.01) and ventricular enlargement (p<0.01) when compared with NC. There was a significant correlation between ERC and hippocampal volumes in MCI and AD (both p<0.001), but not in NC. Using ERC and hippocampus together improved discrimination between AD and CN but did not improve discrimination between MCI and NC. The ERC was better than the hippocampus for distinguishing MCI from AD. In addition, loss of cortical grey matter significantly contributed to the hippocampus for discriminating MCI and AD from NC.
CONCLUSIONS Volume reductions in the ERC and hippocampus may be early signs of AD pathology that can be measured using MRI.
- entorhinal cortex
- hippocampus
- mild cognitive impairment
- Alzheimer's disease
Statistics from Altmetric.com
Pathological studies of brains from patients with Alzheimer's disease (AD) showed the greatest neurodegenerative changes in the entorhinal cortex (ERC) and hippocampus compared with other brain regions.1 2 In addition, there is evidence that early AD pathology may start in the ERC, then progress to the hippocampus.3 In accordance with these findings, MRI studies have shown significant atrophy of the ERC and hippocampus in patients with AD,4-14 in addition to generalised brain atrophy, loss of grey matter, and increased white matter lesions.15-17 In an attempt to determine which brain region showed the greatest change in AD, several MRI studies compared changes in the ERC and hippocampus.4 12 18Using a small sample of subjects, Bobinski et al reported that changes in the ERC showed greater discrimination between patients with early AD and controls with normal cognition (NC) than changes in the hippocampus.18 But Frisoni et al reported that hippocampal changes had superior diagnostic accuracy over ERC changes in patients with AD compared with those with NC.12 By contrast, Juottonen et al and Xuet al found little difference between the ability of the ERC and the hippocampus to distinguish patients with AD from subjects with NC.4 19
Recently there has been increased interest in identifying patients at the earliest stages of AD, so that effective treatment (when this is developed) can be initiated at an early stage. Therefore, neuroimaging studies have been performed on non-demented subjects who are at increased risk for AD, including family history of AD,20the APOE genotype,21 and non-demented patients with mild cognitive impairment (MCI).22-25 The hippocampus was found to be significantly reduced in subjects with MCI compared with those with NC.22 23 Recently, two publications addressed ERC volume in patients with MCI. Both reported that the ERC was significantly reduced in patients with MCI compared with those with NC and Xu et al found that the ERC and the hippocampus had roughly equivalent discrimination power between MCI19 26 and NC; however, the discrimination powers of ERC shown in these two papers were quite different.19 26
Therefore, the overall goal of this study was to determine if changes in the ERC provided diagnostic information in addition to that obtained from the hippocampus and other brain structures in AD and MCI. Brain MRI measurements of the following volumes were quantified: ERC, hippocampus, cortical grey matter (cGM), subcortical GM (sGM), white matter (WM), sulcal CSF (sCSF), ventricular CSF (vCSF), and white matter signal hyperintensities (WMSH). Our specific goals were to determine: (1) Whether the ERC and hippocampal volumes are significantly reduced in patients with MCI compared with subjects with NC; (2) Whether ERC and hippocampal volumes are significantly reduced in patients with AD compared with patients with MCI; (3) Whether ERC volume is more sensitive than hippocampal volume to distinguish AD from MCI, AD from NC, and MCI from NC; (4) What is the difference in tissue segmentation between NC, MCI, and AD; (5) the extent to which ERC and hippocampal volumes are correlated with each other and the extent to which brain volume measurements are correlated with the cognitive impairment, measured by the mini mental state examination (MMSE). Finally, we compared the powers of the ERC and hippocampus to classify between groups and, in addition, assessed the value of using the ERC, hippocampus, and segmentation together for classification.
Materials and methods
SUBJECTS
There were 40 healthy elderly people with normal cognition (NC, 20 men, 20 women, age 75.1 (SD 4.3) years, MMSE 29.0 (SD 0.9)), 36 patients with mild cognitive impairment (MCI, 17 men, 19 women, age 75.1 (SD 8.2) years, MMSE 25.8 (SD 3.6)), and 29 patients with Alzheimer's disease (AD, 13 men, 16 women, age 75.8 (SD 5.1) years, MMSE 17.7 (SD 5.7)). The ERC and hippocampal volumes were manually measured in all subjects. Segmentation of brain tissues into cGM, sGM, WM, sCSF, vCSF, and WMSH was carried out in 39 subjects with NC (20 men, 19 women, age 75.3 (SD 4.2) years, MMSE 28.2 (SD 0.9), 27 patients with MCI (14 men, 13 women, age 76.1 (SD 7.6) years, MMSE 26.2 (SD 3.5)), and 27 patients with AD (13 men, 14 women, age 75.5 (SD 5.1) years, MMSE 16.9 (SD 5.8)). All patients with NC had neurological and neuropsychological tests performed by the same staff at the recruitment centres that examined patients with MCI and those with AD and had test scores within the normal range. Furthermore, subjects with NC were included only if they had no clinical histories of alcoholism, psychiatric illnesses, epilepsy, hypertension, diabetes, major heart disease, or head trauma, and no sign on the MRI data of other major neurodegenerative diseases.
DIAGNOSIS OF MCI
The diagnostic team, based on comprehensive dementia evaluation that included history from the patients and a caregiver, neurological and mental status examinations of the patient, and neuropsychological testing determined that the patient's cognitive function was not normal, but that they did not meet DSM IV criteria for dementia. Examples of this situation would include a single, isolated cognitive deficit or a set of mild cognitive deficits insufficient to cause significant functional impairment. Neuropsychological testing was classified as normal or not according to the clinical judgment of neuropsychologists expert in the evaluation of dementia, and took into account all relevant factors including estimated premorbid functions. However, the final diagnosis was not solely based on the test interpretation. It was the consensus diagnosis of the clinicians based on all available evidence. Some of these patients did not meet the criteria for MCI published by Petersen et al. 27
DIAGNOSIS OF AD
Alzheimer's disease was diagnosed according to the National Institute of Neurological and Communicative Disorders and Stroke-Alzheimer's Disease and Related disorders Association (NINCDS/ADRDA) criteria, including probable and possible AD.
All patients with MCI and those with AD were recruited from the University of California, San Francisco and the University of California, Davis Alzheimer centre. Control subjects were recruited by posting flyers in the community. The cognitive function of each patient was screened with the MMSE. All patients were scanned using the same protocol. All patients or their guardians gave written informed consent before participating in the study, which was approved by the committees of human research at the University of California, San Francisco and the University of California, Davis.
MRI EXAMINATION
All studies were performed on a 1.5T Magnetom VISION system (Siemens Inc, Iselin, NJ, USA) equipped with a standard quadrature head coil. The MRI protocol consisted of sagittal T1 weighted scout view images, oblique axial double spin echo (DSE) scans parallel to the axis of optic nerve, and volumetric magnetisation prepared rapid acquisition gradient echo (MP-RAGE) perpendicular to the DSE images yielding T1 weighted coronal images roughly perpendicular to the long axis of the hippocampus. The measurement parameters of DSE were TR/TE1/TE2 2500/20/80 ms, field of view (FOV) 192×256 mm2, matrix size 154×256, in plane resolution 1.25×1.00 mm2, and 3 mm slice thickness covering the whole brain from the vertex to the most inferior part of the cerebellum. The measurement parameters of MP-RAGE were TR/TI/TE 10/250/4 ms with a 15 degree flip angle, FOV 192×256 mm2, matrix size 192×256, and 1.4 mm thick partition, yielding 1.0×1.0×1.4 mm3 spatial resolution.
MEASUREMENT OF ERC AND HIPPOCAMPAL VOLUME
Quantitative volumes of the ERC and hippocampus were obtained by manually drawing the boundary of the structures as seen in the coronal T1 weighted MP-RAGE images shown in figure 1. Measurement of ERC volume was performed according to the protocol developed by Insaustiet al.28 Briefly, ERC was measured from one section caudal to the level of the limen insulae, and until the section behind the posterior limit of the gyrus intralimbicus. The medial margin of the ERC was marked along the ventral border of the gyrus semilunaris—that is, the fundus of the sulcus semiannularis. The lateral margin of the ERC was in the medial bank of the collateral sulcus, where it borders the perirhinal cortex. The borders of the ERC and perirhinal cortex depended on the depth of the collateral sulcus. Boundaries of the hippocampus were drawn following the guidelines of Watson et al,29 including the hippocampus proper, dentate gyrus, subiculum, fimbria, and alveus. One rater (ATD), who was blinded to the diagnosis and all other clinical information, performed all measurements of the ERC and hippocampus. Rater reliability was determined by marking the ERC and hippocampus of 10 subjects twice and expressing the coefficients of variation (CoV). The CoV was 2.6% for the ERC and 1.0% for the hippocampus.
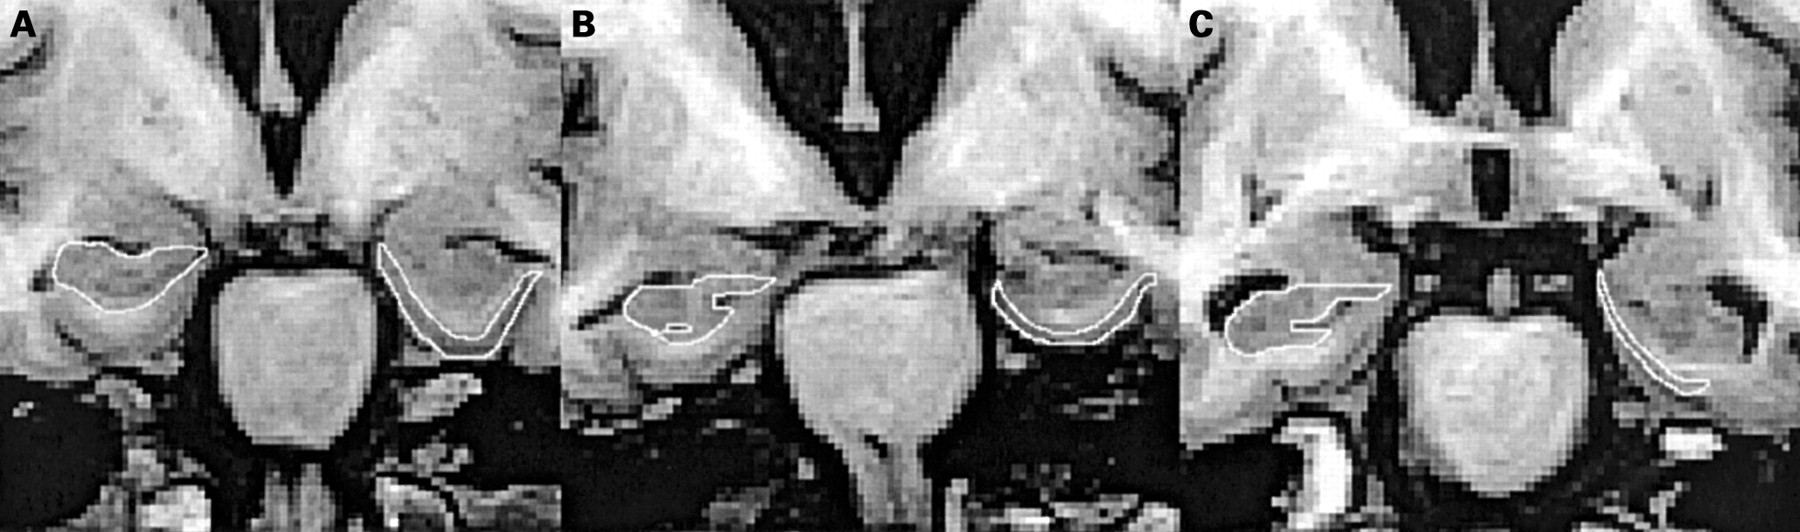
Entorhinal cortex (ERC) (right) and hippocampal (left) volume measurement in MP-RAGE images. (A) Normal cognition (NC); (B) mild cognitive impairment (MCI); (C) Alzheimer's disease (AD).
BRAIN TISSUE SEGMENTATION
Before tissue segmentation was performed, MRI data were corrected for B1 inhomogeneity with a low frequency intensity filter, as described by Tanabe et al.15Complications with the potential problem of cross talking between slices of DSE images was avoided by acquiring DSE using an interleaved slice selection mode and a 2500 ms delay time between interleaved acquisitions. Slice cross talking is not a problem for MP-RAGE, which is performed in a volumetric fashion without selection of slices. After the scalp was manually stripped, both images of the double spin echo and the 3D T1 weighted MP-RAGE were coregistered. Then a semiautomatic program combining threshold methods and discrimination analysis incorporating the data from each pixel from both images of the T2 weighted MRI and the 3D T1 weighted MRI was used to segment brain tissues.15 Total intracranial volume (TIV) was measured from the top of the brain to the slice where the cerebral peduncles appeared. Brain tissues were automatically segmented to grey matter (GM), white matter (WM), and CSF. Subsequently, an operator manually separated GM to cGM and sGM, and CSF to sCSF and vCSF. Finally, WMSH was manually separated from WM.
NORMALISATION
To account for variation in TIV, the volumes of the ERC, hippocampus, and segmentation data of each subject were normalised to individual TIV (TIVi), according to the formula: VOLi, n=VOLi×TIVm /TIVi where VOLi, n is the normalised volume of a subject, VOLi, n is the non-normalised volume, and TIVm is the mean TIV of all subjects.
STATISTICS
Statistical analysis was guided by a statistician and was performed using S-Plus software (Mathsoft Inc, Seattle, USA). Group effects of ERC and hippocampus adjusted by age and sex were tested using analysis of variance (ANOVA). Percent volume loss of the ERC and hippocampus within MCI and AD groups were compared using pairedt test. Our a priori hypothesis of differences between the groups in ERC and hippocampal volumes was tested using α=0.05 as level of significance. By contrast, other hypotheses about differences between groups in segmentation measures (which were not a priori) were tested using an adjusted α level of 0.05/6≈0.01 to account for the six comparisons using segmentation data. Pearson correlation coefficients were used to analyze the correlation between volumes of the ERC, hippocampus, segmented structures, and MMSE in each group. Only subjects who had complete ERC and hippocampal volumetry and tissue segmentation were included for classification analysis. The powers of the ERC and hippocampus for group classification were tested using logistic regression analysis, followed by McNemar's χ2statistics to verify whether the differences were significant, and receiver operator characteristics (ROC) analysis. Stepwise logistic regression analysis was used to test combinations of the ERC, hippocampus, and segmentation measures for the power to discriminate between the groups.
Results
DEMOGRAPHICS
Table 1 shows that all groups were well matched according to age (F=0.14, p=0.87) and sex (χ2=0.18, p=0.91). The MMSE score of patients with AD (17.7 (SD 5.7) was significantly lower than that of patients with MCI (25.8 (SD 3.6) (p<0.001) and those with NC (29.0 (SD 0.9) (p<0.001), and the MMSE score of patients with MCI was significantly lower than that of patients with NC (p<0.001).
Demographics
ERC AND HIPPOCAMPAL VOLUMES
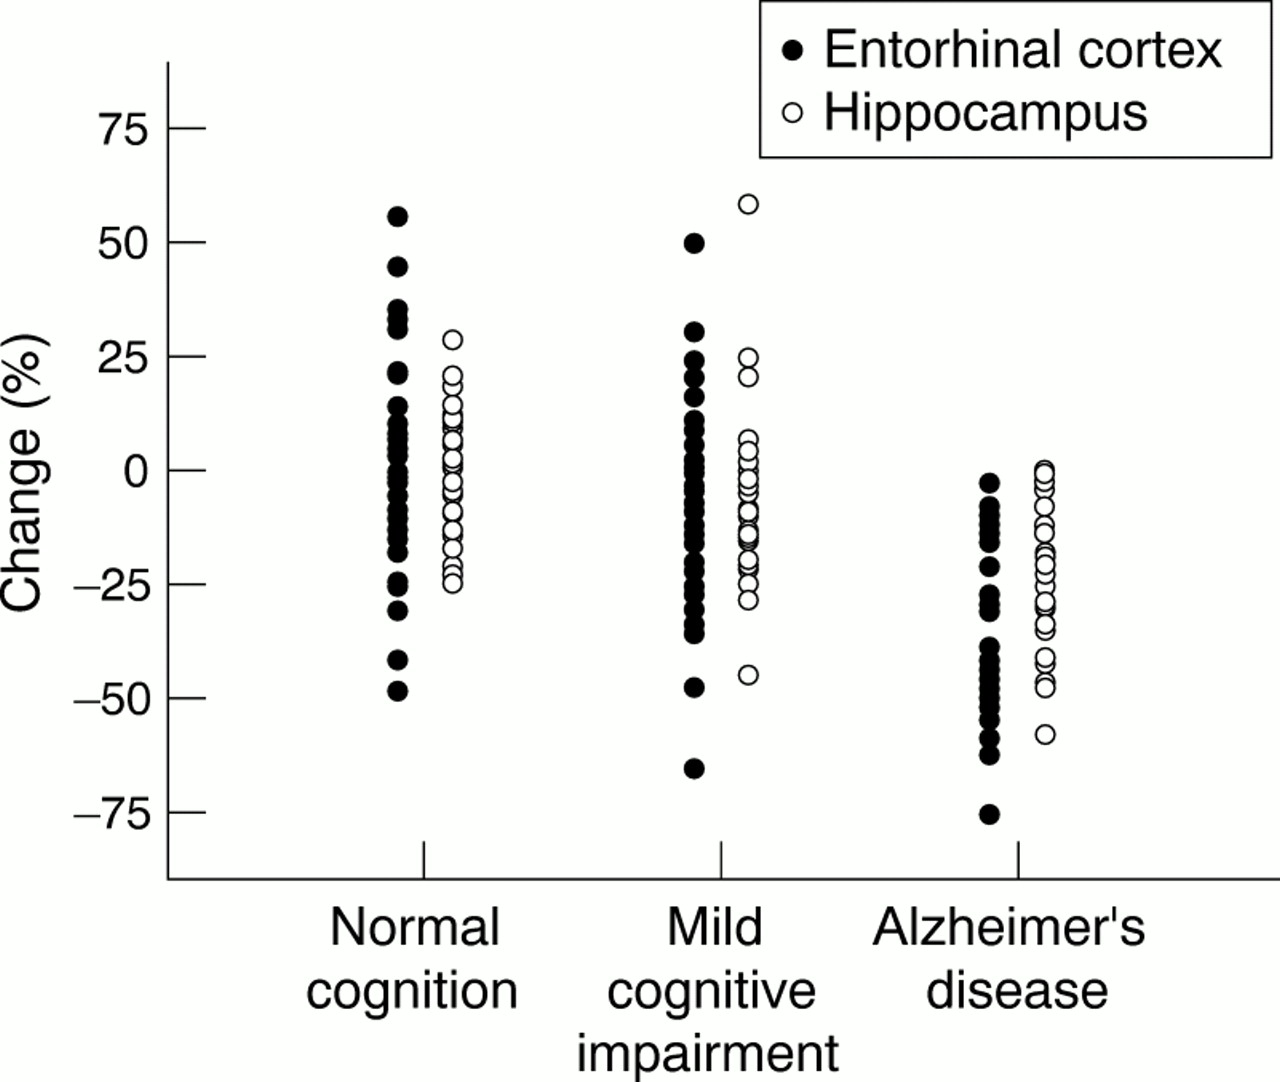
Figure 2 shows the percentage changes of total ERC and hippocampal volumes for all subjects relative to mean volumes of NC, demonstrating the prominent ERC volume losses in AD. Table 2 shows volumes of the ERC and hippocampus in NC, MCI, and AD groups. Total ERC volume of patients with NC was 2726 (SD 608) mm3. This was significantly reduced by 13% to 2385 (SD 632) mm3 in patients with MCI (F=4.6, p<0.05) and by 39 % to 1662 (SD 501) mm3 in patients with AD (F=58.9, p<0.01). When AD was compared with MCI, the ERC was 30% significantly smaller in AD (F=29.1, p<0.01). Total hippocampal volume of patients with NC was 6327 (SD 799) mm3. This was significantly reduced by 11% to 5657 (SD 864) mm3 in patients with MCI (F=6.8, p<0.05) and 27% to 4595 (SD 1009) mm3 in those with AD (F=63.2, p<0.01). When AD was compared with MCI, hippocampus was 19% significantly smaller in AD (F=18.9, p<0.01). Furthermore, when AD was compared with NC, 39% reduction of the ERC was significantly greater than 27% reduction of hippocampus (paired ttest, p=0.01). However, when MCI was compared with NC, 13% reduction of the ERC was not significantly different from 11% hippocampal reduction in MCI (paired t test, p>0.05). In addition, when patients with AD were compared with those with MCI, 30% reduction of the ERC was significantly greater than the 19% reduction of the hippocampus (paired t test, p<0.05). There was no significant group by side interaction neither for ERC volume changes (F=0.07, p=0.93, ANOVA) nor for hippocampal volume changes (F=0.12, p=0.89, ANOVA), providing no evidence for a laterality effect in ERC and hippocampal atrophy.

Percentage changes from the normal mean volumes of entorhinal cortex and hippocampus in normal cognition, mild cognitive impairment, and Alzheimer's disease. This figure shows that the most severe volume loss is the entorhinal cortex in Alzheimer's disease.
Volumes (mean (SD)) of entorhinal cortex and hippocampus
BRAIN SEGMENTATION
Table 3 shows that patients with MCI had significant cGM losses (F=10.8, p<0.01), vCSF enlargement (F=5.3, p<0.01), and WMSH increases (F=7.0, p<0.01) when compared with subjects with NC. As expected, compared with the NC group, the AD group had significant cGM loss (F=33.7, p<0.01), WM reduction (F=16.2, p<0.01), sCSF enlargement (F=25.6, p<0.01), and vCSF enlargement (F=21.2, p<0.01). In addition, when the AD group was compared with the MCI group, there were cGM and WM losses, and sCSF and vCSF increases; however, only WM reduction was significant (F=9.7, p<0.01).
Segmentation data
CORRELATION
Figure 3 shows the correlation of ERC and hippocampal volumes in MCI and AD. There was significant correlation between the ERC and hippocampus in MCI (r=0.66, p<0.001) and AD (r=0.68, p<0.001). However, there was no significant correlation between the ERC and hippocampus in NC (r=0.25, p=0.28).

Correlation between entorhinal cortex and hippocampal volumes in mild cognitive impairment and Alzheimer's disease.
When all subjects were combined, there was a significant correlation between MMSE and the ERC (r=0.48, p<0.001), and MMSE and hippocampus (r=0.48, p<0.001), as shown in figure 4. However, there was no significant correlation between MMSE and the ERC, and MMSE and hippocampus in any of the individual groups. When correlation was performed among the ERC, hippocampus, and segmentation data, only the hippocampus and cGM (p<0.05) in NC and the ERC and cGM in MCI (p<0.05) were correlated.

Correlation of mini mental state examination with the entorhinal cortex and with the hippocampus in the whole group.
CLASSIFICATION, SENSITIVITY, AND SPECIFICITY ANALYSIS
To compare the ERC and hippocampal volumes for their power to distinguish NC, MCI, and AD, logistic regression analysis was used to predict group memberships either with the ERC or hippocampus as independent variables. The overall classification between MCI and NC was 66% with the ERC and 70% with the hippocampus. The classification with the hippocampus was significantly better than with the ERC (p<0.05, McNemar). The overall classification between AD and NC was 83% with the ERC and 86% with hippocampus. In this case, however, the difference between the ERC and hippocampus was not significant (p>0.05, McNemar), implying that the discriminatory powers of the ERC and hippocampus were comparable. Finally, the overall classification between AD and MCI was 74% with the ERC and 72% with hippocampus and classification with the ERC was better than with hippocampus (p<0.05, McNemar).
To compare sensitivity and specificity between the ERC and hippocampus for group classification, ROC analysis was performed. Discriminating between MCI and NC, the area under the curve (AUC) of the ROC was 0.64 with the ERC and 0.71 with the hippocampus. Discriminating between AD and NC, AUC was 0.92 with the ERC and 0.91 with the hippocampus. Finally, discriminating between AD and MCI, AUC was 0.83 with the ERC and 0.79 with the hippocampus.
Finally, we employed stepwise logistic regression analysis to explore combinations of the ERC, hippocampus, and segmentation measurements for their powers to discriminate between the groups. Firstly, the hippocampus was added to the regression model, then the ERC was added to test whether the ERC significantly contributed to the discrimination, finally, segmented structures were added to test which segmented structure significantly contributed to the discrimination. The results are listed in table 4. Mild cognitive impairment and NC were classified with 52% sensitivity, 79% specificity, and an overall classification of 70% using the hippocampus (p<0.01) alone in the stepwise logistic regression model. Adding the ERC to the model did not improve classification (p=0.31). Finally, when segmentation data were added to the model, cGM (p<0.05) significantly contributed to the discrimination and increased sensitivity to 59%, specificity to 82%, and overall classification to 77%. AD and NC were classified with 78% sensitivity, 90% specificity, and an overall classification of 86% using the hippocampus (p<0.01) alone. Adding the ERC (p<0.01) significantly increased sensitivity to 78%, specificity to 92%, and overall classification to 89%. Finally, when segmentation data were added to the model, cGM (p<0.05) further improved sensitivity to 93%, specificity to 95%, and overall classification to 94%. Finally, AD and MCI were classified with 74% sensitivity, 70% specificity, and an overall classification of 72% using the hippocampus (p<0.01) alone. Adding the ERC to the model, the ERC significantly contributed to the discrimination, and increased sensitivity to 81%, specificity to 85%, and overall classification to 83%. Finally, when segmentation data were added to the model, no segmented structure contributed to the discrimination between AD and MCI.
Discrimination by volumes of entorhinal cortex and hippocampus and segmentation data
Discussion
The major findings of this study were (1) the ERC and hippocampal volumes were significantly reduced in MCI compared with NC. The magnitude of ERC atrophy was similar to that of hippocampal atrophy in MCI. (2) The ERC volume losses were greater than hippocampal volume losses in AD compared with NC. (3) There was significant volume loss in the ERC and hippocampus in AD compared with MCI. (4) There was significant correlation between the ERC and hippocampus in MCI and AD, not in NC. (5) Finally, the classifications between MCI versus NC, and AD versus NC were improved when segmentation data were added to the hippocampus. However, adding the ERC was only useful to improve the classification between AD and NC.
ERC AND HIPPOCAMPUS IN MCI COMPARED WITH NC
The first major finding of this study was that the ERC and hippocampal volume was significantly reduced in MCI compared with NC. Patients with MCI are generally considered to represent a non-demented group with a high likelihood of progressing to AD. Previous studies have shown that the ERC and hippocampus were significantly reduced in MCI compared with NC.19 22 23 26 However, the discriminatory power of the ERC reported before between MCI and NC was quite different. Xu et al reported that overall classification with the ERC between MCI and NC was less than 70%,19 however, Killiany et alreported that overall classification between MCI and NC with the ERC was more than 85%.26 Our study confirmed that the ERC and hippocampus were significantly reduced in MCI compared with NC. In addition, we also showed that reductions of the ERC and hippocampus were of similar magnitude and no trend of laterality of the ERC and hippocampal atrophy in MCI existed. However, there remains a considerable overlap in both ERC and hippocampal volume between MCI and NC. Furthermore, an overall classification of 70% between MCI and NC is moderate given that 50% classification can be achieved by chance. Both McNemar's test and logistic regression showed that the hippocampus was better than the ERC to distinguish MCI from NC and even adding the ERC to the hippocampus did not improve classification. This suggests that the ERC offers no advantage over the hippocampus in differentiating MCI from NC.
COMPARISON OF THE ERC AND HIPPOCAMPUS IN AD AND NC
The second major finding of this study was that there was significantly greater volume loss of the ERC than the hippocampus in AD compared with NC. Many brain structures, including the frontal lobe, parietal lobe, temporal lobe,30-32 hippocampus, ERC, and amygdala have been measured using MRI in AD.4-18 In general, the limbic structures of the hippocampus, ERC, and amygdala have shown the greatest changes. However, there has been considerable disagreement concerning the changes of the ERC and hippocampus in AD.4 12 18 19 These differences probably resulted from different measured methods and different subjects. Our results show that ERC changes in AD were significantly larger than hippocampal changes. However, larger ERC changes may not be superior to hippocampal changes for the classification of AD from NC, because the variability in measurement of the ERC is larger than that of the hippocampus. This is further substantiated by McNemar's tests, which showed no significant difference between the ERC and hippocampus for discriminating AD from NC. However, the classification between AD and NC was significantly improved after the ERC and hippocampus were combined, implying that the ERC is a useful marker to distinguish AD from NC.
COMPARISON OF ERC AND HIPPOCAMPUS IN AD AND MCI
The third major finding of this study was that there was significant reduction of the ERC and hippocampus in AD when compared with MCI. Our study showed that there was a 30% reduction of the ERC and 19% reduction of the hippocampus in AD compared with MCI. Both the ERC and the hippocampus could distinguish MCI from AD. This is consistent with previous studies.19 25 Furthermore, the ERC had greater volume losses than the hippocampus in AD compared with MCI. Discrimination analysis also showed that the ERC had greater discrimination power than the hippocampus in separating AD and MCI. This was not consistent with the finding of Xu et al that the ERC and hippocampus had equivalent power to distinguish AD from MCI.19
SEGMENTATION IN NC, MCI, AND AD
There was significant cGM loss and vCSF enlargement in both MCI and AD compared with NC. These findings were consistent with a previous study.15 The MRI findings indicate that patients with MCI had similar, but less severe, global cerebral changes (as measured by tissue segmentation) as well as focal cerebral changes (as determined by manual volume measurement of the ERC and hippocampus) than AD, implying that the pathological process underlying MCI and AD are similar but with different severity.
CORRELATION OF THE ERC AND HIPPOCAMPUS IN NC, MCI, AND AD
The fourth major finding was that there were similar significant correlations between the ERC and hippocampus in MCI and AD, but not in NC. Necropsy studies of brains from patients with AD implied early pathology in the ERC with progression to the hippocampus.3The conversion rate of MCI to AD has been reported to be 12% in 1 year and 19.5% in 2.7 years.27 33 The significant correlation of the ERC and hippocampus in MCI and AD is consistent with the view that AD pathology affects both these structures in parallel in MCI and AD. Recent reports suggested that hippocampal volume changes may help to predict MCI conversion to AD,24 25 but we have no data on this matter in this cross sectional study.
CLASSIFICATION OF GROUPS BY ERC, HIPPOCAMPUS, AND SEGMENTATION
The fifth major finding was that the classifications between MCI versus NC, and AD versus NC were improved after combination of hippocampal volumes with segmentation data, whereas the ERC only contributed to the classification between AD and NC. This suggests that combinations of different brain morphological changes assist classification between groups of NC, MCI, and AD. However, 100% discrimination between the groups could not be achieved, as reported previously.34-36
This study had several limitations. Firstly, the patients with AD and those with MCI were not followed up to postmortem, so that a pathological diagnosis could not be made. Secondly, patients with MCI were not followed up longitudinally to test whether they ultimately developed AD. Finally, volume change may be not a specific marker of neuronal degeneration. Measurement of metabolic changes, especially the neuron specific amino acid N-acetyl aspartate using MR spectroscopy or spectroscopic imaging,11 37-39 or functional changes such as perfusion or diffusion may further improve the diagnosis of MCI or AD.40-42
In conclusion, the ERC did not help the hippocampus to distinguish MCI from NC. However, the ERC was a better marker than the hippocampus in distinguishing AD from MCI and similar to the hippocampus in distinguishing AD from NC. Classifications between MCI and NC, and AD and NC were improved after the ERC and hippocampus were combined with brain tissue segmentation data.
Acknowledgments
This work was supported in part by NIH grants AG10897, AG12435, the Alzheimer's Association, and Research Council for Health of the Academy of Finland. We gratefully acknowledge statistical assistance from Dr Peter Bachetti and segmentation assistance from Ms Mary Beth Kedzior.
References
Linked Articles
- Editorial commentary