Article Text

Abstract
OBJECTIVES The accuracy of magnetic resonance angiography (MRA) was determined in patients with recently symptomatic tight (80%–99%) carotid stenosis (on Doppler ultrasound), and the effect of stenosis severity on the accuracy and interobserver variability of MRA was studied.
METHODS Forty four consecutive patients undergoing intra-arterial angiography (IAA) before carotid endarterectomy were prospectively studied, in two centres with identical MR scanners and sequences. All patients had undergone Doppler ultrasound, showing a 70% or worse carotid stenosis on the symptomatic side. MRA and IAA were done during the same admission. The MRA films were each independently and blindly read for percentage stenosis (signal gap if present) by four observers. The IA angiograms were read separately by one observer, blind to symptoms, and Doppler and MRA results.
RESULTS Signal gaps on MRA were seen in stenoses ranging from 67% to 99% on intra-arterial angiography. Magnetic resonance angiograms consistently overestimated the percentage stenosis according to intra-arterial angiography. Clinically significant misclassification of stenosis occurred according to MRA in 7% of patients, and was more frequent as carotid stenosis increased.
CONCLUSION Significant diagnostic errors occur with MRA in patients with tight carotid stenosis. Any morbidity occurring as a result of misclassification by MRA is likely to be offset by the avoidance of complications; however, this could only be determined with certainty in a randomised controlled trial.
- magnetic resonance angiography
- digital subtraction
- carotid stenosis
- endarterectomy
Statistics from Altmetric.com
Carotid endarterectomy is most effective in reducing the risk of ischaemic stroke only in patients with recent symptomatic and severe carotid stenosis. Therefore, it is crucial that any imaging strategy can distinguish more than 80% stenosis from lesser degrees of stenosis or occlusion.1 The gold standard is intra-arterial angiography,1 but as this carries a 1% risk of a permanently disabling stroke in patients with symptomatic but mild ischaemic cerebrovascular disease,2 and is higher with tighter degrees of stenosis, great efforts have been made to find an alternative imaging strategy. Magnetic resonance angiography (MRA) is one such alternative and is increasingly used to evaluate carotid stenosis, in combination with Doppler ultrasound, to confirm the degree of stenosis before carotid endarterectomy.3
Magnetic resonance angiography and conventional angiography image different features, one being flow based (MRA) and the other anatomical. Thus, although the two techniques could not be expected to concur perfectly, numerous studies have found MRA to be reasonably sensitive and specific compared with conventional intra-arterial angiography.4 However, most studies included relatively few patients with severe carotid stenosis,5 and used a population with few tight symptomatic stenoses, so firstly may have overestimated accuracy, and secondly the results are not generalisable to populations where most patients have a tight stenosis. Therefore, as Doppler ultrasound is used in most hospitals now to exclude patients with normal arteries and moderate stenoses, reserving MRA for a confirmatory test, it is important that the accuracy of MRA is determined in a population who all have at least one tight symptomatic stenosis. Furthermore, no studies have specifically looked at the effect of severity of stenosis on the accuracy of MRA. Therefore, we compared MRA and intra-arterial angiograms, to see what effect the degree of stenosis might have on the accuracy of reporting of MRA.
Methods
We conducted a prospective study in consecutive patients referred for intra-arterial angiography as part of the investigation of symptomatic carotid stenosis, before referral for carotid endarterectomy, in two centres. All patients were routine referrals to a regional neurovascular service; had recent amaurosis fugax, hemispheric transient ischaemic attack, or minor carotid territory ischaemic stroke; had already undergone colour Doppler ultrasound which had shown a carotid stenosis of about 70% or worse on the symptomatic side; and were prepared to consider having a carotid endarterectomy after intra-arterial angiography had confirmed the tight stenosis. These patients underwent MRA (during the admission for intra-arterial angiography). There was no upper age limit or other specific inclusion or exclusion criteria, except that patients with standard contraindications to MR were excluded.
MRA TECHNIQUE
The MRA examinations were performed on a Siemens 1.5T SP Magnetom (Siemens, Erlangen, Germany), using a neck coil. A 2 D time of flight (TOF) acquisition was used first (TR 27 ms, TE 9 ms, flip angle 35º, 3 mm slice thickness, 54 slices, distance factor 0.4, FOV 230, matrix 160×256, one acquisition time 4.49 minutes) followed by a 3 D TOF sequence (TR 30, TE 6, flip angle 20º, 1 mm slice thickness, contiguous, 64 partitions, other factors the same), positioned to include the carotid bifurcation and as much of the arteries above and below as possible. The acquired axial images were reconstructed using the maximum intensity projection (MIP) method, and printed ontox ray film. Thus for each patient, there was a set of 2 D and 3 D MIP images for both sides of the neck. We did not examine the raw axial images as it is common to print and review only the MIP images to reduce film costs and due to lack of workstations in film based departments. However, introduction of filmless radiology departments will make routine viewing of axial raw images much easier.
MEASUREMENT OF CAROTID STENOSIS
The MIP image films were each read by four observers blind to all other information except that the patients had symptomatic carotid disease. They were not told which side was symptomatic. The maximum percentage stenosis was determined by calculating the ratio of the minimum lumenal diameter (usually near the origin of the internal carotid artery) to the common carotid artery diameter (where the common carotid artery walls were parallel; the common carotid artery method).6 The common carotid artery method was used as it is more reproducible and less prone to error than the NASCET (distal internal carotid artery collapse) or ECST (guessing outline of bulb) methods in extensive tests on intra-arterial angiograms. Both diameters were measured with calipers viewed through a magnifying eyepiece. If the arterial walls at the point of maximum stenosis were not visible because of a signal gap, then a signal gap was noted in place of a precise stenosis reading. Signal gaps were distinguished from occlusions by looking for evidence of flow beyond the point where the signal gap was. The actual image used for the measurement, the presence of common carotid and distal internal carotid disease, and the general quality of the images were also noted.
THE OBSERVERS
Two neurologists and two neuroradiologists read all the MRA scans independently and blindly.
INTRA-ARTERIAL ANGIOGRAMS
Digital intra-arterial angiography was done via the femoral route, with selective common carotid artery injection of 5 ml non-ionic contrast/view and three views obtained of each carotid bifurcation (lateral and two 45° obliques). The intra-arterial angiograms were read separately from the MRAs to determine the reference standard degree of stenosis for comparison with MR angiography. They were read by one observer, who was blind to symptoms and MRA results, using the common carotid artery method for calculating the stenosis. A second observer subsequently read the intra-arterial angiograms, blind to the results of the first observer and all other clinical and imaging data, to examine the interobserver variability of intra-arterial angiography.
ANALYSES
As we were interested in the effect of using MRA instead of conventional angiography in symptomatic carotid stenosis, in the first analyses, only symptomatic arteries were analysed (an artery was chosen at random for patients with symptoms on both sides). The percentage stenosis according to intra-arterial angiography at which signal gaps occurred on MR angiography was determined. Symptomatic arteries were considered operable if an imaging technique showed an 80%–99% stenosis. Percentages of correct diagnoses (where MRA agreed with intra-arterial angiography that arteries were operable or inoperable), unnecessary operations ( false positive rate), missed operations (100−sensitivity), and clinically significant errors were calculated. The clinically significant errors (for example, mistaking a tight stenosis for an occlusion on MRA, potentially leading to an alteration in clinical management) were identified from among the diagnoses where there was a discrepancy between MRA and intra-arterial angiography by a neuroradiologist.
In the second analysis, we examined how the accuracy and interobserver variability of MRA varied across the range of severity of stenosis. To do this, we added the asymptomatic arteries back into the analysis to increase the numbers of minor stenoses. Graphs examining the interobserver variability of MRA and its accuracy compared with intra-arterial angiography were plotted.
Results
Forty four patients had their MR angiograms read by all four observers. Twenty three patients had symptoms on the left side, 19 on the right side, and two on both sides. For the initial analysis, one side was chosen at random for analysis for the two patients with symptoms on both sides (one right side and one left side were chosen). Thus, data from 44 symptomatic arteries from 44 individual patients were analysed. One of the observers considered two of the patients' images to be of too poor quality for anything to be measured. The other three observers read scans from all 44 patients.
The proportion of signal gaps seen by the observers ranged from 27% to 50%. All four observers agreed that there was no signal gap in 20 (45%) patients, and that there was a signal gap in 11 (25%) patients (definite signal gap group). In one patient three observers saw no signal gap, but the fourth observer considered the image to be of too poor quality to tell anything. In the remaining 12 patients (27%) there was disagreement (possible signal gap group). The intra-arterial angiogram readings for these groups are given in figure 1. This shows that definite signal gaps occurred in stenoses ranging from 74% to 99%, with a mean value of 90% on the corresponding intra-arterial angiogram. The patients with possible signal gaps had stenoses ranging from 67% to 96%, with a mean of 86%. The remaining patients, in whom there were definitely no signal gaps, had stenoses ranging from 0% to 100% but with no stenoses of 81%–99%. From a one way analysis of variance (ANOVA), there was a significant difference in the percentage stenosis between the three groups (p=0.01).
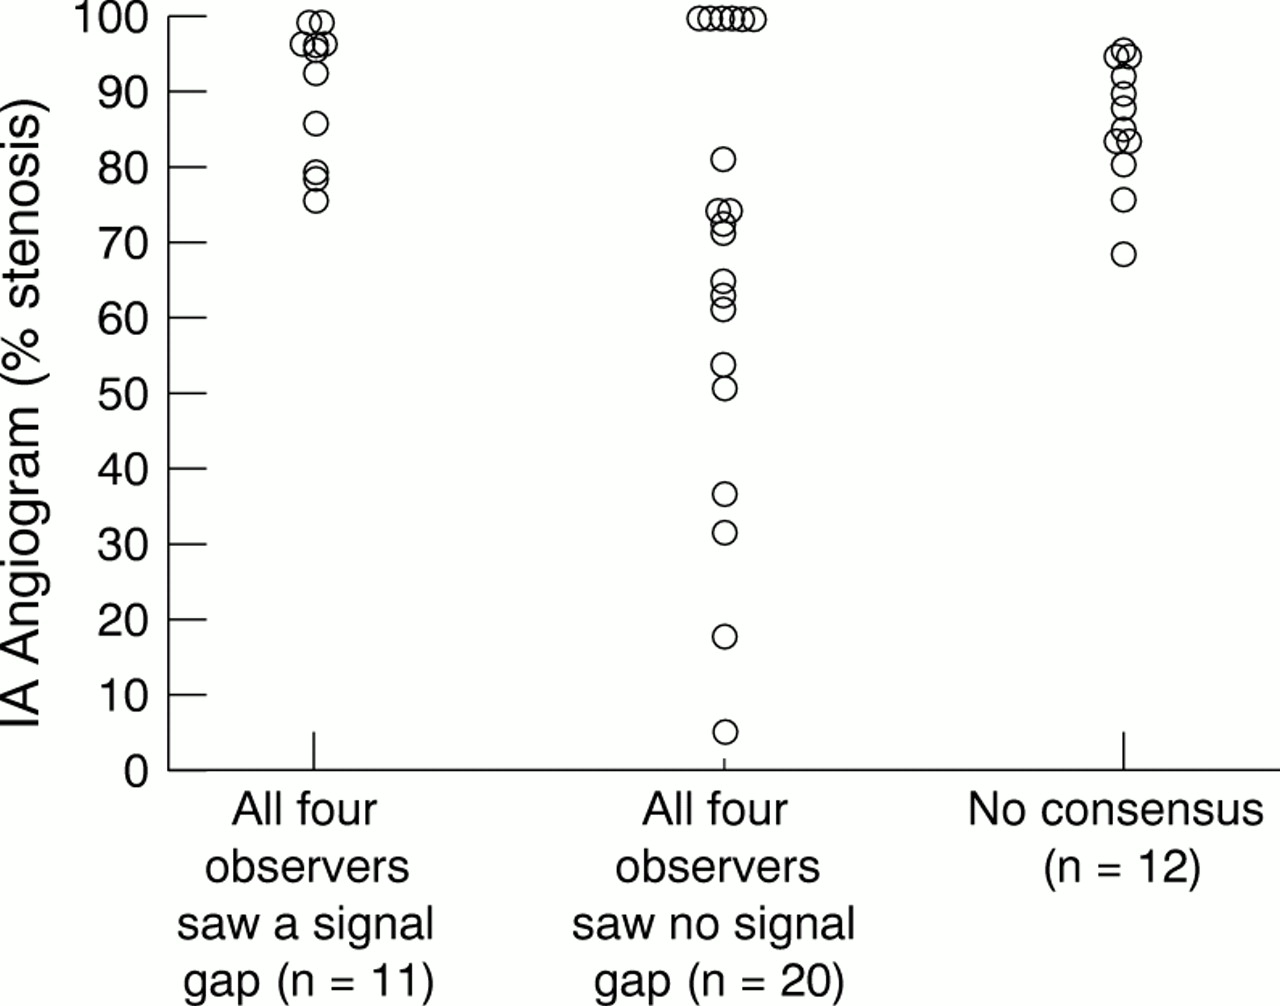
Intra-arterial angiogram (IA) readings grouped by whether the four observers all saw a signal gap, all saw no signal gap, or disagreed on the presence of a signal gap (no concensus).
Three of the 11 definite signal gaps and two of the 12 possible signal gaps were not in the operable range (they were outside 80%–99%). However, the three definite signal gaps had stenoses very close to the operable range (74%, 77%, 78%) and thus it would not be disastrous if such patients were operated on. The two patients with possible signal gaps had stenoses of 67% and 75%, again not very far from the operable range. The 67% stenosis was only thought to be a signal gap by one of the four observers and the 75% stenosis was thought to be a signal gap by three of the four observers. Thus if all signal gaps were assumed to be operable, very few clinically significant errors would be made.
The possible signal gap group varied in the percentage stenosis that the remaining observers saw on MRA. For six of these patients, the observers who did not see a signal gap identified percentage stenoses very close to the intra-arterial angiogram value. In the remaining six patients (14% of all patients examined) clinically important errors would have occurred.
The percentages of correct diagnoses, unnecessary operations, missed operations, and clinically significant errors are shown in table 1. Figure 2 shows the intra-arterial angiogram readings plotted against the MR angiogram readings for the symptomatic artery for each of the four observers, with the diagonal line showing equality, and vertical and horizontal lines showing the 80% stenosis cut off for referral for carotid endarterectomy. All signal gaps on MR were assumed to represent 90% stenoses as this was the mean value on intra-arterial angiography for the definite signal gap group. It can be seen that MR angiograms consistently overestimated the percentage stenosis, which has been noted before.7 The 3 D, but not the 2 D, MR angiograms for two patients had been mislabelled by the radiographer who undertook the MR examination, performed the MIP analysis, and printed the films. Three of the observers used the 2 D angiograms, but observer 1 used the 3 D angiograms and did not notice that they were the wrong way round. However, if only presented with printed MIP images, such an error could readily occur in day to day practice. These two points can be seen in the bottom right hand corner of the plot for observer 1 within figure2. In addition, there will have been errors in the IA angiogram readings. One patient had an intra-arterial angiogram of 59%, and three of the four observers had MR readings that were clinically significantly different from this value. A second independent reading of the angiogram gave a value of 78%, which was not clinically significantly different from the three observers' MR readings. However, when all patients' angiograms were read independently and blindly by a second observer, there were no clinically significant differences between the two observers' values (fig2).
Percentages of correct diagnoses, unnecessary operations, missed operations, and clinically significant errors (assuming arteries with 80%–99% stenosis on the symptomatic side are operable)
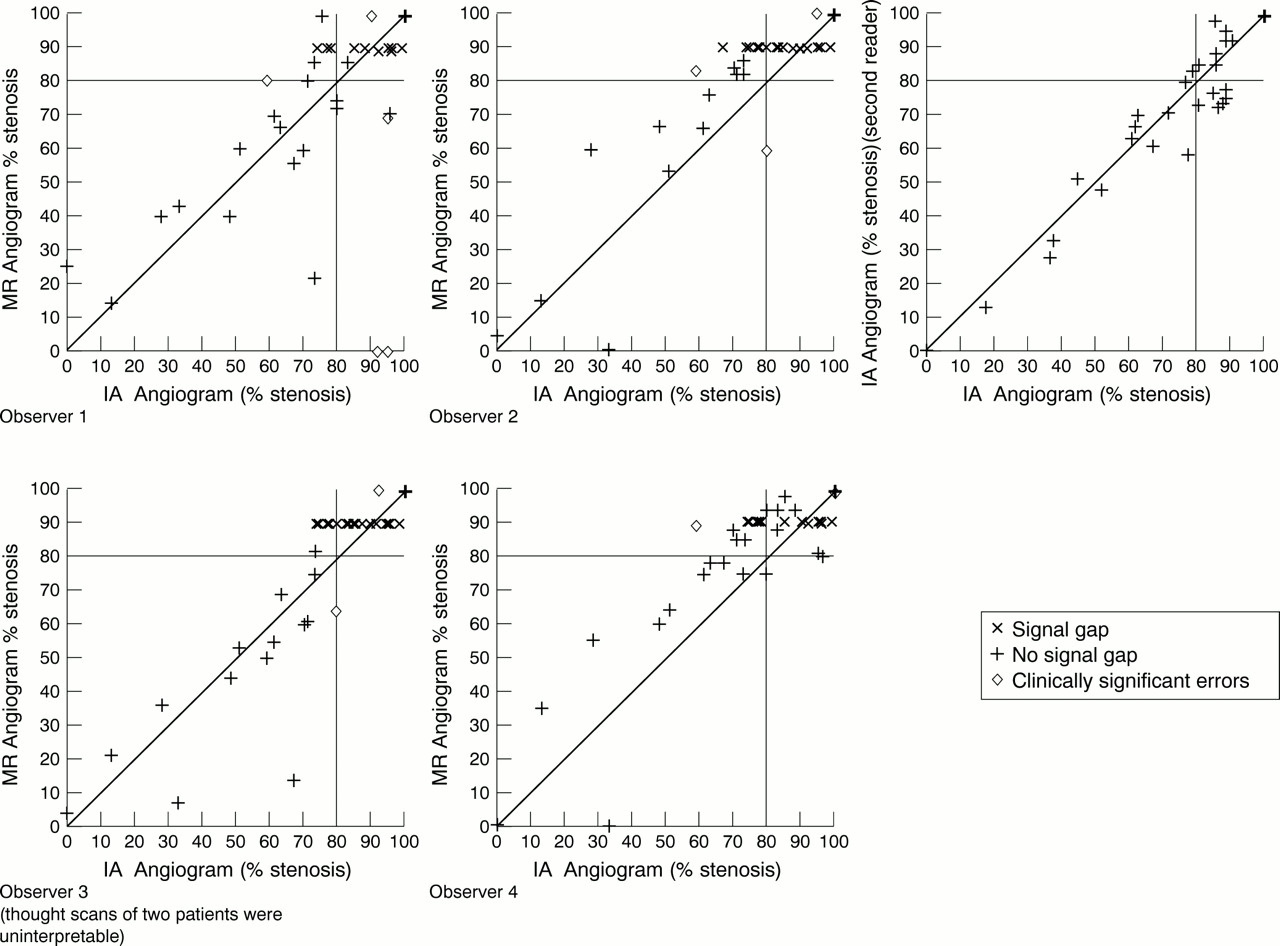
Intra-arterial angiogram (IA) readings plotted against MR angiogram readings for each of the four observers for symptomatic arteries only
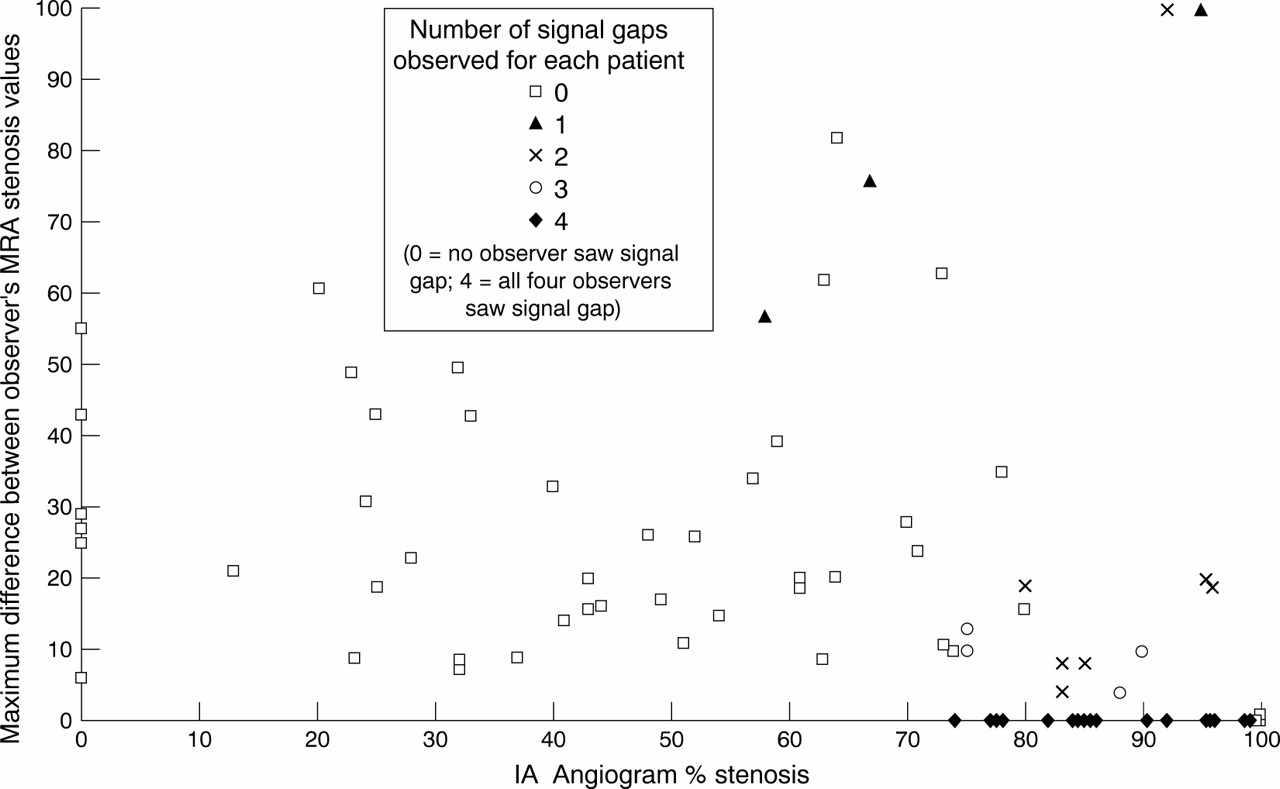
Figure 3 shows the maximum interbserver difference (the highest of the four readings minus the lowest of the four readings/patient) for MRA for each patient plotted against the intra-arterial angiogram stenosis values for all arteries, symptomatic and asymptomatic. This shows considerable interobserver variability. As the points in the top right of the diagram were caused by mistakenly swapping left and right, there seems not to be a trend for increased interobserver variability at higher stenosis values. However, as zero differences occurred where all four observers saw a signal gap (marked with darker symbols), all interobserver variability was effectively removed. Thus, where there was a high proportion of signal gaps, the interobserver variability seemed to decrease, although the greatest proportion of clinically significant errors, and images judged to be uninterpretable, occurred in the tight stenosis/occlusion range (fig 2).

Maximum interobserver differences in % stenosis from MR for each patient, plotted against intra-arterial angiogram readings for each of the four observers for symptomatic and asymptomatic arteries (for each patient, the greatest difference between any two of the four observers is plotted).
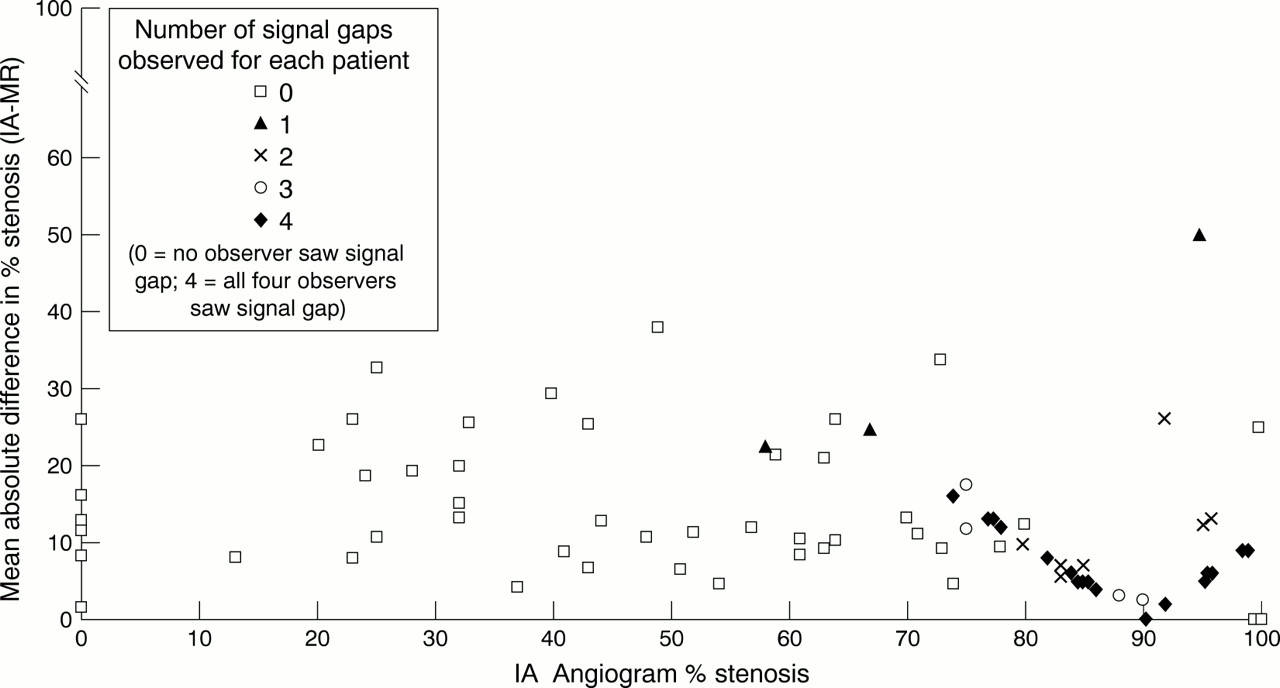
Figure 4 shows the absolute difference in percentage stenosis between intra-arterial angiography and MRA, averaged over the four observers for each patient, and plotted against the intra-arterial angiogram percentage stenosis. This illustrates the consistent overestimation of percentage stenosis by MRA, as most points lie above rather than on the x axis. Also, although the two axes of this plot are dependent, and the points would be expected to form a v shape, again the signal gaps have the effect of apparently improving the MRA accuracy. However, this is misleading because the scatter is still wide in the 80%–99% stenosis range, and in any case, the scope for disagreement reduces towards 100% stenosis with this type of plot.
Absolute difference in percentage stenosis between IA and MR, using the average of the four observers for each patient, plotted against the IA angiogram percentage stenosis.
Figures 3 and 4 show that the presence of signal gaps decreases interobserver variability and increases accuracy between, say, 78% and 85%. However, this should not provide false reassurance as, in addition to the comments above, it can be seen in figure 2 that the greatest proportion of significant errors is in the tight stenosis/occlusion range.
Discussion
The percentage stenosis on intra-arterial angiography for the MR angiograms with signal gaps was consistent with the findings of Heiserman et al.7 Magnetic resonance angiography measurements are most consistent between observers in the range of 75% to 85% stenosis, but only if signal voids are seen. The four observers agreed on the presence on signal gaps in some but not all patients. The patients for whom there was disagreement on the presence of a signal gap were more likely to have milder stenosis. A signal gap can be artefactual—for example, if the internal carotid artery is tortuous but not stenosed. Signal gaps should be viewed cautiously rather than automatically classifying them as tight stenoses. If in doubt, review by a second blinded viewer should make the diagnosis more reliable.
The design of studies to assess diagnostic tests should take into account that test performance may be affected by the population of patients with the disease of concern in the test population and ensure that there is the correct proportion of these patients to get a generalisable estimate of test performance.8 Tables of percentages of unnecessary operations and missed operations have been presented. However, in this situation the results depend heavily on the distribution of stenosis among the patients studied. For example, if the data happened to include predominantly patients with either very mild disease or very severe disease, it is unlikely that there would be many disagreements concerning the 80% cut off. Alternatively, if many patients happened to have a high degree of stenosis around the 80% mark it would be expected that there would be many disagreements, regardless of which kind of angiogram is performed.
Intra-arterial angiography is not actually a true gold standard, as observer variability occurs. Thus some of the apparent errors in the MRA may not actually be errors at all, but may reflect where intra-arterial angiography got it wrong. We will never know the true answer. Invasive angiography may result in 3%–6% of patients being misclassified between stenosis categories.9
We used only the MIP processed images printed onto film to determine the percentage stenosis. There were too many source axial images to print out as well as the processed images (this would have doubled the number of films) and it would have been impractical to review all images on a workstation as they take up too much space in the computer and it takes longer to review the images this way. In normal circumstances the source images only remain on the MR workstation for about 24 hours before being removed to make room for new patients. Reviewing the source images on a workstation platform is increasingly feasible as PACS systems are introduced and is considered more accurate than review of hard copy film images, as “stacks” of images can be reviewed with optimal image alignment to determine where an internal carotid artery becomes visible again above a signal void. Two small studies have shown that the source images increase accuracy,10 11 and in particular seem to reduce the tendency for MRA to overestimate the degree of stenosis. However, examining the source images is time consuming for the radiologist, and depends on the availability and computing power of a dedicated workstation, and in many centres these are still not widely available. In addition, in busy radiology departments it is more common to print the MIP images only (cost of film precludes printing of all source images), and as reporting may not be done until the next day, by which time the data have been removed from the workstation, source image review may be impractical. In several United Kingdom centres that we know of in addition to our own, the printing of source images is considered prohibitively expensive.
High sensitivities and specificities have been reported4in previous studies that assessed the accuracy of MRA in comparison with conventional angiography. However, often these studies excluded patients with poor quality images, did not define their study population, or tested MRA in a population with few diseased carotid arteries. We included all our MRA examinations, and examined a typical population of patients referred to a regional neurovascular service all of whom had at least one symptomatic tightly stenosed carotid artery. In addition, these patients with symptomatic cerebrovascular disease often had concomitant myocardial or respiratory disease, became breathless easily, or found it difficult to lie flat, resulting in a high incidence of coughing or swallowing artefact impairing the quality of the MIP images (which would affect the source data also).
We suggest that the 7% of clinically significant inaccuracies in this study are likely to be a true reflection of the limitations of MRA in a population with severe symptomatic ischaemic cerebrovascular disease screened by Doppler ultrasound. Although including review of source images and examination of the circle of Willis might improve accuracy, this adds significantly to the duration of the examination and radiologist reporting time, and requires ready access to a workstation or trebling of the number of films. These measures require further evaluation to determine whether they add to, or improve significantly, the accuracy of MRA before being adopted, as there is a considerable cost implication to this.
The 7% of clinically significant errors with MRA has to be weighed against the 1% risk of death and 2% risk of stroke associated with intra-arterial angiography,12 as not all of the 7% will have a bad outcome caused by the wrong decision. In ECST,1carotid endarterectomy reduced the frequency of major stroke or death at 3 years from 26.5% to 14.9% in the 80%–99% stenosis group. Carotid endarterectomy itself is associated with about a 7% risk of death or disability. For the inaccuracies of MRA to cause as many adverse effects as the invasiveness of intra-arterial angiography, 14% of misdiagnosed patients would have to die and 29% have major stroke. This is clearly improbable and thus overall, MRA is probably safer than intra-arterial angiography. However, the only way to find the best imaging procedure definitively would be to perform a randomised clinical trial.
Increasing concern about the risks of angiography and improvements in non-invasive imaging mean that it is increasingly difficult to justify the risk and delay of conventional angiography if the benefit in accuracy is marginal. The choice of non-invasive tests may depend on local preferences, machine availability, and staff training. Ultrasound is likely to remain the initial diagnostic test for carotid stenosis. It is possible that a second ultrasound examination, blind to the result of the first would be as accurate, as rapid, and certainly less expensive, than either CTA or MRA. Further study is required to determine that, and the training and service implications.
Acknowledgments
The study was funded by a grant from the Chief Scientist's Office of the Scottish Home and Health Department. We thank David Cairns, who undertook this project as a special study module in the course for MBChB in the University of Edinburgh. JMW and SCL were funded by the Medical Research Council Clinical Research Initiative in Clinical Neurosciences. SCL is currently funded by the Chief Scientist's Office of the Scottish Home and Health Department.
References
Linked Articles
- Editorial commentary