Article Text

Abstract
Objective: To investigate intracranial cerebrospinal fluid (CSF) distribution in patients with a clinical diagnosis of idiopathic normal pressure hydrocephalus (INPH).
Methods: 24 patients with a clinical diagnosis of INPH were studied. Control groups comprised 17 patients with secondary normal pressure hydrocephalus (SNPH), 21 patients with brain atrophy, and 18 healthy volunteers. Ventricular volume (VV) and intracranial CSF volume (ICV) were measured using a magnetic resonance based method and the VV/ICV ratio was calculated.
Results: The SNPH group showed a marked increase in the VV/ICV ratio compared with the healthy volunteers (37.8% v 15.6%, p < 0.0001). The brain atrophy group showed a significant increase in ICV compared with the healthy volunteers (284.4 ml v 194.7 ml, p =0.0002). The INPH group showed an increase in ICV (281.2 ml, p = 0.0002) and an increase in the VV/ICV ratio (38.0%, p < 0.0001). Fifteen of 24 INPH patients underwent shunting; 11 improved and four did not.
Conclusions: The results suggest that INPH patients have brain atrophy in addition to hydrocephalic features. This may help to explain the difficulties encountered in the diagnosis and the unpredictable response rate to shunt surgery in INPH patients.
- normal pressure hydrocephalus
- CSF pressure measurement
- brain atrophy
Statistics from Altmetric.com
The diagnosis and appropriate treatment of patients with cognitive decline, ataxia, and incontinence is not easy, as only a proportion will have idiopathic normal pressure hydrocephalus (INPH),1–3 and many of these patients may also have early Alzheimer’s disease or vascular dementia. Coexistent cerebrovascular disease or Alzheimer’s disease is generally a predictor of poor outcome following CSF diversion.4,5 However, others have reported that despite vascular or Alzheimer changes in biopsy specimens from patients with clinically diagnosed INPH, some are still improved by shunting.5,6 Indeed, several studies have suggested that vascular changes might play an important role in the pathophysiology of INPH in some patients.7
Secondary normal pressure hydrocephalus (SNPH), which is not uncommon after subarachnoid haemorrhage and other disorders, generally responds well to CSF diversion and may share some neuroradiological features with INPH.1,7 It would be very helpful, therefore, if we could explain the differences between INPH, SNPH, Alzheimer’s disease, and vascular dementia in terms of quantitative diagnostic variables. We have reported that, using a magnetic resonance based cerebrospinal fluid (CSF) measurement method, an increase in the intracranial CSF volume is seen in patients with brain atrophy and a disproportionate increase in the ventricular CSF volume is seen in patients with hydrocephalus.8,9 Our method is non-invasive and relatively easy to perform in elderly or uncooperative patients.
Our aim in this study was to investigate intracranial CSF distribution in patients with suspected INPH in comparison with SNPH or brain atrophy.
METHODS
Subjects
We studied 80 subjects, all of whom gave their informed consent. The INPH group included 24 of 41 patients with suspected INPH (11 men and 13 women; mean age 72.9 years; range 64 to 84 years) who underwent CSF measurement at our hospital or affiliated hospitals between October 1996 and May 2000. They met the following diagnostic criteria:
the presence of at least two of the clinical triad of dementia, gait disturbance, and urinary incontinence;
normal intracranial pressure (less than 15 mm Hg, estimated at lumbar puncture in the lateral position) and increased outflow resistance (more than 5 mm Hg/ml/min by the infusion test)10;
absence of any neuroradiological lesions that might be responsible for the patient’s symptoms, such as cerebral infarction, though patients with mild white matter lesions were not necessarily excluded.
All 24 patients showed gait disturbance, 20 were demented, and 12 had urinary incontinence. Dementia was assessed by Hasegawa’s dementia scale, the most common diagnostic test in Japan,11 and the cut off line was less than 20/30 points.
Eight of 24 patients showed the complete triad of INPH. Other diagnostic tests were performed routinely as necessary to determine the indications for shunt surgery. At the decision making stage, we were not concerned with the results of CSF measurement. All these patients were advised to undergo surgery. Nine refused and 15 underwent ventricular shunting. Eleven of these 15 patients showed some clinical improvement and the remaining four showed no change. No shunt systems were revised during the study period.
The SNPH group included 17 patients (seven men and 10 women; mean age 67.5 years; range 58 to 80 years) with secondary normal pressure hydrocephalus (opening pressure less than 15 mm Hg) who showed clinical improvement after ventricular shunting. The underlying diseases were subarachnoid haemorrhage in seven, brain tumour (postoperative status) in four, intracerebral (intraventricular) haemorrhage in three, and head trauma in three. They all showed panventriculomegaly and were presumed to have communicating hydrocephalus.
The brain atrophy group included 21 outpatients clinically diagnosed as having Alzheimer’s disease or vascular dementia (12 men and nine women; mean age 72.6 years; range 60 to 86 years).
The healthy volunteer group included 18 healthy subjects (seven men and 11 women; mean age 67.5 years; range 55 to 81 years) with no history of neurological disease, who were thought to be free of any severe cerebrovascular, neurological, or psychiatric disorders.
The three control groups were age matched with the INPH group.
MR imaging and assessment
Magnetic resonance (MR) images were acquired using a 1.5 T MR system (Visart, Toshiba Corporation, Tokyo, Japan). The imaging parameters employed were the three dimensional asymmetric spin echo (3D-FASE) imaging method with a repetition time of 6000 ms, an echo time of 250 ms, a matrix of 256 × 256 × 96–106, and a slice thickness of 1.5 mm. The imaging area was set to include all the subarachnoid space above the superior margin of the atlas, with the anteroposterior and superoinferior directions adjusted by the field of view and the lateral direction adjusted by the number of imaging slices. Before 3D-FASE imaging, routine T1 and T2 weighted axial images were also acquired.
Images were processed using an SGI Indigo workstation and universal image processing software (AVS version 5.02). The region growing method, developed as a module of the AVS, was used to extract the CSF from the 3D-FASE images. As details of this method have been described in our previous reports,8,9,12 we present only a brief description here. In the region growing method, starting from a user specified voxel inside the region of interest (ROI), each adjacent voxel is tested to determine whether it satisfies the conditions for inclusion in the ROI. Those that satisfy the conditions are classified as valid voxels and are used as new seeds; otherwise, they are considered to be a part of the background and are excluded from further processing. The processing is repeated until no more valid voxels are found.
A typical test is the signal intensity difference between pairs of voxels. First, the user excludes extracranial long T2 areas, such as the eyeballs, by manual operation. Next, the first seed point is selected—for example, a point in the cerebral ventricles—and the region growing method program is executed for segmentation. Finally the CSF volume is obtained as the signal intensity weighted sum of the voxels inside the ROI.
In our subjects, the intracranial CSF volume (ICV) and intraventricular CSF volume (VV) were measured separately, and the VV/ICV ratio was then calculated. Intergroup differences were analysed statistically using analysis of variance (ANOVA) followed by Scheffé’s test. We attempted to identify characteristic features in the INPH group compared with other three groups from the viewpoint of the intracranial CSF distribution and to interpret the pathological implications.
RESULTS
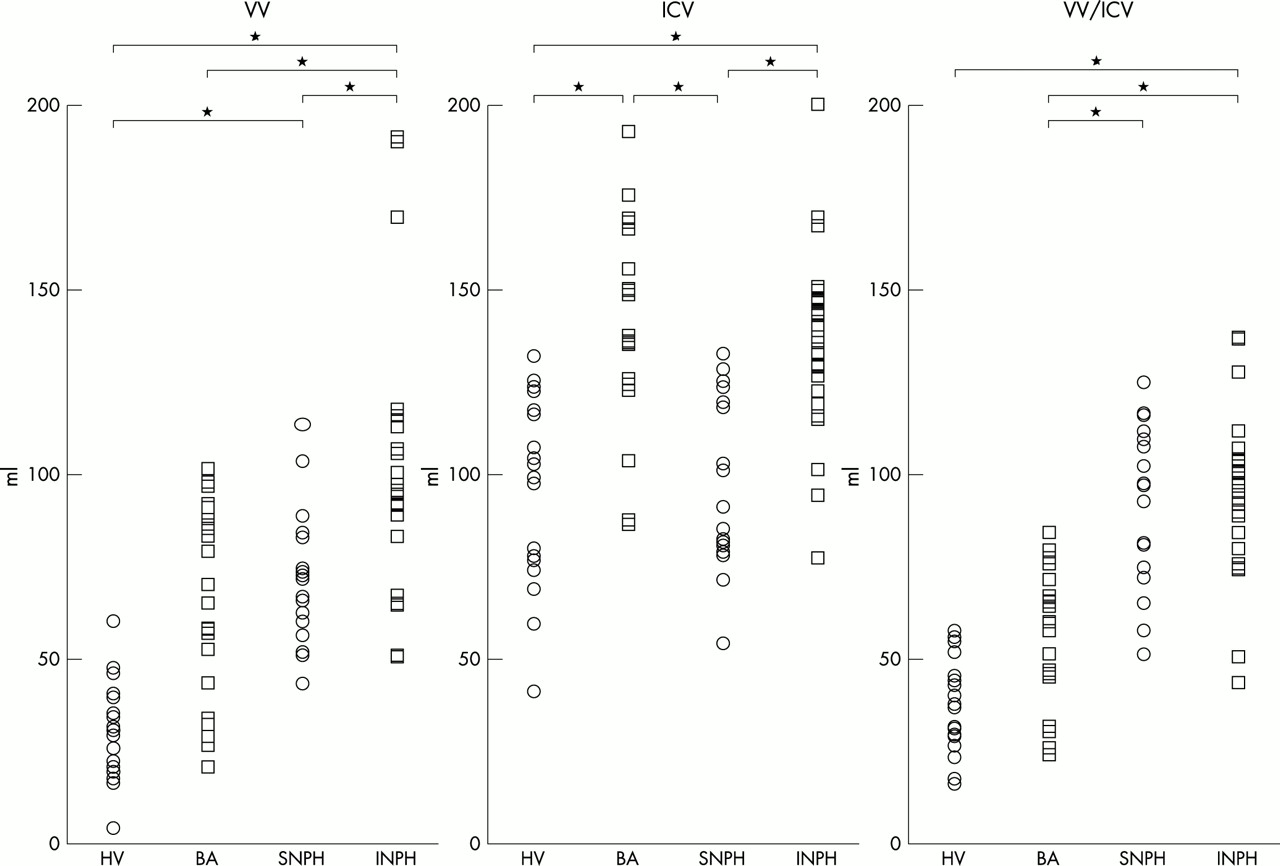
The distributions of intraventricular and intracranial CSF volume values and the VV/ICV ratios in each group are shown in fig 1, with statistical analysis of intergroup comparisons. The mean and standard deviation of these values are shown in table 1, and statistical analyses in table 2. All three parameters were found to be significant by one way analysis of variance (VV: F = 20.616, p < 0.0001, ICV: F = 14.390, p < 0.0001, VV/ICV ratio: F = 36.664, p < 0.0001).
Mean and standard deviation of each variable in each group
Comparison of volume parameters between each diagnostic group
Distribution of ventricular volume (VV), intracranial CSF volume (ICV), and VV/ICV ratio in each group. The differences between groups were assessed by one way analysis of variance (VV: F = 20.616, p < 0.0001; ICV: F = 14.390, p < 0.0001; VV/ICV ratio: F = 36.664, p < 0.0001) and Scheffé’s test (*p < 0.001). BA, brain atrophy; HV, healthy volunteer; INPH, idiopathic normal pressure hydrocephalus; SNPH, secondary normal pressure hydrocephalus.
The brain atrophy and SNPH groups had significantly higher mean ventricular volumes than the healthy volunteer group. Furthermore, the ventricular volumes in the INPH group were markedly increased compared with those in the brain atrophy and SNPH groups.
The mean intracranial CSF volumes in the INPH and brain atrophy groups were increased compared with those in the healthy volunteer group, and the differences were statistically significant (p < 0.001), whereas those in the SNPH group were hardly increased at all (p = 0.997). With regard to mean intracranial CSF volumes, the difference between the INPH and SNPH groups was statistically significant (p < 0.001), but that between the INPH and brain atrophy groups was not (p = 0.998).
The mean VV/ICV ratios were increased in the INPH and SNPH groups compared with the healthy volunteer group and the differences were statistically significant. The VV/ICV ratios in the brain atrophy group were slightly increased, but were not significantly different from those in the healthy volunteer group.
There were no obvious differences in any of the variables between the 11 shunt responsive and the four shunt non-responsive patients.
DISCUSSION
The results of our study suggest that the characteristic features of INPH from the viewpoint of intracranial CSF distribution are an increased ratio of ventricular volume to intracranial CSF volume and an increase in the intracranial CSF volume. We previously reported that the former is characteristic of hydrocephalus and the latter reflects brain atrophy secondary to ischaemic changes or degeneration.8,9 These findings suggest that the diagnosis of INPH implies both a CSF circulatory disorder and some degree of associated brain atrophy.
It is possible that the degree of cerebral atrophy could be estimated by measuring the increase in the total intracranial CSF volume—that is, the ICV value.8,13–15 In the present series, patients in the brain atrophy group showed a marked increase in the ICV compared with the control group. In addition, we have reported that the degree of increase in the ICV in such patients is excessive compared with the physiological changes observed in healthy elderly subjects.8 A diagnosis of pathogenic brain atrophy can be established by measuring the ICV; however, we cannot specify a strict cut off value at present.
Some researchers have suggested that sulcal dilatation is a predictor of an unfavourable shunt outcome in suspected INPH.16,17 As the VV/ICV ratio is a quantitative variable that indicates the degree of sulcal dilatation, it could be a useful parameter. We can presume that the CSF distribution seen in the SNPH patients, who were thought to be healthy before the onset of their illness, reflects a relatively pure CSF circulatory disorder. We conclude that the characteristic feature of hydrocephalus from the viewpoint of intracranial CSF distribution is not an increase in the ICV but an increase in the VV/ICV ratio.
Hence, our data suggest that patients with suspected INPH are suffering from two different pathogenic processes: a disorder of the CSF circulation and brain atrophy. It appears that the two variables employed in the present study—that is, the VV/ICV ratio and the ICV—faithfully reflect each pathogenic process. An increase in the VV/ICV ratio indicates a disorder of the CSF circulation and suggests that a shunt operation is required.8,9 On the other hand, an increased ICV value reflects the presence and degree of brain atrophy secondary to concomitant conditions and may imply an unfavourable shunt outcome. We know that, in general, patients with SNPH have a more favourable shunt outcome that patients with INPH.1,7,18 The difference between these patients might be explained by the ICV values, which indicate the degree of brain atrophy. It is not known whether we can assess the severity of concomitant conditions such as Alzheimer’s disease or cerebrovascular disease by measuring the ICV.
Without a large prospective study it is difficult to establish either the sensitivity and specificity of our technique or definite criteria for selecting candidates for shunt surgery using our MR measures of ventricular volume and intracranial CSF volume. Unfortunately, in the present study there were no obvious differences in CSF distribution between the shunt responsive and shunt non-responsive groups.