Article Text

Abstract
Background: In patients with clinically isolated syndromes (CIS) suggestive of multiple sclerosis (MS), the extent of brain magnetic resonance imaging (MRI) lesion load influences the probability and time to development of clinically definite MS. Cerebral atrophy is recognised in established MS, but its time of onset and whether, in early disease, it is related to MRI lesion load or clinical outcome is less certain.
Objectives: This study investigated ventricular enlargement over one year in CIS patients and explored its relation with lesion load and clinical outcome.
Methods: A semi-automated thresholding technique for measuring ventricular volume (MIDAS) was applied to MRI scans in a cohort of 55 patients with CIS, recruited consecutively and imaged within three months of the onset of symptoms and again after one year.
Results: Clinical MS had developed after one year in 16 of 40 patients with an abnormal baseline T2 scan and 2 of 15 with a normal scan. Significant ventricular enlargement was seen in 27 of 55 patients who fulfilled the new McDonald MRI criteria for MS using all available MRI at clinical follow up (median increase 0.3 cm3, p=0.005) Significant increase in ventricular volume was also seen in the 18 of 55 patients who developed clinical MS over the follow up period (median increase 0.5 cm3, p=0.006). There were significant but modest correlations between baseline lesion measures and subsequent ventricular enlargement.
Conclusions: (1) Lesions and atrophy are both associated with early relapse leading to a diagnosis of clinical MS; (2) while lesions contribute to the development of atrophy, atrophy may also develop by other mechanisms. This suggests that MR measures have a complementary role in monitoring the course of MS, even from the earliest clinical stage.
- multiple sclerosis
- clinically isolated syndromes
- ventricles
- CIS, clinically isolated syndromes
- MS, multiple sclerosis
- MRI, magnetic resonance imaging
- NAA, N-acetyl aspartate
Statistics from Altmetric.com
- CIS, clinically isolated syndromes
- MS, multiple sclerosis
- MRI, magnetic resonance imaging
- NAA, N-acetyl aspartate
Previous radiological and pathological studies have established that whole brain1–3 and spinal cord atrophy4,5 occur in multiple sclerosis (MS) in excess of that expected with age. In one study, progressive cerebral atrophy over one year has been detected using registered, volumetric magnetic resonance imaging (MRI) to measure both brain and ventricular volumes,6 with a rate of cerebral atrophy in MS shown to be twice that seen in normal controls and the rate of ventricular enlargement five times that of controls. There was also a good correspondence between global brain atrophy and ventricular enlargement.6
While the mechanisms of atrophy in MS are not well understood, it probably indicates loss of functionally important structures: myelin and axons that are the majority bulk of brain white matter, although variable effects on tissue volumes may also arise from glial cell proliferation or loss, gliosis, inflammation, and oedema.7 A correlation between reduced cerebral white matter N-acetyl aspartate (NAA) (a neuronal marker) and cerebral atrophy suggest that axonal loss may make a contribution.8 However, the relation between atrophy and decreased NAA is non-linear,9 and factors other than axonal loss are also likely to effect these MR measures. In general, disability in MS has been more strongly correlated with measures of atrophy than lesion load.10,11 However, only modest correlations between atrophy and lesion load have been observed.12,13 This could indicate that atrophy develops by mechanisms, some of which are independent of lesions, or that there is a temporal dissociation between lesion accumu-lation that occurs early in the disease process and atrophy, which occurs late.
To investigate the onset of atrophy and its relation to lesions and clinical events, we studied patients presenting with clinically isolated syndromes (CIS) suggestive of MS. The study of this cohort permits an investigation into the earliest clinical stages of MS, as long term follow up indicates that the majority of CIS patients with MRI brain lesions will go on to develop clinically definite MS.14–17 In this report, atrophy was evaluated using a measure of ventricular enlargement. This study follows a previous preliminary pilot study of a small, selected group of 17 from within the present larger cohort of 55 patients.18 The purposes of the study were:
To confirm the preliminary study showing that measurable ventricular enlargement develops over one year in some patients with patients with CIS.
To clarify whether ventricular enlargement is associated with the early development of MS, using conventional clinical criteria and the new McDonald criteria.
To determine the relation between ventricular enlargement and MR measurements of lesion load at this early stage of disease.
METHODS
Patients
We recruited adult patients, aged between 17 and 50 years, who presented to our clinics at Moorfields Eye Hospital or the National Hospital for Neurology and Neurosurgery with CIS suggestive of MS. Appropriate investigations including full blood count, erythrocyte sedimentation rate (ESR), autoantibody screen, syphilis serology, vitamin B12, and brain MRI were used to exclude other diagnoses. Fifty five patients were recruited consecutively from January 1996 until June 1999 (16 patients, recruited before a hardware upgrade to the scanner in January 1996 were excluded from this study because serial evaluations before and after upgrade revealed instability of volume measures. Ongoing quality assurance protocols have confirmed the stability of measurements since January 1996). A CIS was defined as a single event of acute onset in the central nervous system suggestive of demyelination, for example, unilateral optic neuritis, brain stem and partial spinal cord syndromes. Patients with a history of previous neurological symptoms suggestive of demyelination were excluded. Other diagnoses were excluded by appropriate investigations. Overall, 38 patients had optic neuritis, 11 a brain stem syndrome, five a spinal cord syndrome (spinal MRI excluded an alternative structural cause in these cases), and one patient had a hemianopia attributable to an MRI lesion in the optic tract.
The age range at baseline was 17 to 50 years with a median age of 31 years. The upper age limit of 50 years was applied to reduce the likelihood of including patients with white matter lesions attributable to small vessel disease and because onset of MS above this age is less common. Local ethics committees approved the study and informed consent was obtained from each patient before entry.
Patients were imaged on three occasions: (a) at baseline, which in all instances was within three months of the onset of symptoms, (b) approximately three months later, and (c) approximately one year later. Clinical examination and EDSS19 were performed at each visit. The diagnosis of clinical MS (clinically definite or probable) was based on the Poser criteria,20 using clinical criteria alone (MRI or CSF findings were not incorporated). Clinically definite MS was diagnosed when a second relapse occurred more than one month after the CIS, which involved a separate part of the CNS and was accompanied by new findings on examination. Clinically probable MS was diagnosed when there was a history indicating a new relapse involving a separate location but there were no new signs on examination. The new McDonald MRI criteria, which additionally permit a diagnosis of MS in CIS patients based on MRI evidence of dissemination of lesions in time and space, were also applied.21
Image acquisition
Brain MRI was performed using a 1.5 Tesla GE scanner. At baseline, three months and one year each, a proton density/T2 weighted fast spin echo (FSE) sequence (repetition time (TR) 3200 ms, effective echo time (TE) 15/95 ms) and a T1 weighted spin echo sequence (TR 600 ms TE 14 ms) were acquired in each patient, with 3 mm contiguous, axial slices. The matrix used was 256×256 with a field of view of 24 cm. Each patient was given an intravenous bolus of 0.1 mmol/kg gadolinium DTPA five to seven minutes before the start of image acquisition.
Ventricle volume measurement
The ventricles were measured on baseline and one year follow up T1 weighted scans using the MIDAS interactive image analysis package22 by a single observer blinded both to patient details and scan acquisition order (the three month scan was not analysed using MIDAS22 as it was considered unlikely that change would be detectable over this short period). The initial step was segmentation of the whole brain using a semi-automated interactive morphological technique with the image intensity threshold for the boundary between the CSF and brain set at 60% mean signal intensity. The inferior cut off was taken at the lowest point of the cerebellum. Ventricular volume consisted of the lateral ventricles and temporal horns but excluded the third and fourth ventricles. This was measured using a semi-automated seed placing technique, involving voxels with an image intensity of less than 60% of the mean (fig 1).22 MIDAS also provides a measure of change in whole brain volume, but on the two dimensional images available for this study, this measure required considerable time and manual editing. The analysis was therefore confined to ventricular volumes only.

Ventricular segmentation: seeds are inserted into the lateral ventricules and temporal horns. The third and fourth ventricules are excluded. High signal choroid is excluded. This 29 year old man presented with left optic neuritis in 1998. Two months later he developed numbness on the right side of his face. He had approximately three relapses between his baseline and one year scans.
Reproducibility of the ventricular measurement technique
Ten ventricular volumes were measured and re-measured after seven days by a single observer blinded to both patient details and scan acquisition order. The mean coefficient of variation was 0.89% before starting image analysis.
Lesion identification and lesion load measurement
The MRI scans were reviewed by an experienced neuroradiologist (KAM), who was blinded to the patients' clinical status at follow up. T2 weighted lesions were identified on the PD weighted images with confirmatory support from the long TE image, on both the baseline and one year follow up scans. T1 hypointense and gadolinium enhancing lesions were identified on the T1 weighted scans. T1 hypointense lesions were identified at baseline and one year follow up. Enhancing lesions were identified on all three scans (baseline, three months, and one year). The volumes of T2 and T1 hypointense lesions at baseline and one year were subsequently calculated from electronic data on a Sun Workstation using a semi-automated local thresholding technique to contour the lesions.23
Statistical analysis
Comparison was made between the baseline and one year ventricular volumes using the Wilcoxin signed rank test (tables 2 and 4). The Mann-Whitney U test was used to compare baseline lesion load measures in patients who developed MS and those who had no further symptoms (table 3). Correlations between lesions measures and ventricular volume change were performed using Spearman's non-parametric correlations.
The Bonferroni correction was applied by dividing the number of analyses into 0.05. The p value for significance was then calculated at 0.003 (table 5).
RESULTS
Baseline MRI findings
The median time delay between the onset of symptoms and baseline scan was six weeks, with a range of 1 to 12 weeks. At baseline, 40 of 55 (73%) patients had one or more lesions detected on T2 weighted MRI, of whom 21 also exhibited one or more hypointense lesions on T1 weighted images and 15 displayed one or more gadolinium enhancing lesions. Ventricular volumes varied considerably between subjects (range 1.2–39.2 cm3; see table 2, fig 2 and 3). There was no significant difference in baseline ventricular volumes in patients depending on sex (p=0.8), with or without T2 lesions (p=0.3), T1 lesions (p=0.9) and gadolinium enhancing lesions (p=0.2) (Mann-Whitney U test for all comparisons). There was no correlation between baseline ventricular volume and subsequent atrophy (r=0.17 and p=0.23).
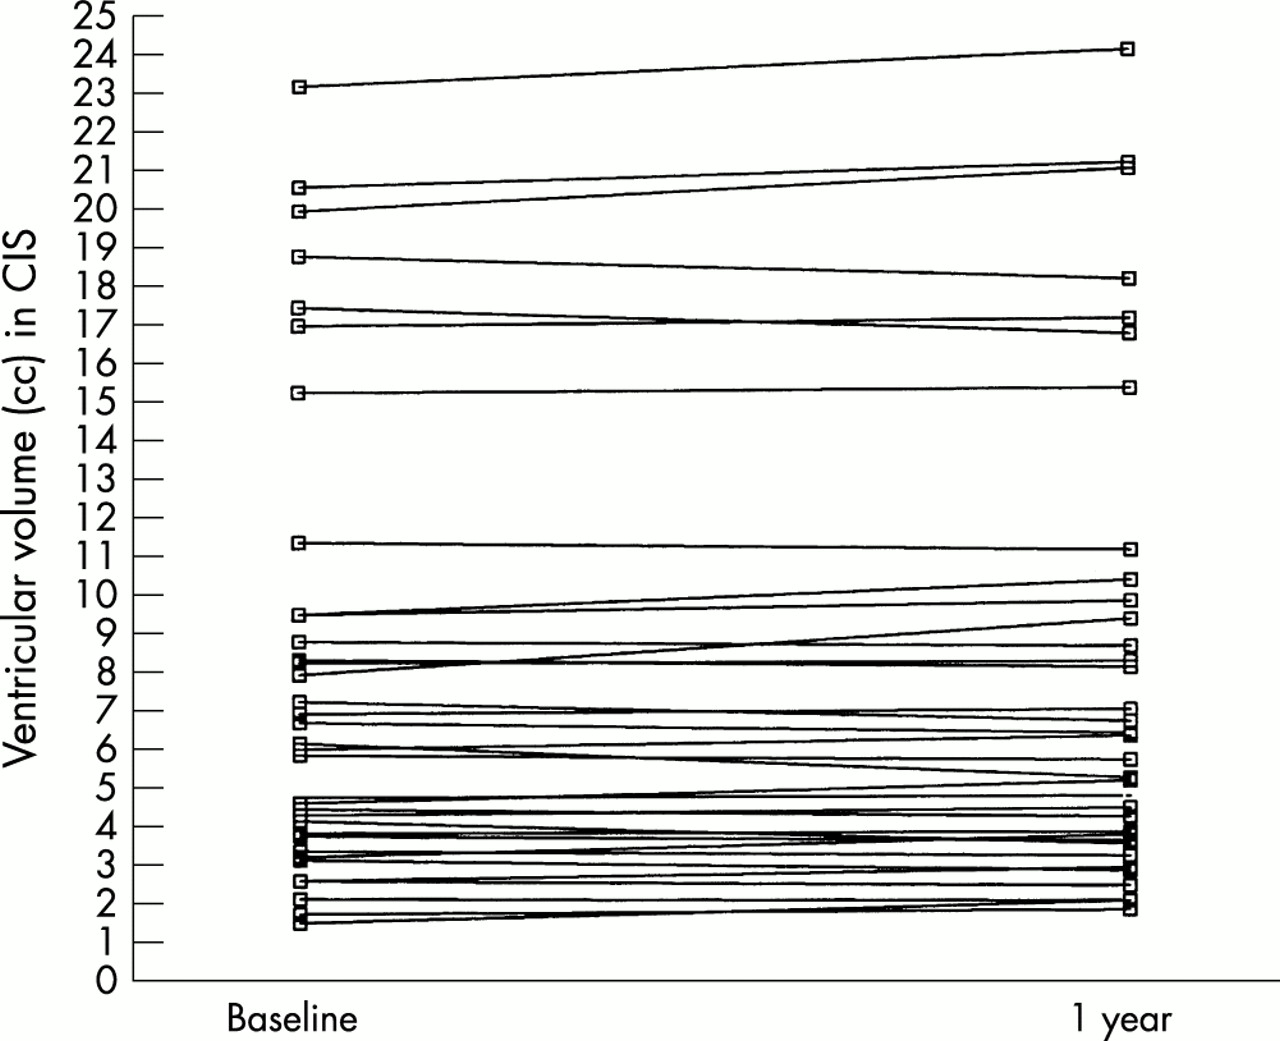
Scatter plot of ventricular volumes at baseline and one year in the 37 patients with CIS at one year.

Scatter plot of ventricular volumes at baseline and one year in the 18 patients with MS at one year.

Error bar plot of ventricular enlargement in patients with CIS and MS.
Follow up findings (tables 1–5)
Patient details
Comparison of ventricular volumes in patients who developed clinical MS and McDonald MS versus those who did not develop clinical and McDonald MS
Comparison of baseline lesion measures in patients who developed MS and those who remained asymptomatic
Ventricular volumes in patients with normal and abnormal T2 weighted MRI (that is, ≥1 T2 lesion) at baseline. Ventricular volumes in patients with abnormal baseline T2 weighted MRI: comparison of those with and without gadolinium (Gd) enhancing and T1 hypointense lesions
Correlation of change in ventricular volume over one year with other MRI lesion measures and with EDSS
Clinical outcome
The median time between the baseline and one year follow up was 12 months (range 11–16 months). Thirty seven patients remained asymptomatic, while 18 patients developed clinically definite (n=14) or probable (n=4) MS during the one year follow up period. Sixteen of the 18 patients who developed clinical MS had abnormalities on the T2 scan at baseline.
Relation between lesions and clinical outcome
The baseline number of T2, T1 hypointense and gadolinium enhancing lesions was significantly higher in those who went on to develop clinical MS compared with those who did not (table 3). The baseline volumes of T2 and T1 hypointense lesions were also significantly higher in those who developed MS (table 3).
Relation between ventricular enlargement and clinical outcome
There was a significant increase in ventricular volume over one year in the 18 patients who developed MS during the one year follow up period (p=0.006, table 2). A significant increase in ventricular volume was also seen in the 16 patients with T2 lesions at baseline who developed clinical MS at one year (median increase 0.9 cm3, p=0.002). There was no significant correlation between ventricular enlargement and baseline EDSS, month 12 EDSS or change in EDSS over the year, using the Bonferroni correction (table 5).
Relation between ventricular enlargement and the McDonald criteria for MS
The baseline, three month, and one year scans were retrospectively analysed to see how many patients fulfilled the new McDonald criteria for the diagnosis of MS.21 Patients with CIS with MRI evidence of dissemination in space and time were diagnosed as having McDonald MRI MS. Twenty seven of the 55 patients were McDonald criteria positive at one year (table 1).
Relation between ventricular enlargement and lesion load measures
Subgroup comparisons (table 4)
Significant ventricular enlargement was seen in the group of 40 patients with T2 lesions at baseline (p=0.001) but not in the 15 patients with normal scans at baseline (p=0.46, table 4). The 15 patients with gadolinium enhancing lesions at baseline had significant ventricular enlargement at one year (p=0.004, table 4).
The 14 patients who had gadolinium enhancing lesions at three months also showed significant ventricular enlargement at one year (baseline median 5.7 cm3 (2.6–25.9), one year median 6.7 cm3 (2.9–26.5), p=0.006). The seven patients who had enhancing lesions at both baseline and three months exhibited a substantial increase in ventricular volume (baseline median 7.9 cm3 (3.2–25.9), one year median 12.9 cm3 (3.7–26.5), p=0.02).
Ventricular volumes in the 21 patients with T1 hypointense lesions at baseline showed significant enlargement over the following year (p=0.001), but there was no significant change in the 19 patients who had T2 lesions but no T1 hypointense lesions (table 4).
Correlations (table 5)
Four correlations were significant using the corrections at <0.003 namely the baseline T1 hypointense lesion number and volume and one year T1 hypointense and T2 lesions volumes.
DISCUSSION
This study has confirmed previous reports in showing that the presence and number of MRI lesions at presentation with a CIS influences the risk of future clinical relapses leading to an early diagnosis of clinically definite or probable MS. Additionally, it revealed ventricular enlargement over one year in the subgroup of patients who developed clinical MS within that period. It also demonstrated ventricular enlargement in the larger cohort of patients with T2 MRI lesions at presentation, the presence of which is associated with a high probability for developing clinically definite MS after prolonged follow up.14–17 Finally, the study demonstrated significant, but only modest, correlations between T2 and T1 hypointense lesion load measures and subsequent ventricular enlargement.
A question arising is whether the ventricular enlargement might reflect a reduction in brain water content (pseudo atrophy) rather than true tissue loss. There was no significant difference in the gadolinium enhancing lesion number between the baseline and one year follow up scans (data not shown), so that a spontaneous decrease in the number of inflammatory oedematous lesions did not account for the ventricular enlargement seen. Anti-inflammatory treatments such as corticosteroids or beta interferon can reduce the number of inflammatory oedematous lesions, but in this study only three patients received corticosteroids (one received beta interferon) during the follow up phase.
There have been few studies investigating atrophy in CIS patients. We have previously reported a preliminary study of a small, selected group from within the present larger cohort, consisting of nine patients with T2 lesions at baseline who developed MS during one year of follow up and eight patients with a normal baseline scan who had no further clinical events. In that study we reported significant ventricular enlargement in the subgroup with T2 lesions.18 Secondly, we recently have investigated the cervical cord in 43 CIS patients and demonstrated mild but significant atrophy of the upper cervical cord in those patients who had T2 abnormalities on brain imaging.24
This investigation of a large cohort of consecutively recruited CIS cases confirms our preliminary observation in the smaller cohort that early development of ventricular enlargement is associated with further clinical relapses leading to a diagnosis of MS. The development of ventricular atrophy in association with early clinical relapses suggests a potential for this MR measure to provide prognostic data, which needs to be confirmed with long term follow up. There is some evidence from the literature, albeit inconsistent, that relapse rate in the first one to two years after a CIS is related to long term disability.25 The relation between early atrophy and long term disability should be investigated by prolonged follow up.
A possible mechanism for the observed ventricular enlargement would be loss of myelin and axons within lesions in itself, and Wallerian degeneration secondary to axonal transection within the lesions. Consistent with this mechanism are the correlations, albeit weak, between the baseline and month 3 number of enhancing lesions and ventricular enlargement. Enhancement is associated with pathological evidence of active inflammation26,27 and inflammation is associated with axonal damage and transection.28,29 The small group of patients with enhancing lesions at both baseline and month 3 exhibited more substantial ventricular enlargement. The more aggressive inflammatory disease may have contributed to this.
A modest correlation of ventricular enlargement was also found with baseline T2 and T1 hypointense loads but was somewhat stronger for T1 load. T1 hypointense lesions are associated pathologically with more severe axonal loss,30 and thus might be expected to result in a greater degree of secondary Wallerian degeneration and atrophy. It was notable that in the subgroup comparison of those with and without T1 hypointense lesions at baseline, significant ventricular enlargement was seen only in those with such lesions. T1 hypointense lesions in this study were detected on post-contrast scans—they are thus likely to indicate irreversible changes associated with axonal loss rather than the reversible hypointensity sometimes seen in acute enhancing lesions. The lack of correlation between change in T1 hypointense load over the year and ventricular enlargement may reflect the fact that the magnitude of the former was very small.
As none of the correlations between lesion measures and ventricular enlargement were strong, additional factors may contribute to atrophy. One possibility is a more diffuse process involving normal appearing tissues. To date, quantitative MR investigations of normal appearing brain tissues have provided conflicting evidence for abnormality in small CIS cohorts.32–34 An MR spectroscopy report demonstrated no significant reduction of NAA in the normal appearing white matter.31 Further quantitative MR investigations of the normal appearing brain tissue are needed in larger CIS cohorts.
The technique used in this study does not resolve the site of atrophy. While the MIDAS method used in this study provides a reliable measure of change in whole brain volume on 3D images, we found it less reliable with the present 2D dataset. It is not therefore certain whether atrophy occurs close to lesions, in normal appearing white matter, or in grey matter, although the fact that the ventricles are close to white matter suggests that there may be atrophy in this region. There are alternative strategies for measuring segmented grey and white matter volumes.35 Approaches such as voxel based morphometry may depict the regions in which atrophy is occurring. Application of such methods in future studies in CIS patients will be of interest.
The study of atrophy may help to understand the clinical effects of disease modifying treatments for MS. In established disease, beta interferons markedly reduce the rate of new MRI lesions (by 50%–70%; IFNB study 1993,36 Jacobs 1996,37 PRISMS 199838), but they have a smaller effect in preventing relapses, disability and atrophy.39,40 Future reports of the effect of treatment on atrophy in CIS patients are awaited, but this work highlights the potential for a mechanism of clinical deterioration that is independent of lesions.
While these results suggest that atrophy is occurring at the earliest clinical stage of MS, a direct comparison with other studies at a later stage is not possible, because the methodology involved has differed. There are a number of sensitive and reproducible methods for detecting brain atrophy but they may produce quite a different absolute measure of change.7 Further study of cohorts with later disease using the same MR acquisition and analysis method for measuring ventricular enlargement is now being undertaken.
Further follow up of the CIS cohort is now needed to determine the longer term evolution of atrophy, and its relation to lesion evolution, quantitative MR changes in the normal appearing tissues, and clinical outcome.
In conclusion, this study reveals two MR features in patients with CIS who go onto develop early clinical MS—lesions and atrophy. While lesions contribute to atrophy, the correlation is modest, suggesting that the latter also develops by other mechanisms. Both lesions and atrophy are therefore complementary methods for monitoring the course of MS, even from its earliest stages.
Acknowledgments
We thank Dr Martin King for his help with the statistical analysis.
REFERENCES
Footnotes
-
Funding: The NMR Research Unit receives a programme grant from the MS Society of Great Britain and Northern Ireland. Dr Dalton is supported by Elan Pharma. Drs Brex and O'Riordan were supported by Schering AG. Dr Fox holds an MRC Clinical Scientist Fellowship and Dr Crum is supported as part of an MRC programme grant.
-
Competing interests: none declared.