Article Text

Abstract
Background: Current magnetic resonance imaging (MRI) outcome measures such as T2 lesion load correlate poorly with disability in multiple sclerosis. Diffusion tensor imaging (DTI) of the brain can provide unique information regarding the orientation and integrity of white matter tracts in vivo.
Objective: To use this information to map the pyramidal tracts of patients with multiple sclerosis, investigate the relation between burden of disease in the tracts and disability, and compare this with more global magnetic resonance estimates of disease burden.
Methods: 25 patients with relapsing-remitting multiple sclerosis and 17 healthy volunteers were studied with DTI. An algorithm was used that automatically produced anatomically plausible maps of white matter tracts. The integrity of the pyramidal tracts was assessed using relative anisotropy and a novel measure (Lt) derived from the compounded relative anisotropy along the tracts. The methods were compared with both traditional and more recent techniques for measuring disease burden in multiple sclerosis (T2 lesion load and “whole brain” diffusion histograms).
Results: Relative anisotropy and Lt were significantly lower in patients than controls (p < 0.05). Pyramidal tract Lt in the patients correlated significantly with both expanded disability status scale (r = −0.48, p < 0.05), and to a greater degree, the pyramidal Kurtzke functional system score (KFS-p) (r = −0.75, p < 0.0001). T2 lesion load and diffusion histogram parameters did not correlate with disability.
Conclusions: Tract mapping using DTI is feasible and may increase the specificity of MRI in multiple sclerosis by matching appropriate tracts with specific clinical scoring systems. These techniques may be applicable to a wide range of neurological conditions.
- multiple sclerosis
- magnetic resonance imaging
- diffusion tensor
- neurological stamp
- ADC, apparent diffusion coefficient
- DTI, diffusion tensor imaging
- EDSS, expanded disability status scale
- KFS-p, Kurtzke functional systems score
- ROI, region of interest
- TE, time of echo
- TR, time of repetition
Statistics from Altmetric.com
- ADC, apparent diffusion coefficient
- DTI, diffusion tensor imaging
- EDSS, expanded disability status scale
- KFS-p, Kurtzke functional systems score
- ROI, region of interest
- TE, time of echo
- TR, time of repetition
The development of magnetic resonance imaging (MRI) beyond a diagnostic aid in multiple sclerosis has been limited by consistently weak relations between MRI measures and the level of current or future disability (the “clinico-radiological paradox”). This in part reflects poor pathological specificity of T2 weighted images, which are unable to differentiate between oedema, demyelination, axonal loss, and gliosis,1–,3 and the limitations of the expanded disability status scale (EDSS),4 which is heavily weighted toward ambulatory dysfunction. The other explanation is related to the concept of “clinically eloquent” sites of involvement in multiple sclerosis, whereby a small lesion in the spinal cord, pyramidal tract, or optic nerve may cause significant impairment, whereas a large subcortical lesion may be entirely asymptomatic. A “burden of disease” measure—such as total T2 lesion volume, for example—will include many asymptomatic lesions and provides no information about the spatial distribution or functional relevance of pathological damage. In addition, such measures do not take into account the pathology within apparently normal appearing white matter.
Various MRI studies that have been applied to these problems include quantitative techniques such as magnetisation transfer imaging,5 T1 relaxometry,6 magnetic resonance spectroscopy,7–,9 and diffusion weighted imaging.10 Diffusion weighted imaging uses the random movement of water molecules in tissue to generate image contrast, allowing qualitative assessment of various pathologies including stroke and cerebral tumours.11 Diffusion imaging can also provide a quantitative measure of water diffusion in tissue—the apparent diffusion coefficient (ADC). If the ADC is measured along three (or more) appropriate vectors, an average ADC (ADCav) can be calculated, to provide a quantitative measure of the overall diffusivity of a region. Diffusion in the white matter tracts of the brain is primarily restricted by intact myelinated axons; damage to these structures is presumed to allow less restricted diffusion and raised ADC values. Measurement of ADC within multiple sclerosis plaques has revealed the heterogeneous nature of “T2 lesions” in vivo,12–,17 and the distribution of ADC throughout the brain has also been used to assess the burden of disease using the technique of whole brain histograms,18–,20 which include both discrete lesions and normal appearing white matter.
Diffusion tensor imaging (DTI) requires that diffusion gradients be applied in at least six non-colinear directions. This enables the construction of a tensor, a mathematical matrix that describes diffusion within each voxel independently of the orientation of the applied gradients.21 The tensor can be used to produce images of both trace (equivalent to ADC averaged between three or more orthogonal directions) and anisotropy (highly anisotropic tissues such as normal white matter producing high signal). However, the directional information contained in the tensor also makes it possible to identify the orientation and integrity of white matter tracts. Preliminary studies in rats22,23 and subsequently healthy human volunteers24–,26 have shown the potential of these techniques, and case reports have suggested possible clinical applications in stroke27 and neuro-oncology.28
Using DTI, we aimed to assess pyramidal tract damage caused by multiple sclerosis by using an algorithm to both map the tracts and measure the burden of disease within them. We hypothesised that, by studying specific anatomical regions relevant to motor impairment, the correlation between MRI parameters and the level of clinical disability would be significantly improved in comparison with either total T2 lesion volume or whole brain diffusion histograms.
METHODS
We studied 25 patients with relapsing-remitting multiple sclerosis and 17 healthy volunteers. Informed consent from all subjects was obtained in accordance with the Declaration of Helsinki and with approval of the local ethics committee.
Each patient underwent neurological assessment including rating on the EDSS and the pyramidal component of the Kurtzke functional systems score (KFS-p). The KFS-p was used as a more specific estimate of motor impairment. There were eight male and 17 female patients. Their mean age was 40 years (range 26 to 54), mean disease duration seven years (range 1 to 21), and mean EDSS score 3 (range 1 to 6).
The mean age of the control subjects was 37 years (range 25 to 49).
No patient had been exposed to disease modifying drugs at any time, or received steroids in the three months before the study. All image analysis was performed blind to the identity of the subject.
MRI protocols
All subjects were scanned in a clinical imaging system at 1.5T (Magnetom Vision, Siemens, Erlangen, Germany). A spin echo, echo planar diffusion weighted sequence was used (TE 103 ms, TR 6000 ms, time per echo 0.8 ms, number of echoes 96, voxel dimensions 2 × 2 × 4 mm) with the application of six non-colinear gradients (maximum strength 22 mT/m) with a bmax of 1000 s/mm2.29 Fifteen axial slices were imaged, sampling a volume that encompassed the lateral ventricles and included the cerebral peduncles and midbrain in the most caudal slices. Acquisition was preceded by an automated shimming sequence to maximise magnetic field homogeneity. The tensor data were transferred electronically to a workstation (Sun Microsystems Ultra 1) for processing of trace and relative anisotropy maps, using locally developed software based on definitions published by Basser and Pierpaoli.21 This software included a distortion correction using the “reversed gradient method,” which requires the acquisition of two datasets, the second with a phase encoding gradient of reversed polarity.29 Post-processing took approximately three minutes per image set.
In addition, all subjects were scanned using a standard T2 weighted dual echo sequence (TE = 80 ms, TR = 2323 ms, voxel dimensions 1 × 1 × 3 mm).
T2 lesion load
The total volume of brain lesions on T2 weighted spin echo images was estimated using a semiautomated thresholding technique within a commercial image analysis software program (Analyze©, Analyzedirect.com, USA).
Diffusion histograms
“Whole brain” diffusion histograms were calculated within the Analyze© program using methods published previously.20 Histograms of both trace diffusion and relative anisotropy were calculated and normalised to total brain volume, from which histogram parameters including mean, standard deviation, and quartile values could be derived.
Pyramidal tract mapping
In normal white matter the direction of highest diffusivity, the principal diffusion vector, is parallel to the tract.30–,32 Using this fact, algorithms have been developed which map specific white matter tract bundles automatically, by following a trajectory based upon the principle diffusion vector in each adjacent voxel.23,24,26
To initialise a trajectory, the start point is taken from within a region of interest (ROI), which is used to mark out a specific part of the brain on the acquired image. In the present study a region of interest in the midbrain, which included the pyramidal tracts, was defined using a semiautomated thresholding technique (fig 1⇓). The pyramidal tracts were chosen because they are highly anisotropic, have a well defined anatomical course, and are clinically relevant to motor impairment.

Pyramidal tract mapping begins with the definition of a region of interest (in this case the midbrain) on an axial image (A) in which the orientations of fibres in x, y, and z planes are colour coded blue, green, and red, respectively. Trajectories are then mapped automatically by making single steps in the direction of the principal diffusion direction. The resulting tract map is shown in coronal section in (B).
To prevent initial points being chosen from outside the white matter, the relative anisotropy at the initial point must be greater than a predefined threshold value. The relative anisotropy measures the relative differences between the three principal diffusivities and is highest in white matter. A threshold value of 0.1 was used to reject any points of grey matter within the region of interest.
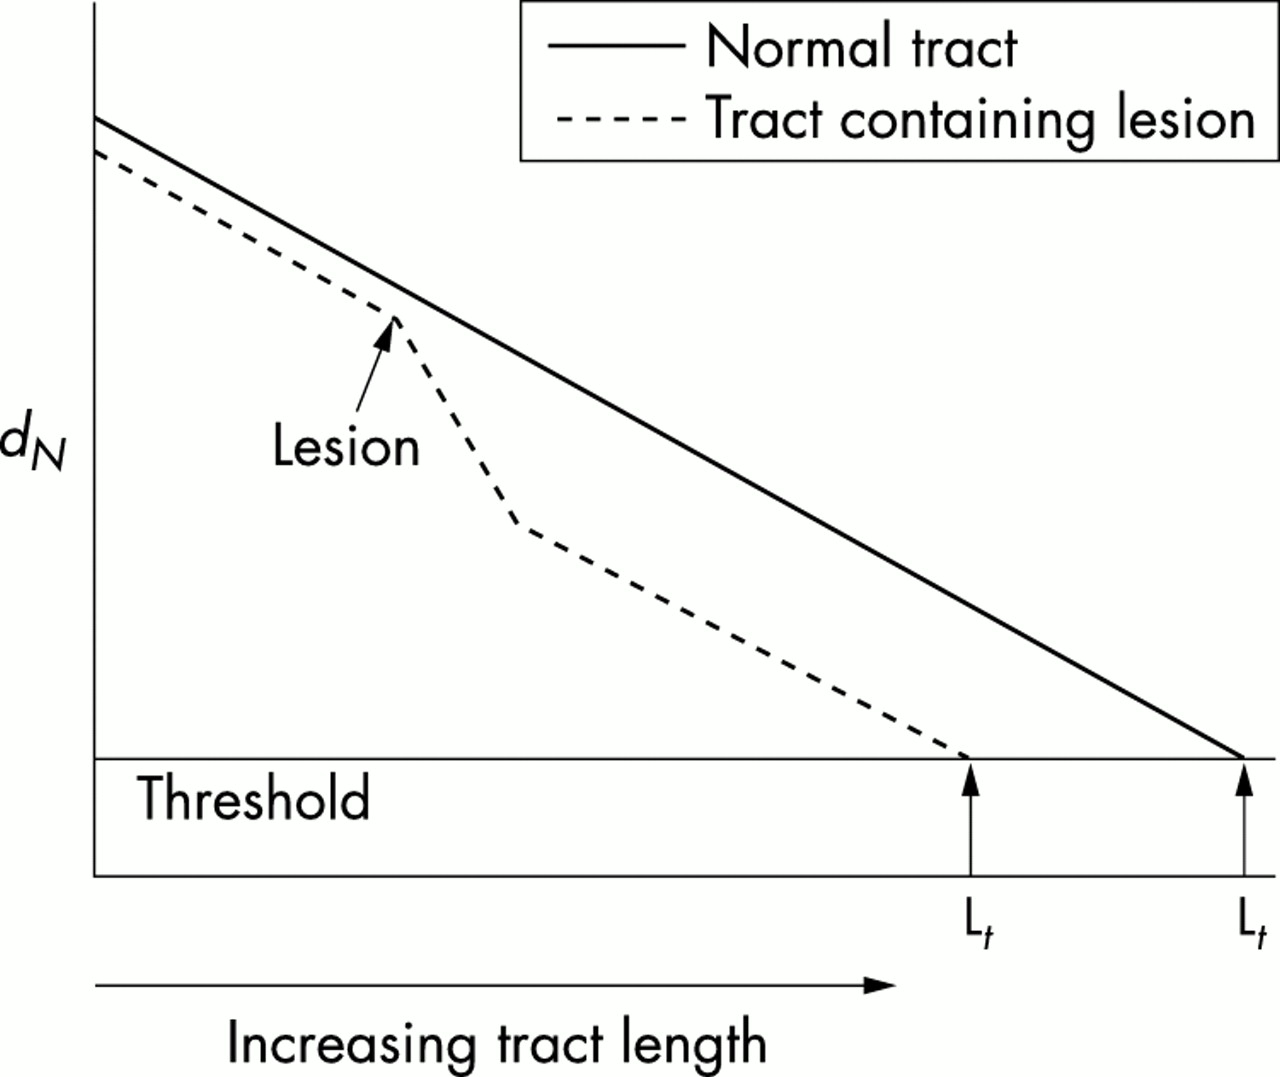
From the initial point, the trajectory is continued until a predefined stopping criterion is met. The stopping criteria in this study were chosen carefully so that trajectories could pass through a multiple sclerosis lesion but not enter the grey matter. Here a parameter based on the relative anisotropy is used to determine the termination point of the trajectory and therefore its length Lt. In normal appearing white matter of patients, and in lesions, the relative anisotropy is reduced compared with that of white matter in healthy controls. This fact can be used to reduce the length of trajectories that follow tracts with a high disease burden. A simple measure of burden up to the Nth step along the tract is the compounded relative anisotropy at each point rn, as defined by:

With this measure, the disease burden is represented equally at all points in the tract. Termination of the trajectory occurs when dN falls below a threshold value which is set so as to prevent the trajectory entering the grey matter. The trajectory length (Lt) at which this threshold is crossed is therefore a measure of pathological damage along the tract (fig 2⇓).

Schematic representation of the measurement of Lt, defined as the point at which dN falls below a threshold value. The solid line represents a trajectory from a normal control, the dashed line a trajectory passing through a region of low anisotropy (lesion). Note that although the trajectory is able to continue through the lesion, this results in a reduction of trajectory length Lt.
Statistics
Differences in the diffusion characteristics of the tract maps and histograms in patients and controls were compared with the Mann–Whitney test. Parameters from the tract maps and histograms were correlated with both global disability (EDSS) and motor impairment (KFS-p) using Spearman’s rank method. Two sided probability (p) values and a significance level of < 0.05 were used throughout.
Reproducibility
The algorithm for identifying and mapping tracts was fully automated, but required a user defined region of interest from which to start. Despite being blinded to the subject identity this manual input could potentially introduce bias and error. In order to assess the error that this manual step might introduce, ROI definition was repeated by another investigator who was unaware of the previous ROI position. This was done on all 25 patients, and pyramidal tract data were collected and analysed as previously described. Parameters were then compared and the coefficient of error calculated.33
RESULTS
Pyramidal tract data
Interobserver coefficient of error for all pyramidal tract parameters was < 1%. The mean, standard deviation, and 75th quartile Lt, measured along the pyramidal tracts, were significantly lower in patients than controls (all p < 0.05) (table 1⇓). Means and standard deviations of relative anisotropy were also significantly lower in the pyramidal tracts of the patients (p < 0.05).
Comparison of pyramidal tract trajectory length (Lt) in patients and controls
There were strong correlations between pyramidal tract Lt and the KFS-p (measuring “pyramidal” impairment), particularly for the 75th quartile Lt (table 2⇓), reflecting a reduction of trajectories with high Lt. The relation with EDSS (measuring overall disability) was not as strong, though the Lt standard deviation and 75th quartile remained significant.
Spearmans’ correlation coefficients (r) for pyramidal tract trajectory length (Lt) values with overall (EDSS) and specific (KFS-p) disability scores
The mean relative anisotropy of the pyramidal tracts also showed significant correlations with KFS-p (r = −0.69, p < 0.001), though not with the EDSS (r = −0.36, p = 0.08).
Diffusion histogram data
The trace histograms revealed significant differences between patients and controls, particularly in peak height of the histogram, which was lower in patients (p < 0.05) with a consequent right shift toward higher values of trace (less restricted diffusion) (fig 3⇓). However, peak height and mean trace did not correlate significantly with disease duration, EDSS, or KFS-p. Histograms of relative anisotropy revealed more subtle differences in patients compared with controls, with a left shift toward lower values of anisotropy (fig 4⇓). These differences did not reach statistical significance, however. Mean and peak height relative anisotropy did not correlate with EDSS or KFS-p.

Normalised histograms of trace diffusion in patients and controls. The histogram of multiple sclerosis patients shows a lower peak height and a right shift toward higher, less restricted diffusion.

Normalised histograms of relative anisotropy in patients and controls. The histogram of multiple sclerosis patients shows a higher peak and left shift toward lower values of anisotropy, implying loss of normal white matter fibre organisation.
T2 lesion volume
The total volume of T2 lesions (mean 5482 mm3, range 4 to 47 590 mm3) did not correlate significantly with EDSS (r = −0.13, p = 0.53), or KFS-p (r = 0.11, p = 0.6).
DISCUSSION
In this paper we describe a technique based on diffusion tensor imaging that automatically maps white matter tracts in specific regions of interest (for example, the pyramidal tracts) and measures diffusion characteristics along these tracts. We have demonstrated significant differences between multiple sclerosis patients and healthy controls, and significant correlations between pyramidal tract abnormalities and levels of clinical impairment.
Other investigators have also used DTI to identify white matter tracts in human subjects. In their study of healthy volunteers, for example, Basser et al used an algorithm with stopping criteria based on a minimum allowed relative anisotropy threshold.26 However, this raises problems when applied to pathological conditions such as multiple sclerosis, where lesions would be expected to cause low values of anisotropy and would therefore be excluded from any analysis along the identified tracts.
The algorithm described in this paper produces anatomically plausible fibre tract maps, allowing the identification of specific regions of interest (in this case, the pyramidal tracts). Having identified the target tracts, diffusion characteristics within them can then be measured. In this study we have used a length measure (Lt), based on the relative anisotropy in the tract bundles, that allows the accumulation of data through both healthy and diseased tissue. This measure provides an unbiased representation of disease burden at all points along the tract.
We have shown that these parameters are significantly different in multiple sclerosis patients and age matched healthy controls, and correlate with the degree of impairment and disability, particularly the pyramidal component of the EDSS. This shows the potential of the technique to match abnormalities in appropriate anatomical fibre tracts to specific disability measures, and improve the specificity of MRI for the pathological substrates of disability in multiple sclerosis. Other investigators have also attempted to improve correlations with clinical disability by measuring T2 lesion volume within the pyramidal tracts from standard T2 weighted MRI.34 Although this resulted in significant correlations with EDSS (r = 0.67), they also found an unusually high correlation between total brain T2 lesion load and EDSS (r = 0.6) in their patient group, making any advantage gained minimal. We did not feel that measuring lesion volume within such a small region was practical using the techniques at our disposal.
In contrast to the pyramidal tract data, the other measures of disease burden we assessed failed to provide any significant correlations with disability. These included both total T2 lesion volume and diffusion histogram analysis (which allows a more complete assessment of disease burden by including pathology within normal appearing white matter as well as discrete lesions). It seems likely that this lack of correlation with disability reflects the heavy weighting of the EDSS toward motor impairment and its relative insensitivity to other domains including cognitive function. The results of our study, therefore, suggest that it is the site of pathology rather than the overall burden of disease that is most relevant to disability (as defined by the EDSS), and that the clinico-radiological paradox may be improved by matching disability measures to anatomically appropriate MRI measures.
The methods described have potential applications in many branches of neuroscience, though some limitations should be mentioned. The technique is dependent on image resolution, so mapping tract bundles of subvoxel size would not be possible. In addition, fibre tracts with lower anisotropy and less well defined anatomy than the pyramidal tracts may be more difficult to track. Extending image acquisition to include the brain stem and posterior fossa presents technical difficulties in producing artefact-free images and would increase acquisition time.
The identified tracts are not restricted to measuring diffusion characteristics, however. By co-registering tensor images with other modes, a whole range of magnetic resonance parameters within specific tracts could be measured, including spectroscopy, T1 relaxation times, and magnetisation transfer ratios. As such we believe the methods described here may be applied to a variety of neurological conditions including multiple sclerosis, stroke, cerebral tumours, dementia, and psychiatric disorders.
REFERENCES
Footnotes
-
Competing interests: none declared