Article Text

Abstract
Objective: We performed 1H-MR spectroscopy (1H-MRS) on multiple brain regions to determine the metabolite pattern and diagnostic utility of 1H-MRS in multiple system atrophy (MSA).
Methods: Examining single voxels at 3.0 T, we studied metabolic findings of the putamen, pontine base, and cerebral white matter in 24 MSA patients (predominant cerebellar ataxia (MSA-C), n = 13), parkinsonism (MSA-P), n = 11), in 11 age and duration matched Parkinson’s disease patients (PD) and in 18 age matched control subjects.
Results: The N-acetylaspartate to creatine ratio (NAA/Cr) in MSA patients showed a significant reduction in the pontine base (p<0.0001) and putamen (p = 0.02) compared with controls. NAA/Cr in cerebral white matter also tended to decline in long standing cases. NAA/Cr reduction in the pontine base was prominent in both MSA-P (p<0.0001) and MSA-C (p<0.0001), and putaminal NAA/Cr reduction was significant in MSA-P (p = 0.009). It was also significant in patients who were in an early phase of their disease, and in those who showed no ataxic symptoms or parkinsonism, or did not show any MRI abnormality of the “hot cross bun” sign or hyperintense putaminal rims. NAA/Cr in MSA-P patients was significantly reduced in the pontine base (p = 0.001) and putamen (p = 0.002) compared with PD patients. The combined 1H-MRS in the putamen and pontine base served to distinguish patients with MSA-P from PD more clearly.
Conclusions:1H-MRS showed widespread neuronal and axonal involvement in MSA. The NAA/Cr reduction in the pontine base proved highly informative in the early diagnosis of MSA prior to MRI changes and even before any clinical manifestation of symptoms.
- multiple system atrophy (MSA)
- Parkinson’s disease
- proton magnetic resonance spectroscopy (MRS)
- Pontine base
- Cho, choline
- Cr, creatine
- CWM, cerebral white matter
- HCB, “hot cross bun”
- HPR, hyperintense rim
- MRI, magnetic resonance imaging
- MRS, magnetic resonance spectroscopy
- MSA, multiple system atrophy
- MSA-C, multiple system atrophy with cerebellar ataxia predominant
- MSA-P, multiple system atrophy with parkinsonism predominant
- NAA, N-acetylaspartate
- PD, Parkinson’s disease
- SNR, signal to noise ratio
- VOI, volume of interest
Statistics from Altmetric.com
- multiple system atrophy (MSA)
- Parkinson’s disease
- proton magnetic resonance spectroscopy (MRS)
- Pontine base
- Cho, choline
- Cr, creatine
- CWM, cerebral white matter
- HCB, “hot cross bun”
- HPR, hyperintense rim
- MRI, magnetic resonance imaging
- MRS, magnetic resonance spectroscopy
- MSA, multiple system atrophy
- MSA-C, multiple system atrophy with cerebellar ataxia predominant
- MSA-P, multiple system atrophy with parkinsonism predominant
- NAA, N-acetylaspartate
- PD, Parkinson’s disease
- SNR, signal to noise ratio
- VOI, volume of interest
Multiple system atrophy (MSA) is a sporadically occurring neurodegenerative disease that presents parkinsonism, cerebellar ataxia, autonomic failure, and pyramidal signs of varying severity during the course of illness.1–3 Neuropathological findings consist of a varying neuronal loss, gliosis, and demyelination with widespread regional involvement, particularly including the striatonigral, olivopontocerebellar, and autonomic nervous systems.4–6 The tempo and progression of multiple system involvement vary widely among individual MSA patients and have been closely related to both functional deterioration and prognosis by clinical evaluation.7 Thus, assessing the multi-regional involvement in MSA is essential for accurate diagnosis, counselling of patients and families, optimal management of symptoms, and the usefulness of future therapeutic trials.
Proton magnetic resonance spectroscopy (1H-MRS) is a valuable non-invasive MR technique for monitoring brain metabolism in vivo.8–18 The major peaks of the 1H-MRS spectrum, corresponding to N-acetylaspartate (NAA), creatine (Cr), and choline (Cho) containing phospholipids, have been used to evaluate neuronal loss and active myelin breakdown. The ratio of NAA to Cr (NAA/Cr) is considered a metabolic marker reflecting the functional status of neurones and axons in the brain, with a decrease indicating neuronal or axonal loss or dysfunction. Previous studies using 1H-MRS in MSA with predominant parkinsonism (MSA-P) reported a significant NAA/Cr reduction in the striatum compared with Parkinson’s disease (PD) patients and normal subjects.11–14 However, the pontine base and cerebral white matter, which are also pathologically involved in MSA, have not been fully assessed by 1H-MRS. Recent technical innovations have permitted 1H-MRS at higher magnetic field strengths.19–21 Multi-regional data can be obtained from single voxel 1H-MRS within a short examination time with increasing signal to noise ratio (SNR).
Our purpose was to assess the extent of multiple system involvement in patients with MSA by using multiple regional single voxel 1H-MRS including the putamen, pontine base, and cerebral white matter (CWM), and to further assess the diagnostic value of the regional 1H-MRS.
METHODS
All patients and control subjects gave written informed consent. The MR protocol was approved by the Ethics Committee of the Nagoya University School of Medicine. Twenty four patients with MSA (12M, 12F; mean (SD) age 61 (7) years old), 11 patients with PD (5M, 6F; 63 (9) years old), and 18 control subjects with no history of any neurological disease (10M, 8F; 59 (7) years old) were studied. No significant differences in male to female ratio or age were noted among the three groups. The duration from initial symptoms to MRI and MRS evaluation also showed no differences between MSA and PD patients (MSA; 3.7 (2.4) years; PD; 4.4 (2.2) years, p>0.4). Diagnoses of all MSA and PD patients were “probable” according to established diagnostic criteria.322 As for subtypes of MSA, cerebellar dysfunction (MSA-C) predominated in 13 patients and parkinsonism (MSA-P) in 11. We classified patients into two groups according to the presence of parkinsonian signs in MSA, based on the consensus statement for MSA diagnosis. Patients with bradykinesia plus at least one sign of either rigidity, postural instability, or tremor were considered to manifest parkinsonism and designated as “parkinsonism+”, while others were taken to be “parkinsonism−”. As for cerebellar dysfunction, patients with gait ataxia plus at least one sign of ataxic dysarthria, limb ataxia, or sustained gaze evoked nystagmus were considered “ataxia+”, and others as “ataxia−” based on the consensus criteria.3 Six of nine MSA-P patients and all PD patients were taking medication for parkinsonism (benserazide/levodopa 25/100 mg, or carbidopa/levodopa 10/100 mg, two or three times daily). All PD patients showed a good response to treatment.
MRI and 1H-MRS were performed with a 3.0 T system (Bruker, Ettlingen, Germany) using a standard head coil with circular polarisation. The imaging protocol consisted of sagittal T1 weighted spin echo sequences (repetition time (TR), 460 ms; echo time (TE), 14 ms) and transverse T2 weighted sequences (TR, 3970 ms; TE, 80 ms). Slice thickness was 6 mm with a 1.2 mm gap and a 512×384 matrix. We evaluated whether a “hot cross bun” (HCB) sign was present in the pons and whether the putamen showed a hyperintense rim (HPR), according to the criteria described in previous reports (fig 1A, B).723–26 The spectroscopic volume of interest (VOI) was placed in the pontine base (2.2 to 3.4 cm3), the putamen (1 cm3), and the CWM (3.4 cm3; fig 1A to C). Voxel size was chosen to be as small as possible while maintaining an acceptable SNR in order to minimise the partial volume effect. Care was taken not to incorporate cerebrospinal fluid spaces within a VOI. The VOI in the putamen was placed on the more affected side, and the frontal lobe VOI was ipsilateral to the putaminal VOI. 1H-MR spectra were acquired using a point resolved spectroscopy sequence with chemical shift selective water suppression. Spectral parameters were as follows: TR: 2000 ms; TE: 30 ms; averages: 256 in the putamen, and 64 each in the centrum semiovale and pons; data points: 1024. A shimming procedure focused on the water signal was performed to obtain a uniform and homogenous magnetic field. After Fourier transformation and zero order phase correction, relative metabolite concentrations for NAA at 2.0 ppm, Cr at 3.0 ppm, and Cho at 3.2 ppm were determined by Lorentzian curve fitting of the corresponding resonance in the frequency spectra. The baseline was corrected for purposes of data presentation. From these data, the metabolite ratios NAA/Cr, and Cho/Cr were determined as semiquantitative values. Post-procedural processing was performed by the same radiologist (HF). All preconditioning, spectroscopic measurements, and processing were performed with Paravision 2.01 software (Bruker). Total examination time including MRI and 1H-MRS was <1 hour. One MSA-C patient with severe pontine atrophy was excluded because a good pontine spectrum could not be obtained.

Location of volumes of interest are shown by squares in the pontine base (A), putamen (B), and white matter of the frontal lobe (C). Additionally, in these images, an HCB sign is present in the pons (A), as is a hyperintense putaminal rim (B). Axial T2 weighted images (3.0 T; TR: 3970, TE: 80), with respective findings are indicated by arrowheads.
Values obtained were entered into a database for further statistical analysis. The Mann-Whitney U test and the Kruskal-Wallis test for nonparametric statistics were performed as appropriate. When the Kruskal-Wallis test indicated differences among groups, in a multiple comparison analysis, Scheffé’s test was used to identify which group differences accounted for the significant p value. Relationships of NAA/Cr reduction to duration of illness were analysed using Pearson’s correlation coefficient. Calculations were performed using the Stat View statistical software package (Abacus Concepts, Berkeley, CA, USA). Statistical significance was defined as p<0.05.
RESULTS
Widespread NAA/Cr reduction in MSA in multiple regional 1H-MRS
A representative MSA patient (fig 2) showed a marked reduction of the NAA peak in the pontine base, putamen, and cerebral white matter compared with controls. NAA/Cr was significantly reduced in the pontine base of MSA patients (p<0.0001) and in the putamen (p = 0.02) compared with controls. MSA patients also showed a lower NAA/Cr in cerebral white matter than controls, but this difference was not statistically significant (p = 0.12). Cho/Cr was only slightly increased in MSA, and no significant differences were found among the three groups for the pontine base, putamen, and CWM.
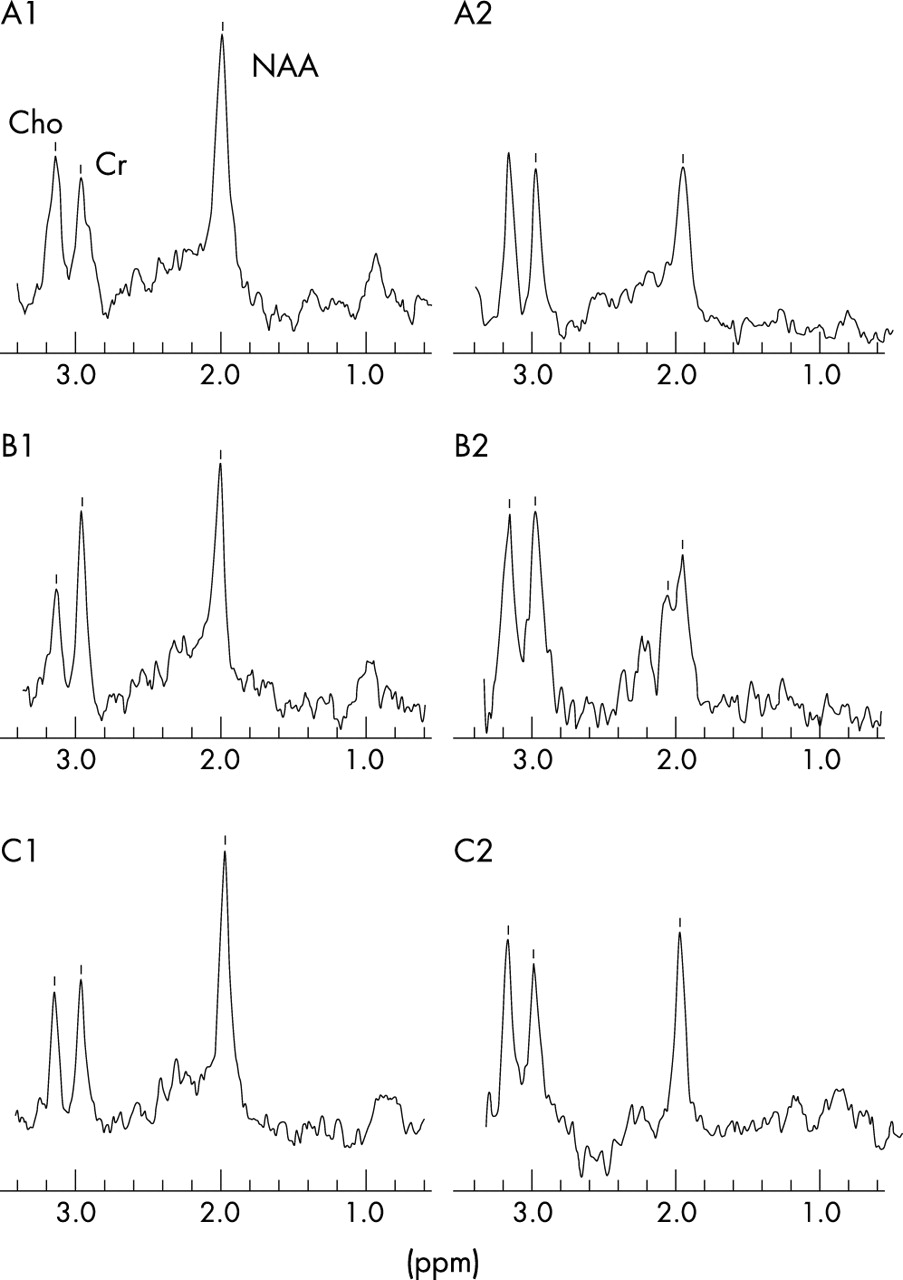
Representative 1H-MRS spectra from control and MSA subjects. A1, B1, and C1 represent spectra from a control subject’s pontine base, putamen, and cerebral white matter, respectively. A2, B2, and C2 represent spectra from those same three regions in an MSA patient. NAA, N-acetylaspartate; Cho, choline; Cr, creatine; MSA, multiple system atrophy; CWM, cerebral white matter.
Promiment NAA/Cr reduction in pontine base in both MSA-C and MSA-P
Significant reductions of NAA/Cr were evident in the pontine base, putamen, and CWM in MSA-C and MSA-P compared with controls (fig 3A–C). MSA-C patients showed a significant reduction of NAA/Cr in the pontine base (p<0.0001) and CWM (p = 0.02), but not in the putamen. MSA-P patients showed a significant reduction of NAA/Cr in the pontine base (p<0.0001) and putamen (p = 0.009) but not in the CWM. These observations indicate that the NAA/Cr reduction in the pontine base was significant in both MSA-C and MSA-P. Cho/Cr was not changed in MSA-P or MSA-C compared with controls.

Box and whisker plot of the NAA/Cr ratio. Horizontal lines indicate median values. Boxes extend from the 25th to the 75th percentile. A, B, and C respectively show NAA/Cr in the pontine base, putamen, and cerebral white matter, comparing MSA-C, MSA-P, and control subjects. *p = 0.02, **p = 0.009, and ***p<0.0001 by Scheffé’s test, respectively. NAA, N-acetylaspartate; Cr, creatine; Cho, choline containing component; MSA-C, multiple system atrophy with cerebellar ataxia predominant; MSA-P, multiple system atrophy with parkinsonism predominant.
Relation of NAA/Cr reduction in pontine base with disease phase, motor symptoms and MRI abnormalities in MSA
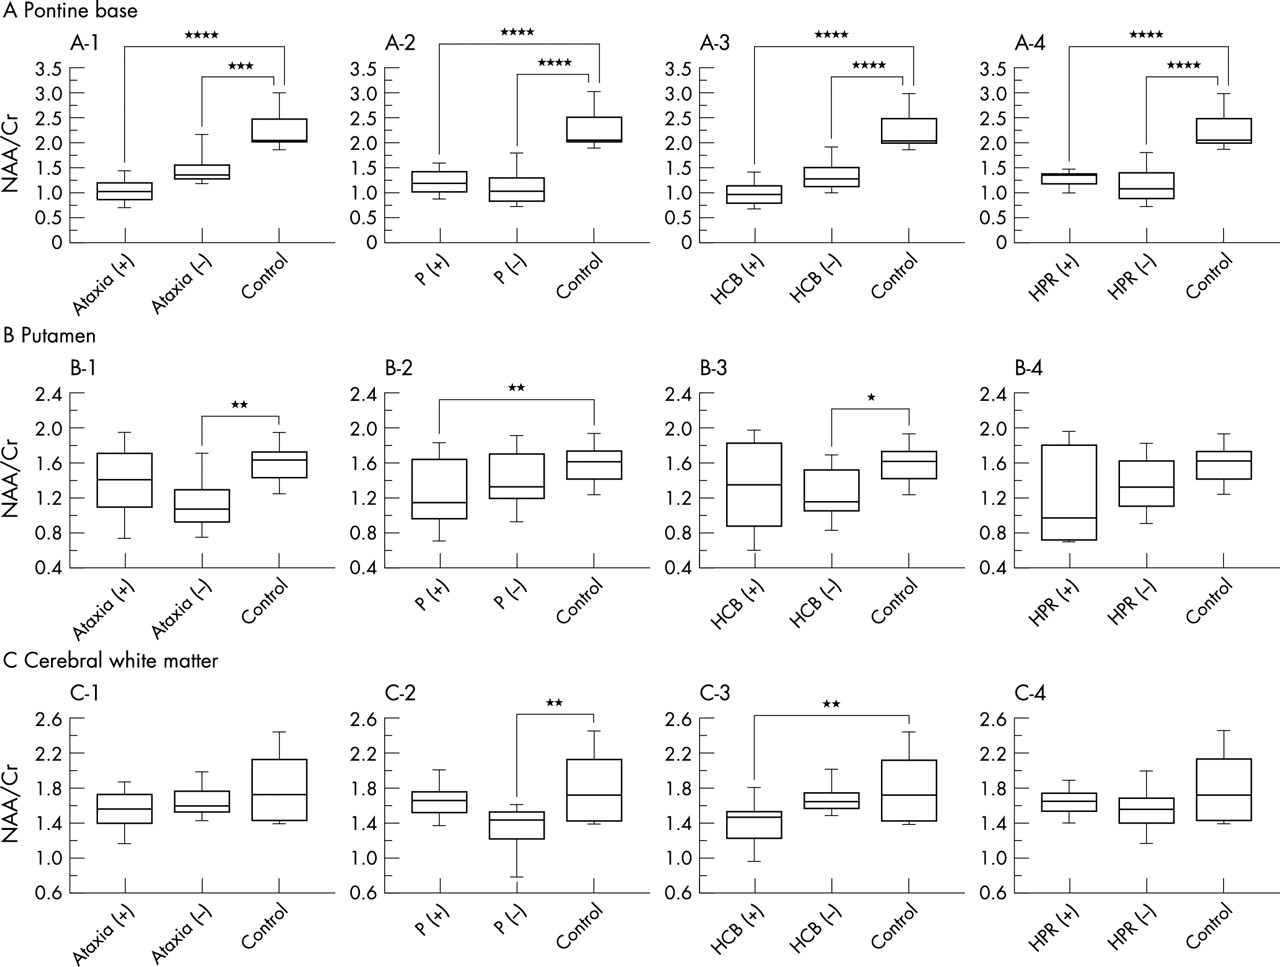
In terms of disease duration, the NAA/Cr reduction was most significant in the pontine base of patients with MSA even in an early phase of illness (fig 4). A tendency toward an inverse relationship between disease duration and NAA/Cr in the three regions was observed, but did not attain significance (pontine base: r = −0.24, p = 0.29; putamen: r = −0.32, p = 0.14; CWM: r = −0.41, p = 0.06). NAA/Cr in the pontine base was significantly reduced compared with controls even in patients who did not show ataxic symptoms (p = 0.0006, fig 5A-1). However, NAA/Cr in the putamen and white matter was not reduced in patients with ataxia (fig 5B-1, C-1). NAA/Cr in the putamen was markedly decreased in MSA patients with parkinsonism (p = 0.02, Fig 5B-2), whereas patients without it exhibited no significant reduction compared with controls. NAA/Cr reduction in the pontine base, on the other hand, was significant (p<0.0001) irrespective of parkinsonism (Fig 5A-2).

Correlation with duration of MSA of individual NAA/Cr ratios in the pontine base (A), putamen (B), and cerebral white matter (C). The shaded area corresponds to the mean (SD) of NAA/Cr in control subjects. NAA, N-acetylaspartate; Cr, creatine; CWM, cerebral white matter; MSA, multiple system atrophy.

NAA/Cr in the pontine base (A), putamen (B), and cerebral white matter (C) for MSA patients classified in terms of clinical features of ataxia (+ or −; A-1, B-1, C-1), parkinsonism (P; + or −; A-2, B-2, C-2), HCB on MRI (+ or −; A-3, B-3, C-3), and hyperintense putaminal rim (HPR) on MRI (+ or −; A-4, B-4, C-4). +, Presence; −, absence. *p = 0.047, **p = 0.02, ***p = 0.0006, and ****p<0.0001 by Scheffé’s test, respectively. NAA, N-acetylaspartate; Cr, creatine; MSA, multiple system atrophy; CWM, cerebral white matter.
The MRI revealed the HCB sign in the pontine base in eleven MSA patients (46%) and the HPR sign in six (25%). A significant reduction of NAA/Cr was seen in the pontine base even in patients without (p<0.0001) as well as in those with an HCB sign (p<0.0001; fig 5A-3). In the putamen and cerebral white matter, NAA/Cr values did not show any significant difference irrespective of the HCB sign (fig 5B-3, C-3). Moreover, NAA/Cr significantly decreased in the pontine base in patients both with and without HPR (fig 5A-4). NAA/Cr in the putamen and cerebral white matter did not show any significant differences irrespective of HPR signs (fig 5B-4, C-4). Cho/Cr had no significant relationship to ataxic, parkinsonism, or MRI abnormalities.
NAA/Cr in pontine base in MSA-P and PD
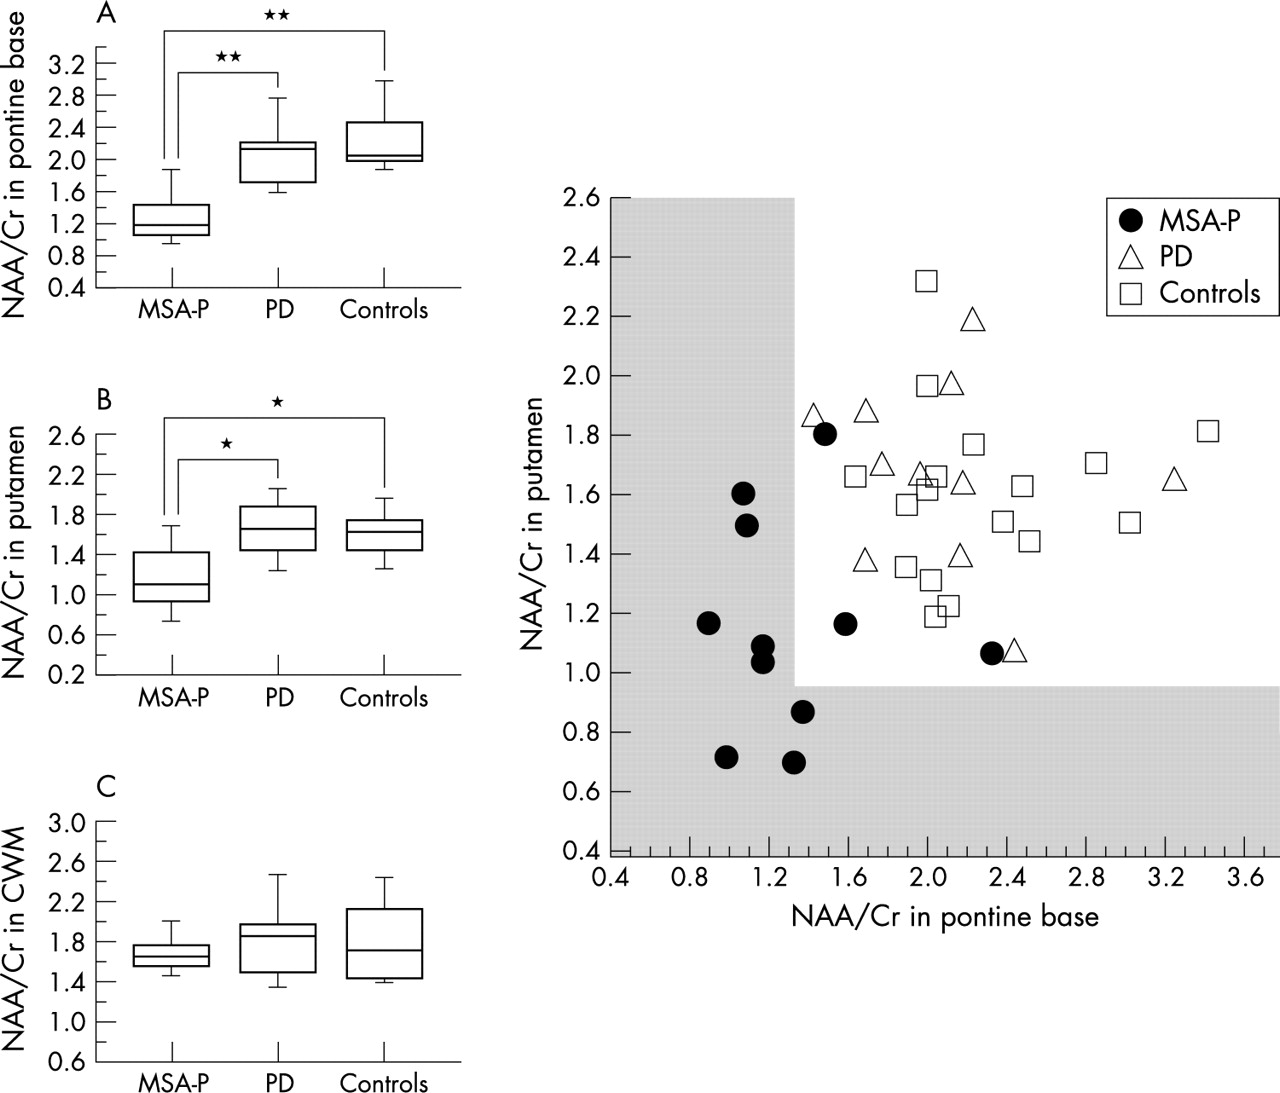
NAA/Cr reduction in the pontine base was highly significant in patients with MSA-P compared with both controls and PD (p<0.0001, p = 0.001; fig 6A). NAA/Cr in the putamen in MSA-P patients also showed a significant decrease compared with both controls and PD (p = 0.003, p = 0.002; fig 6B). No significant differences in NAA/Cr were noted in cerebral white matter between MSA-P and PD. These data indicate that the NAA/Cr reduction in the pontine base is a valuable marker to discriminate MSA-P from PD. In addition, combining individual NAA/Cr values for the pontine base and putamen further reduced the overlap between MSA-P and PD (fig 6D), suggesting that a combined assessment of the pontine base and putamen was more effective in discriminating between MSA-P and PD than individual area assessments. Cho/Cr did not display any significant changes in the pontine base, putamen or cerebral white matter.

Box and whisker plot of the NAA/Cr ratio in the pontine base (A), putamen (B) and cerebral white matter (CWM, C) compared between MSA-P, PD, and controls. D is a scatter plot of the individual NAA/Cr data in the pontine base v putamen including MSA-P, PD, and control subjects. The scaled area corresponds to the mean−2 SD of NAA/Cr in the pontine base and putamen of control subjects. *p = 0.002, **p<0.0001 by Scheffé’s test, respectively. NAA, N-acetylaspartate; Cr, creatine; MSA-P, multiple system atrophy with parkinsonism predominant.
DISCUSSION
We demonstrated widespread NAA/Cr reduction in the pontine base, putamen and in some cases, in the cerebral hemisphere, but no significant Cho/Cr alteration in patients with MSA using localised 1H-MRS at 3.0 T. In this study, absolute metabolite concentrations were not measured. However, the specific conditions that may change the total Cr signal, such as trauma, hyperosmolar conditions, hypoxia, stroke, and tumours, were not included. Age was matched among MSA, PD, and control groups. Moreover, quantitative studies did not show significant Cr changes between MSA patients and control subjects.1116 Thus, the reduction of the NAA/Cr ratio in the present study can be considered due to a selective decrease in NAA levels.
NAA has been immunohistochemically demonstrated to localise almost exclusively within neurones and axons,2728 but some in vitro studies have also detected NAA expression in mature, immature, and undifferentiated oligodendrocytes.2930 Nevertheless, according to a recent study, in vivo MRS measurements of NAA remain axon specific, with no oligodendrocytes, nonproliferating oligodendrocyte progenitor cells, or myelin contributing to detectable NAA in the mature CNS.31 This result supports the view that the widespread NAA/Cr reductions observed in this study ultimately reflect widespread neuronal and axonal involvement in MSA, although oligodendrocytes might influence the NAA levels to some degree.
The striking observation in this study is that the NAA/Cr reduction in the pontine base was the most significant among the three regions examined. That reduction was detected in the early phase of illness even in patients with no symptoms of ataxia or parkinsonism, or in patients without MRI abnormality of the HCB sign. Moreover, the pontine NAA/Cr reduction was significant even in MSA-P patients. In addition, NAA/Cr reductions in the pontine base were seen even in patients with no HPR sign in the lateral putamen. These observations suggest that NAA/Cr reduction in the pontine base is an accurate diagnostic marker for MSA even in patients in an early stage and a pre-symptomatic phase of ataxia or parkinsonism. The diagnostic focus of 1H-MRS in MSA has been on the putamen,11–14 whereas our results unequivocally demonstrated that MRS abnormality can be detected sooner and more universally in the pontine base than in the putamen in the course of the disease. The question is why a significant NAA/Cr reduction can be detected more readily in the pontine base than in the putamen. One reason may be that neuroaxonal degeneration in the pons would be more extensive than in the putamen. As the pontine base consists of the axons and neurones specifically involved in MSA (for example fibres of cerebellar inflow and outflow, corticospinal tracts and transverse pontine tracts), subclinical involvement of such fibres could be detected as a reduction of NAA/Cr. Furthermore, because, as we demonstrated previously, MSA-C is significantly more prevalent in Japan than MSA-P, compared with white populations in the western countries,7 the cerebellar pontine system should be more profoundly involved in Japanese MSA patients. A second possibility is that the volume effect due to putaminal atrophy would ultimately include the neighbouring normal tissues in the VOI of the MRS, influencing the degree of the NAA/Cr reduction. As atrophy of the putamen is severe in certain patients, the size of the VOI is a limiting factor in 1H-MRS for maintaining an acceptable SNR. Such volume effects due to putaminal atrophy can result in conflicting data. Clarke and Lowry reported an absence of significant reductions in basal ganglionic NAA/Cr in MSA,16 precluding the use of NAA/Cr reductions in the striatum for differential diagnosis.18 Disease duration in their patients averaged 7.9 years.16 In contrast, mean disease duration in other reports showing significant NAA/Cr reductions in the striatum of MSA patients ranged from 3.2 to 4.5 years,11–14 similar to the duration in our patients. Because, with longer duration, putaminal atrophy in patients with MSA-P becomes more severe, discrepancies could be explained by differences in putaminal atrophy that can profoundly influence 1H-MRS results. By avoiding this volume effect, MRS for the pontine base would provide a more accurate diagnostic marker.
Discriminating clearly between MSA-P and PD has long been a diagnostic problem from both therapeutic and prognostic viewpoints. Putaminal NAA/Cr reduction was significant in MSA-P patients compared with PD and control subjects, as previously reported.11–14 However, as discussed above, the putaminal volume effect could influence the significance of putaminal NAA/Cr reduction, particularly in patients with advanced disease. Although brainstem and cerebellar involvement is an important and specific finding in differentiating MSA-P from PD,2632 the sensitivity of both clinical and MRI evaluations of these abnormalities is relatively low.726 Based on our results, we believe that 1H-MRS assessment of the pontine base would be of considerable value in the differential diagnosis between MSA-P and PD. However, combined 1H-MRS study of the pontine base and putamen can provide a more sensitive differentiation between MSA-P and PD than a conventional single regional study, such as that of the putamen.
The cerebral hemisphere is involved more extensively in MSA than previously believed. Recently, Abe et al reported a significant decrease in NAA/Cr in MSA, involving Brodmann’s areas 6, 8, and 46.14 Moreover, Spargo et al reported 18.7% and 21.4% neuronal loss in the primary and supplementary motor cortex, respectively.33 In addition, the degree of atrophy in cerebral hemispheric areas varies between individuals, often becoming severe in long standing cases.34 We found a mild overall reduction of NAA/Cr in CWM with a more significant NAA/Cr reduction in the subgroup with a longer duration of illness. This finding is in good agreement with previous 1H-MRS reports and pathological observations.
Davie et al11 reported a significant reduction of Cho/Cr ratio suggesting reduced membrane turnover in the lentiform nucleus in MSA, perhaps as result of cell loss. In the present study, Cho/Cr showed little change throughout the course of disease in the putamen, pontine base, and CWM, in agreement with other reports.12–1416 The relevance of this discrepancy is uncertain. One possible explanation is the difference of technical factors such as size of VOI and echo time. On the other hand, pathological study shows not only cell loss but also widely and variously distributed myelin degeneration in MSA brains that may increase the Cho.35 Thus, heterogeneity of lesions in association with disease stage also may influence the Cho/Cr result. Further longitudinal studies and comparison of 1H-MRS with histological findings will be needed to clarify the uncertainty as to the Cho/Cr ratio in MSA.
In conclusion, localised 1H-MRS at 3.0 T in multiple regions showed widespread neuronal and axonal involvement in patients with MSA. NAA/Cr reduction in the pontine base provided a significant diagnostic marker for MSA irrespective of the disease form of MSA-P or MSA-C, disease duration, symptomatic manifestations, or MRI abnormalities. Moreover, combined 1H-MRS study of the pontine base and putamen proved particularly effective in differentiating MSA from PD. We believe that 1H-MRS would provide an early and accurate MSA diagnosis, an enhanced understanding of its pathogenetic mechanism, and the conclusiveness needed for future therapeutic trials.
REFERENCES
Footnotes
-
Competing interest: none declared