Article Text

Abstract
Objectives: To analyse grey matter changes in early stages of Huntington’s disease using magnetic resonance imaging (MRI) and the technique of voxel based morphometry (VBM).
Methods: Forty four patients with a molecularly confirmed clinical diagnosis of Huntington’s disease based on the presence of motor signs were included in the study. Patients were clinically rated using the Unified Huntington’s Disease Rating Scale; all were in early clinical stages of the disease (that is, Shoulson stages I and II). High resolution volume rendering MRI scans (MP-RAGE) were acquired. MRI data were volumetrically analysed in comparison to an age matched normal database by VBM, using statistical parametric mapping (SPM99).
Results: In Huntington’s disease, robust regional decreases in grey matter density (p<0.001, corrected for multiple comparisons)—that is, atrophy—were found bilaterally in striatal areas as well as in the hypothalamus and the opercular cortex, and unilaterally in the right paracentral lobule. The topography of striatal changes corresponded to the dorso-ventral gradient of neuronal loss described in neuropathological studies. Stratification according to clinical severity showed a more widespread involvement extending into the ventral aspects of the striatum in the group of more severely affected patients.
Conclusions: The topography of cerebral volume changes associated with Huntington’s disease can be mapped using VBM. It can be shown that cerebral grey matter changes co-vary with clinical severity and CAG repeat length.
- Huntington’s disease
- magnetic resonance imaging
- striatum
- voxel based morphometry
- CAG, cytosine-adenosine-guanosine
- SPM, statistical parametric mapping
- TFC, total functional capacity
- UHDRS, Unified Huntington’s Disease Rating Scale
- VBM, voxel based morphometry
Statistics from Altmetric.com
- CAG, cytosine-adenosine-guanosine
- SPM, statistical parametric mapping
- TFC, total functional capacity
- UHDRS, Unified Huntington’s Disease Rating Scale
- VBM, voxel based morphometry
Huntington’s disease is a monogenetic neurodegenerative disorder clinically characterised by progressive involuntary movements (for example, chorea), cognitive impairment, and behavioural disturbances. At the molecular level, Huntington’s disease is caused by an expanded trinucleotide (cytosine-adenosine-guanosine, CAG) repeat on chromosome 4 within the coding region of the Huntington gene.1 At necropsy, there is widespread neuronal degeneration, macroscopically most obvious in the striatum (the caudate nucleus and putamen).2,3 Striatal neuronal loss and fibrillary astrocytosis have a characteristic topographical distribution, starting in dorsal and caudal striatal subregions and then, with progression of the disease, moving in a caudo-rostral and dorso-ventral direction. On coronal sections, dorsal subregions of the striatum consistently show more extensive neuronal loss than ventral areas.4 As well as the striatal changes, the brains of patients with Huntington’s disease show atrophy of variable severity in the cerebral cortex, other basal ganglia structures, thalamus, white matter, and cerebellum.2
In vivo investigations of gross pathological changes using magnetic resonance imaging (MRI) raise the possibility of analysing the topography of volume alterations. Previous volumetric imaging studies in patients with this disease were conducted to analyse volume changes in predefined cerebral regions, particularly in the basal ganglia, and showed significant decreases in striatal volumes.5–8 All but one (Thieben et al9) of the volumetric imaging studies conducted so far have in common that preselected cerebral subregions were measured. Voxel based morphometry (VBM), as described by Ashburner and Friston,10 was applied in the present cross sectional study, thus avoiding biases inherent in operator dependent volumetric techniques by using an automated segmentation procedure and standardised parametric statistics in comparison with a normal database. This technique for the morphometric group analysis of three dimensional MRI data has proved to be a powerful tool for analysing changes in grey or white matter density of the brain since its introduction in 1995.11
Our aim in this morphometric study in early Huntington’s disease using VBM was to establish the topography of robustly detectable cerebral volume changes within and outside the striatum with a voxel based level of resolution, contrasting a group of patients with Huntington’s disease and age matched controls. In addition, we addressed the question of whether the extent and topography of grey matter atrophy was dependent on the severity of symptoms and signs in our sample of patients.
METHODS
Patients
Forty four patients with a clinical diagnosis of Huntington’s disease based on the presence of motor signs and confirmed by genetic testing were included in the study (21 men and 23 women). MRI data on nine additional patients were acquired but were not used because motion artefacts reduced the quality of the images. The study was approved by the local ethics committee and all patients gave their written informed consent.
All the patients included in the study were in the early clinical stages of Huntington’s disease—that is, stages I and II according to Shoulson et al.12,13 They were ambulatory and independent. Their mean (SD) age was 44.7 (10.7) years (range 25 to 66). None of them suffered from any additional clinically relevant disorders, and none was being treated with neuroleptic compounds or dopamine depleters such as tetrabenazine at the time of the studies. The clinical ratings reported here thus reflect primarily the clinical severity of the illness. Patients were rated within one week of scanning by two experienced neurologists, using the motor and cognitive scores of the Unified Huntington’s Disease Rating Scale (UHDRS)14 and the total functional capacity score (TFC).12
An age matched normal database was set up by acquiring three dimensional MRI data from 22 healthy volunteers (10 men and 12 women). The mean age of the volunteers was 44.1 (16.9) years (range 25 to 68). All volunteers were neurologically and neuropsychologically normal; none had any history of neurological or psychiatric disease or other medical conditions.
Data acquisition
High resolution MRI data were acquired on a 1.5 Tesla clinical scanner with a standard quadrature headcoil (Siemens, Erlangen, Germany). Three dimensional datasets of the whole head were collected using a T1 weighted, magnetisation prepared, rapid acquisition gradient echo (MP-RAGE) sequence, consisting of 160 to 180 sagittal partitions depending on head size (repetition time, 9.7 ms; echo time, 3.93 ms; flip angle 15°; matrix 256×256 mm2; field of view, 250 mm).
Data processing
All MRI data (from both the Huntington’s disease patients and the normal database) were processed using methods implemented in the statistical parametric mapping software (SPM99, Wellcome Department of Cognitive Neurology, London, UK).15 Voxelwise morphometric data analysis (VBM) was carried out according to the principles described by Ashburner and Friston10,16 and Good et al.17 All MRI data were spatially normalised to the same three dimensional stereotaxic space using the statistical parametric mapping (SPM99) routine (12 parameter affine registration followed by a non-linear registration) and a customised study specific template according to Good et al.17 Further data processing included automatic segmentation (into grey matter, white matter, and cerebrospinal fluid). The data were then smoothed using a 6 mm full width at half maximum (FWHM) isotropic Gaussian kernel, as the size of the smoothing kernel should be comparable to the size of the regional differences between groups,18 and—judging from the differences in mean grey matter images (see fig 1)—this relatively small kernel was regarded as appropriate. Following the suggestions of Good et al,18 both global mean voxel value and the total amount of grey matter were included separately as confounding covariates in an analysis of covariance (ANCOVA) in two different analytic approaches.

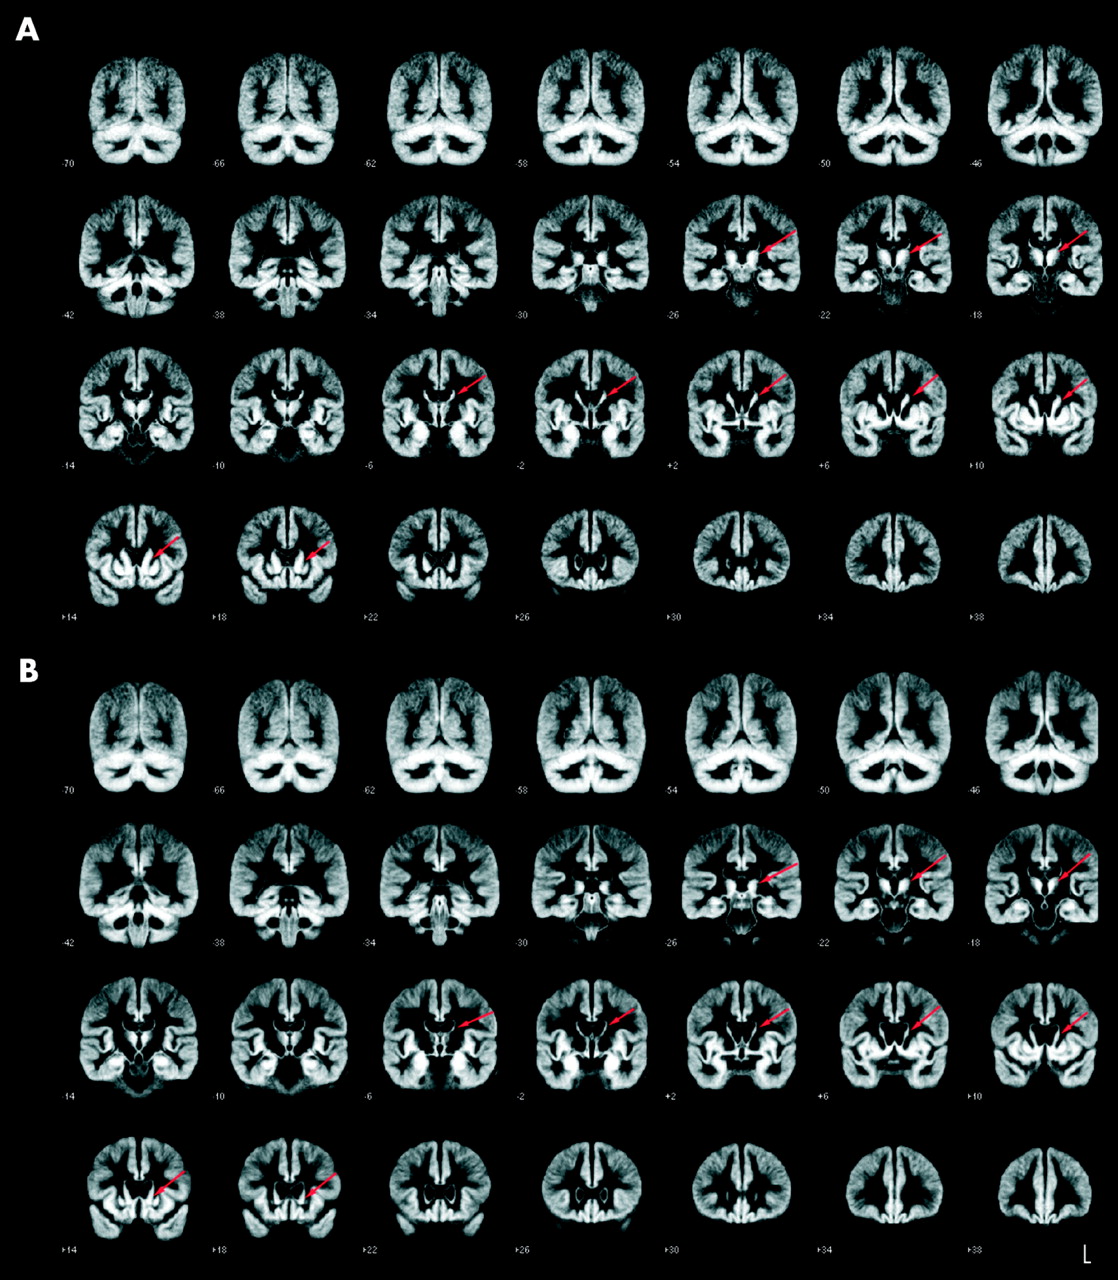
Mean images of the grey matter fractions after normalisation and segmentation, displayed as range of slices covering the brain in coronal view from stereotaxic coordinates y = (−70) mm to y = +38 mm, slice thickness 4 mm. (A) Mean image of the controls (n = 22). (B) Mean image of the Huntington’s disease patient group (n = 44). The areas displaying the most obvious differences in volume are marked by red arrows.
The segmentation algorithm implemented in SPM99 uses a modified mixture model cluster analysis technique based on voxel signal intensities. After segmentation and smoothing, the image partitions contain the average concentration of grey matter from around the voxel, where the region around the voxel is defined by the smoothing kernel. This is usually referred to as “grey matter density,” although it should not be confused with cell packing density measured cytoarchitectonically.
To check for general differences and to control for basal ganglia misclassification problems, mean grey matter images were calculated for the patient and the control group, respectively, using the appropriate algorithm within SPM99. In a visual comparison of the two groups, these mean images show marked volume decreases in the putaminal and caudate areas in the Huntington’s disease patients; the mean images of controls and patients are illustrated in fig 1 (in coronal view).
In the VBM analysis, the grey matter images of the patients with Huntington’s disease were then statistically compared with the grey matter images of the age matched normal database in a parametric group analysis to detect whether each voxel had a greater or lesser grey matter density than the controls. The resulting parametric maps were transformed to normal distribution, corrected for multiple comparisons, and thresholded at a probability (p) value of <0.001 and a voxel cluster size of 54. The coordinates of significant foci derived from the MNI template were transformed using the appropriate algorithm (http://www.mrc-cbu.cam.ac.uk/Imaging/mnispace.html) and are given in standard stereotaxic space using the three dimensional coordinate system of Talairach and Tournoux. After this voxel based comparison of the grey matter segments, the white matter segments were analysed in the same way.
Covariance and subgroup analyses
To visualise the influence of individual patient characteristics on the degree of the cerebral atrophy, we undertook additional VBM and covariance analyses using three criteria known from previous studies to influence the severity of the disease and the degree of neurodegeneration: CAG repeat number,8,19 cognitive symptoms,20 and motor symptoms.21 Cognition and motor symptoms were quantified using the corresponding subscores of the UHDRS. Two different approaches were applied.
First, a covariance analysis (ANCOVA) of the whole patient group was done using SPM99, including cognitive and motor UHDRS subscores, with CAG repeats, age, and total grey matter volumes as covariates. The subsequent steps of postprocessing were the same as described above. ANCOVA for three striatal subregions as well as one extrastriatal cortical cluster (paracentral lobule) was also calculated using multifactorial analysis of covariance within the Statistical Package for the Social Sciences software (SPSS version 9.0, Chicago, Illinois, USA), including cognitive and motor scores as covariates.
Second, subgroups of the patient cohort were formed: for each criterion, groups of 12 patients consisting of the most severely and the least severely affected, respectively, were chosen—that is, the patient group least affected on the motor score (motor–mild, scoring low on the motor scale) and the group most severely affected on the motor score (motor–severe); the cognitively least affected patients (cognitive–mild, obtaining the highest scores on the cognitive scale) and the cognitively most affected patients (cognitive–severe); and finally the patients with the lowest number of CAG repeats in the mutant allele (CAG–low) and the patients with the highest number of CAG repeats (CAG–high).
MRI data were compared with a control group using VBM in the same way as for the entire patient group. The control groups consisted of 15 subjects from the normal database, chosen to be age matched for the corresponding subgroup as some of the subgroups differed in age from the group as a whole. The mean ages, mean duration of disease (time from symptom onset), and mean values of the CAG repeat numbers, motor scores, and cognitive scores for all six subgroups (and the total patient group/normal database) are summarised in table 1. Statistical differences between subgroups with respect to the particular criterion were calculated (using the F test); differences were considered significant at p<0.05. The three variables analysed (motor score, cognitive score, CAG repeat number) were interdependent; thus patients with high motor scores tended to display low cognitive score and vice versa. In addition, patients in the CAG–high group had a more severe clinical phenotype.
Demographic, clinical, and molecular biological data of the Huntington’s disease patients and controls
RESULTS
Clinical data
In the Huntington’s disease group, the mean (SD) number of CAG repeats in the mutant allele was 45.5 (7.8), as tested by two independent sets of primer pairs. The mean interval between onset of motor symptoms and imaging was 5.1 (3.3) years. On the motor subscore of the UHDRS, the mean value for the patients was 24.1 (12.1), range 3 to 47; on the summed cognitive score, the mean value was 196.6 (63.1), range 120 to 364. These data are shown in table 1. The mean value for the TFC was 10.9 (1.4). Twenty five patients had a TFC value of ⩾11, corresponding to stage I according to Shoulson et al,12 and the remaining 19 patients had TFC values of 8 to 10, corresponding to the upper range of stage II.
Imaging data of the group analysis
Comparing the Huntington’s disease patients and the control population using VBM, regional decreases in grey matter density of high significance were found (thresholded at p<0.001 after correction for multiple comparisons). No regional increases in grey matter density were observed (p<0.001, corrected). The use of global mean voxel value and total amount of grey matter, respectively, as confounding covariates produced almost identical results.
The areas with the highest z scores, indicating the most robust changes throughout the brain, were the striatal regions (table 2). Within the striatum, the caudate nuclei contained the areas that included the highest z score values, the maximum being located in the area of the right anterior caudate nucleus. The largest voxel clusters of significantly decreased grey matter density, indicating atrophy, were localised in the striatum (fig 2). Striatal changes were bilateral and almost symmetrical in the caudate nucleus and the putamen. With respect to the caudate nucleus, the entire anatomical structure, including head, body, and tail, contained altered voxels; however, areas of reduced grey matter density were consistently observed in the dorsal subregions, whereas the ventral aspects were relatively spared—in particular in the anterior region of the caudate nucleus. Similarly, areas of reduced grey matter density were observed in the putamina, with the maximum alterations localised in the dorsal aspects. The Talairach coordinates and z scores of the highest significant voxels within the striatum are summarised in the upper part of table 2.
Synopsis of the results of the voxel based morphometry group analysis

Results of voxel based morphometric analysis of the entire group of Huntington’s disease patients v entire group of controls. All regions are shown where the Huntington patients (n = 44) had a significantly decreased grey matter density compared with the normal controls (n = 22) at p<0.001, corrected for multiple comparisons. (A) Maximum intensity projection of all areas with significantly decreased grey matter in the statistical parametric mapping (SPM) group analysis as an overlay on the SPM standard glass brain template (sagittal, axial, and coronal view). The global maximum (located in the right caudate nucleus) is marked by the red arrowhead. (B) Slice sections of the overlay of significantly atrophic areas derived from the group analysis on slice sections of an individual three dimensional brain of a patients with Huntington’s disease (sagittal, axial, and coronal view), showing alterations in the dorsal and ventral caudate and the putamen. The blue crosshair is located in the head of the right caudate corresponding to the global maximum. The z score is indexed by the colour bar. (C) Display of the areas showing significantly decreased grey matter superimposed on the standard template as a range of slices in axial view, covering the whole brain (from stereotaxic coordinates z = (−23) to z = +65, slice thickness 2 mm). The z score is indexed by the colour bar. acc, nucleus accumbens; c, caudate; ct, caudate tail; dc, dorsal caudate; dp, dorsal putamen; hy, hypothalamus; p, putamen; thal, thalamus; vc, ventral caudate; vp, ventral putamen.
Outside the striatum, voxel clusters of decreased grey matter density indicating atrophy were localised in the operculum bilaterally and in the right hemispheric paracentral lobule and precentral gyrus. In addition, regionally decreased grey matter density with similarly high z score values could be found in the hypothalamus (see table 2 for the Talairach coordinates and z scores). In fig 2A, the maximum intensity projections of all areas with significantly decreased grey matter density are shown as an overlay on the SPM standard glass brain template; in fig 2B, the findings were superimposed on slice sections of the template; in fig 2C, the overlay of significant voxel clusters is displayed as a series of slices covering the entire brain.
In the voxel based analysis of the white matter segments, no significant white matter changes were found in the inverse contrast on the same statistical level as in the grey matter analysis (p<0.001, corrected for multiple comparisons). Using a less strict p value (p<0.05, corrected), only small voxel clusters appeared in the analysis of white matter, indicating that misclassification had no relevant effect on grey matter analysis.
Analysis of different degrees of severity/CAG repeat number
In order to assess the covariance of Huntington’s disease severity and grey matter density changes, an analysis of covariance (ANCOVA) was done within SPM99, including cognitive symptoms, motor symptoms, age, CAG repeat number, and total grey matter volume as covariates. The resulting statistical parametric maps were very similar to the results described above (fig 3). An ANCOVA was also done using mean values for four clusters of significant voxels representing striatal subregions (three clusters) and one extrastriatal region and motor/cognitive scores (SPSS software). This analysis showed positive correlations between striatal subregional clusters and cognitive scores (p<0.01) and negative correlations with motor scores (p<0.01), but no significant correlation with the extrastriatal region examined. Taken together, these findings suggest that scores of clinical severity correlate strongly with VBM findings.

Results of voxel based morphometric analysis (ANCOVA including cognitive symptoms, motor symptoms, age, CAG repeat number, and total grey matter volume as covariates): entire group of Huntington’s disease patients (n = 44) v entire normal database (n = 22). All co-varying regions of decreased grey matter density (p<0.001, corrected for multiple comparisons) are shown as a maximum intensity projection on the SPM glass brain template (sagittal, axial, and coronal view). The global maximum (located in the left caudate nucleus) is marked by the red arrowhead.
In a second approach to assess the influence of Huntington’s disease severity and CAG repeat number, respectively, on grey matter density changes, we split the group of patients into the six subgroups described in Methods (motor–mild/motor–severe, cognitive–mild/cognitive–severe, CAG–low/CAG–high). We then undertook an analysis of subgroups of patients presenting with either pronounced or more subtle clinical signs, reflected in the motor and cognitive subscores of the UHDRS, respectively. This analysis of different clinical stages showed marked differences between advanced and less advanced clinical stages, but no major differences in the changes associated with impairments of motor and cognitive function. The motor–mild subgroup analysis showed areas of grey matter density changes in the striatum with a maximum z score of 9.1. Again, alterations were restricted to dorsal areas (fig 4A). In contrast, the motor–severe subgroup analysis showed more robust (maximum z score 17.16) and more extensive striatal grey matter changes covering the entire dorsal and, to a more limited extent, ventral aspects of the striatum (fig 4B). Extrastriatal grey matter abnormalities were localised in the paracentral lobule in both groups. In the motor–severe group only, opercula on both sides and the hypothalamus contained significant voxels. Patients stratified for cognitive performance showed abnormalities similar to the ones described for the stratification according to motor impairment: cognitive–mild showed grey matter changes limited to the dorsal aspects of the striatum (maximum z score 9.76, fig 4C), whereas cognitive–severe showed larger clusters of reduced grey matter density extending to more ventral aspects of caudate nucleus and putamen (maximum z score 13.88, fig 4D). Both groups had extrastriatal atrophy in the hypothalamus; in the cognitive–severe subgroup atrophy was also present in the opercula, paracentral lobule, and thalamus.

Results of the voxel based morphometric analysis of the Huntington’s disease patient subgroups v age matched controls: panels A and B for the criterion motor deficits; panels C and D for the criterion cognitive deficits. All regions are shown where the corresponding subgroup (n = 12 each) had a significantly decreased grey matter density in comparison with an age matched group of normal controls (n = 15 each) at p<0.001, corrected for multiple comparisons. Overlay of areas where there are significant differences on slice sections of the statistical parametric mapping (SPM) brain template (sagittal, axial, and coronal views), showing the changes in the dorsal and ventral striatum. The z scores are indexed by the colour bars. The blue crosshairs illustrate the location of the maximum z score. The left panels show the results of the subgroup analysis of the clinically less affected subjects, contrasted with the right panels showing the results of the more severely affected patients: (A) subgroup motor–mild, (B) subgroup motor–severe, (C) subgroup cognitive–mild, (D) subgroup cognitive–severe.
Comparing a subgroup of 12 patients with the lowest number of CAG repeats in the mutant allele (CAG–low) with controls, at p<0.001 (corrected for multiple comparisons), only small voxel clusters of decreased grey matter density could be found, restricted to a small rim in the most dorsal aspects of the caudate nuclei and the putamen and sparing the ventral parts. In contrast, the patient cohort with the largest number of CAG repeats (CAG–high) showed far more extended voxel clusters of decreased grey matter density, covering in the anterior-posterior dimension the entire caudate nucleus and putamen and (on a coronal view) the dorsal two thirds of the striatum. Even in the CAG–high subgroup, ventral striatal subregions were spared. Extrastriatal atrophy was localised in the paracentral lobule and in the opercula in both groups.
DISCUSSION
This is, to our knowledge, the first application of VBM to the morphometric analysis of the brains of patients with early symptomatic Huntington’s disease. Our investigation extends previous non-invasive volumetric studies which used analysis of predefined regions to demonstrate the topography of the alterations. Although no a priori information was given, robust decreases in grey matter density were observed, largely confined to the striatum. Within the striatum, alterations were limited to the dorsal aspects of both caudate nuclei and putamina. Clinical stages with less pronounced signs in the motor and cognitive domain were associated with less robust and less extensive grey matter changes, suggesting a caudo-rostral and dorso-ventral gradient of volume loss. Similarly, the extent of the abnormalities was more pronounced with larger numbers of CAG repeats. Surprisingly, extrastriatal grey matter changes were restricted to a small set of voxel clusters in the hypothalamus and the cerebral cortex. The alterations in grey matter density probably reflect regional atrophy brought about by neuronal loss and neuronal volume changes,4,22 although we cannot rule out the possibility that grey matter density changes could occur for reasons other than neuronal loss (for example, changes in signal properties).23
In general, internal atrophy and expanding CSF spaces may influence VBM findings in areas adjacent to the ventricular system such as the basal ganglia, as described for instance in a VBM study on Alzheimer’s disease.24 However, in the present study an analysis of mean grey matter images after segmentation (fig 1) and the white matter morphometric analysis showed that the VBM findings in the caudate cannot be attributed to misclassification.
Within the striatum, the caudate nuclei were more affected than the putamina as they contained the areas including the highest z score values and also the largest clusters of significant voxels. The observation that the most robust and most extensive changes were observed in the caudate nucleus is in good agreement with a large necropsy study which showed neuronal loss and fibrillary astrocytosis within the caudate in all neuropathological stages.2 Decreased grey matter densities were observed in the putamen as well, although the z scores tended to be somewhat lower, suggesting a more variable involvement largely confined to the dorsal aspects. The topography of altered voxels within the striatum is in good agreement with necropsy case series of brains of different Huntington’s disease grades, reporting that in the early stages of the disease the neuronal loss and fibrillary astrocytosis is confined to dorsal and medial aspects of the striatum.4
Vonsattel et al have suggested a ventrodorsally and lateromedially increasing gradient of neuropathological abnormalities and proposed that neuronal loss progresses in a caudo-rostral and dorso-ventral direction.2,4 Our subgroup analysis data, stratified according to clinical severity, showed a similar characteristic topography, with changes confined to the dorsal and medial striatal subregions in the less severe stages, and an extension to the ventral and lateral regions in more severe stages. Moreover, the cerebral grey matter changes at different stages of severity were not only markedly different in spatial extension, but also in the robustness of the results (the amplitudes of the z scores). Although these results need to be confirmed by longitudinal studies, these cross sectional data support early basal ganglia changes in a dorso-ventral and medio-lateral direction, as suggested by Vonsattel et al.
Previous volumetric studies in Huntington’s disease8,25 showed that putaminal volume loss exceeded the volume loss in the caudate nucleus. The VBM approach does not result in absolute volumes of anatomically defined regions and does not allow calculation of asymmetry indices, so a comparison with previous volumetric MRI studies is difficult. In addition, altered voxels in VBM also reflect how consistently the volumetric changes can be found; thus some discrepancies between the extent of the absolute volume changes and the extent of the voxel clusters are to be expected.
The technique of VBM is operator independent and does not require a region or volume based approach, thus allowing the grey matter of the entire brain (and not only preselected regions) to be examined in a balanced way on a voxel by voxel basis.16 This technique is thus particularly appropriate for revealing extrastriatal areas of grey matter change. Only a small set of voxel clusters showed robust alterations in grey matter density confined to the hypothalamus and the cerebral cortex. Hypothalamic alterations were not described in previous volumetric studies. However, our finding is in good agreement with neuropathological studies reporting neuronal loss (up to 90%) and fibrillary astrocytosis in the hypothalamic lateral tuberal nucleus in five patients.26,27 The high z scores of the hypothalamic alterations support the view that atrophy of this area is a consistent feature of Huntington’s disease and is already present in the early stages of the disease.
Surprisingly, cortical atrophy was less prominent, less widespread, and less consistently observed in our patient cohort. Cortical areas showing atrophy in our study were located in the precentral gyrus and the paracentral lobule. These data are in agreement with a recent MRI study by Rosas et al,28 who investigated heterogeneous regional thinning of the cortical ribbon in Huntington’s disease and found the sensorimotor region to be statistically the most affected. Neuronal loss in these regions and in the opercular/insular areas, another cortical area where grey matter changes were robustly detected by VBM, were described, for instance, by Lange.29 Other cortical areas—for example, the prefrontal or occipital lobes—were not found to be significantly altered in our patients. However, in necropsy studies of Huntington’s disease, Sotrel et al reported a decrease in the cortical thickness in the dorsolateral prefrontal cortex,30 and Lange et al described a marked reduction in neuronal number in the occipital lobe.31 Our finding may be explained on the basis that even on neuropathological examination the degree to which neuronal loss can be observed in the cerebral cortex in Huntington’s disease varies considerably2; experienced neuropathologists blinded to the diagnosis and reviewing sections of cerebral cortex of affected patients and controls were unable to distinguish between them (Richardson EP, Vonsattel JP, personal communication). We therefore suggest that the high variability of cortical neuronal loss and volume changes preclude the detection of cortical alterations by VBM in areas other than opercular and pericentral areas. At the same time, our study emphasises a consistent volume loss in the insular cortex and asymmetrical changes in paracentral and pericentral cortical areas as an early feature of Huntington’s disease.
Interestingly, extrastriatal structures like the globus pallidus—which regularly shows a decrease in volume at necropsy in Huntington’s disease,31 as well as in a volumetric study including more advanced clinical stages6—did not contain grey matter changes. Volume loss in the globus pallidus might therefore occur only in the later stages of Huntington’s disease, or may represent a variable feature of the pathology. Thalamic neuronal loss and fibrillary astrocytosis involving the centromedian-parafascicular and the mediodorsal subnucleus was described, for example, by Heinsen et al.32
Stratification of patients according to CAG repeat length showed that the group with large CAG repeat numbers had more extensive striatal involvement, despite their younger age and similar duration of disease. This probably reflects the fact that patients in the CAG–high group had more severe motor signs and more extensive cognitive impairment—that is, a greater severity of illness appeared to be associated with a greater degree of atrophy. The observation of a correlation between CAG repeat length and the extent of the pathology is in good agreement with previous studies.8,19
CONCLUSIONS
The topography of cerebral volume loss associated with Huntington’s disease can be mapped using voxel based morphometry, resulting in an in vivo demonstration of the spatial gradients previously described in necropsy studies. An analysis of different stages of Huntington’s disease in this cross sectional study suggests that VBM may have the potential to monitor the progressive changes in the course of the disease in future longitudinal intervention studies.
REFERENCES
Footnotes
-
Competing interests: none declared