Article Text

Abstract
Background: Cerebral microbleeds, which result from microangiopathic changes following chronic hypertension, may reflect bleeding-prone microangiopathy. However, the distribution of these lesions has not been compared with that of lacunes, which represent occlusive type microangiopathy.
Objectives: To compare the cerebral distribution of microbleeds and lacunes and correlate their severity.
Methods: The study population comprised 129 hypertensive patients who underwent brain magnetic resonance imaging (MRI), including gradient echo (GE) sequences. Cerebral microbleeds were counted using GE-MRI data, and lacunes were also counted by comparing T1 and T2 weighted MRI. To investigate the distributions, the number of patients with each type of lesion was compared, and the occurrence index (the total number of the specific lesions divided by the total number of patients) was examined statistically. Correlation analyses were done on the relations between the different grades of microbleeds, lacunes, and leukoaraiosis.
Results: Cerebral microbleeds and lacunes were found at various foci in the brain, with a preference for the cortico-subcortical region and the deep grey matter. The occurrence index of microbleeds, but not of lacunes, was significantly higher in the cortico-subcortical region than in the deep grey matter. The severity of the microbleeds was positively correlated with the severity of lacunes, and both types of lesion were closely correlated with the degree of leukoaraiosis.
Conclusions: These data suggest that microbleeds and lacunes tend to occur to a similar extent in long standing hypertension, but not necessarily in the same locations.
- intracerebral haemorrhage
- mangetic resonance imaging
- angiopathy
- lacune
Statistics from Altmetric.com
Poirier et al classified lacunar infarcts into three types: those arising from small infarcts (type I), those arising as microbleeds (type II), and those resulting from a dilatation of the perivascular spaces (type III).1,2 Type I and type II lacunes are caused by microangiopathic changes, resulting usually from long standing hypertension, and can be detected by magnetic resonance imaging (MRI).3 T2* weighted gradient echo MRI (GE-MRI) has been used in many recent studies in order to detect microbleeds, which cause focal areas of marked signal loss owing to magnetic susceptibility. Focal haemosiderin deposits resulting from past bleeding lead to focal dephasing of the MRI signal, the sensitivity of which is enhanced by the gradient echo technique.4
Cerebral microbleeds are associated with chronic hypertension, advancing age, lacunar infarction, and white matter changes.5–7 We previously reported that they are predictive of the development of intracerebral haemorrhage, rather than infarction, in patients with no or mild leukoaraiosis, but not in those with advanced leukoaraiosis,8 and that low serum cholesterol is a major risk factor for microbleeds.9 A causal relation between microbleeds and intracerebral haemorrhage has been suggested.10–12 Recently, a distribution analysis conducted by Kinoshita et al indicated that microbleeds were present in the lentiform nucleus in 61 patients who experienced a haemorrhagic stroke (47%), in the thalamus in 54 (42%), in the cortico-subcortical region in 57 (44%), in the brain stem in 40 (34%), and in the cerebellum in 32 (25%).13 However, to the best of our knowledge, no comparative report has been published concerning the distribution and severity of lacunes and microbleeds. Chronic hypertension may cause microatheroma, lipohyalinosis, or microaneurysms, the locations of which cannot be determined by conventional computed tomography or MRI. Microbleeds and lacunes caused by these microscopic lesions are very small and occur multifocally in the brain; they indicate a bleeding-prone microangiopathy and an occlusive type of microangiopathy, respectively. Thus a comparison of these lesions could have great clinical significance.
In this study, we compared the spatial distribution of these lesions and undertook a correlation analysis using grading methods based on the numbers of lesions counted. We also did a correlation analysis to examine the relation between leukoaraiosis and the vascular lesions.
METHODS
Subjects
We examined prospectively a consecutive series of hypertensive patients from March 1997 to June 1999 at Seoul National University Hospital department of neurology, and identified 232 who underwent brain MRI, including GE-MRI. Hypertension was considered to be present if a subject had repeated blood pressure readings above 140/90 mm Hg at intervals of one week or more, or a previous history of hypertension and antihypertensive drug treatment.
To minimise the influence of acute lesions on the identification of microbleeds and lacunes, we did not include patients with large hemispheric infarcts (for example, a complete infarct in the territory of the middle cerebral artery). This is because signal loss lesions in large infarcts cannot be differentiated from haemorrhagic transformation. Patients with small haemorrhagic lesions of known or presumed pathogenesis (head trauma, arteriovenous malformation, cavernous angiomas) were also excluded from the analysis. We applied the Boston clinical criteria for cerebral amyloid angiopathy,14 and those patients with “probable” or “possible” lesions of this type were excluded from the study. Other exclusion criteria were previous neurosurgery, brain tumour, and medical illness resulting in a bleeding diathesis (for example, chronic liver disease or coagulation disorders).
After exclusions, 129 patients (78 men and 51 women; age 51 to 92 years (mean (SD) age, 65.6 (8.9) years)) took part in the study. The duration of hypertension was 8.3 (7.9) years, and mean systolic and diastolic blood pressures on admission were 155 (22) and 90 (15) mm Hg, respectively. Forty two patients had experienced an intracerebral haemorrhage, 33 had suffered an acute lacunar stroke, 20 had small territorial infarcts, and 34 had not had stroke but were suffering from dementia, headache, or Parkinson’s disease.
Brain MRI studies
MRI studies were done using a 1.5 tesla superconducting magnet (Signa, GE Medical Systems, Milwaukee, Wisconsin, USA). The standardised MRI protocol consisted of axial T2 weighted spin echo (repetition time (TR)/echo time (TE), 2500–4500/80–112 ms; flip angle, 20°; slice thickness, 5 mm; gap width, 2 mm), axial GE-MRI sequences (TR/TE, 200–500/15 ms; flip angle, 20°; slice thickness, 5 mm; gap width, 2 mm), and axial T1 weighted spin echo (TR/TE, 380–500/12–15 ms; flip angle, 20°; slice thickness, 5 mm; gap width, 2 mm).
Analysis of brain lesions
Microbleeds were defined as homogeneous round signal loss lesions with a diameter of up to 5 mm on GE-MRI (fig 1, panels A and B). Hypointense lesions within the subarachnoid space and areas of symmetrical hypointensity of the globus pallidus on GE-MRI were considered likely to represent adjacent pial blood vessels and calcifications, respectively, and were therefore not included. Lacunes were defined as small hyperintense lesions on T2 weighted images, with a corresponding distinctive low intensity area on T1 weighted images (fig 1, panels C and D). The locations of the microbleeds and lacunes were categorised by cerebral region (cortico-subcortical, basal ganglia, thalamus, brain stem, and cerebellum).

Representative slices showing microbleeds and lacunes. T2* weighted gradient echo magnetic resonance images showing a single microbleed (black arrowhead) in the left thalamus (A), and multiple scattered microbleeds in the brain (B). An old lacune was identified in the right basal ganglia as a small hyperintense lesion (white arrowhead) on the T2 weighted image (C) and a corresponding hypointense area (black arrowhead) on the T1 weighted image (D).
When doing this study, we used two different methods to scrutinise the incidence of the lesions. In the first, we undertook a region by region comparison of the numbers of patients with lacunes or microbleeds. In the second, the comparison was based on the “the occurrence index”—that is, the total number of specific lesions divided by the total number of patients—for each region. We also carried out a comparative analysis of the severity of the lesions. We classified the degree of severity as absent, mild (total number of microbleeds, 1–5), moderate (6–15), or severe (>15), because the number of microbleeds was not distributed normally (Kolmogorov-Smirnov test; p<0.001). For the same reason, the grades of the lacunes were also grouped as being absent, mild (1–3), moderate (4–10), or severe (>10). On T2 weighted spin echo images, leukoaraiosis was classified as being either absent or present as a punctate, early confluent, or confluent abnormality, according to the method proposed by Fazekas et al.15
Statistical analysis
Frequencies of microbleeds or lacunes were compared according to diagnostic subgroup by Pearson’s χ2 tests. To compare the occurrence indices among the regions, we used the Mann–Whitney U test. Spearman’s correlation analysis was employed to determine the correlations between the degree of leukoaraiosis, microbleeds, and lacunes. Statistical significance was set at a probability (p) level of <0.05 level. Statistical analyses were done using SPSS version 9.0 for Windows software.
RESULTS
Seventy two patients (55.8%) had microbleeds (45 men, 27 women), and 110 (85.3%) had lacunes (71 men, 39 women). In the 42 patients with intracerebral haemorrhage, microbleeds were identified in 36 (85.7%) and lacunes in 39 (92.9%). The number of microbleeds per patient ranged from 1 to 93 (mean 5.8 (14.5)), while the number of lacunes ranged from 1 to 17 (4.9 (4.7)).
Prevalence of microbleeds and lacunes
The numbers of patients with lacunes or microbleeds and their distributions are given in table 1. Microbleeds occurred most often in the cortico-subcortical area, while lacunes were most common in the basal ganglia. The cerebellum was the site least affected by both types of lesion. Subgroup analysis is showed in table 2. There was no significant difference between the diagnostic groups (microbleeds, p = 1.000; lacunes, p = 0.878).
Prevalence of microbleeds and lacunes at different sites
Frequencies of microbleeds and lacunes according to diagnostic subgroup
Occurrence indices of microbleeds and lacunes
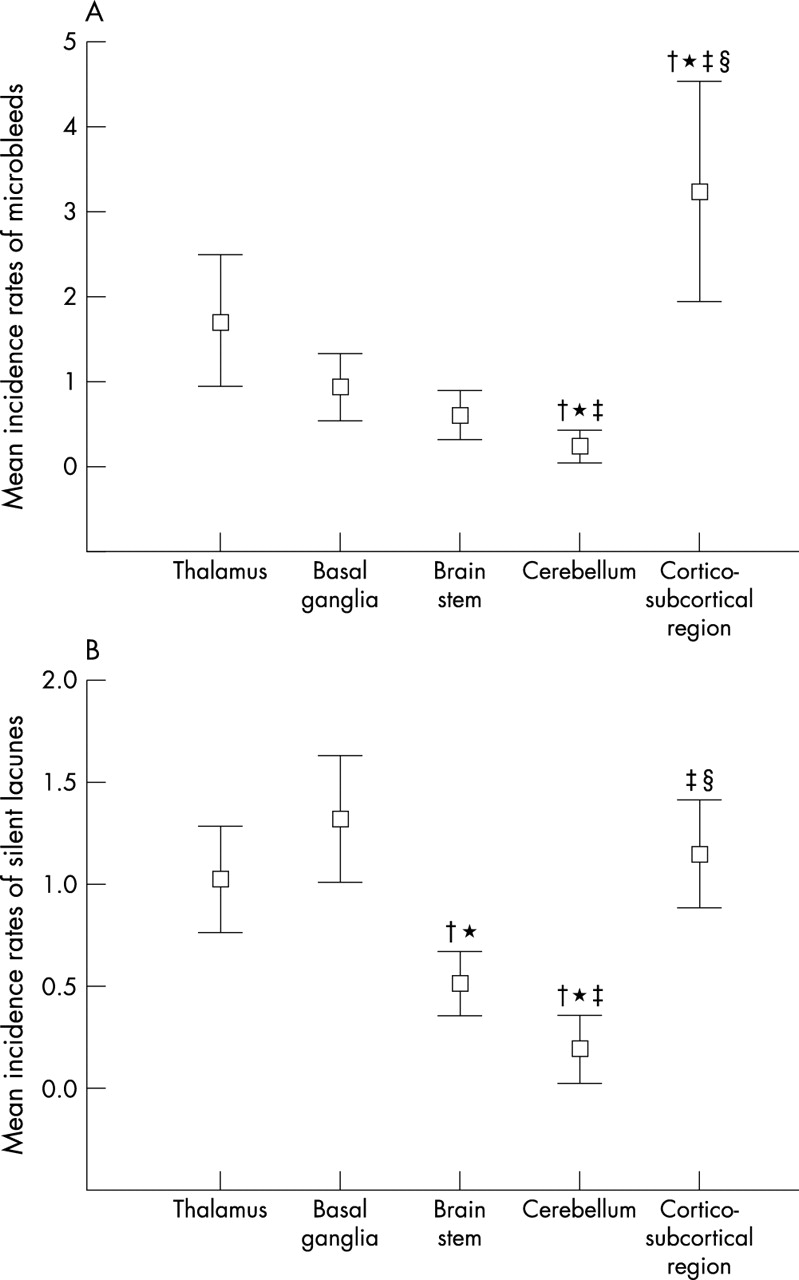
The occurrence indices of the microbleeds are shown in fig 2A and table 3. The occurrence index of microbleeds was significantly higher in the cortico-subcortical region (mean (SEM), 3.21 (0.65)) than in any of the other regions. The occurrence index in the thalamus (1.72 (0.39)) was the next highest, but this value was not significantly different from that in the basal ganglia (0.95 (0.20)) or the brain stem (0.61 (0.14)). The cerebellum (0.24 (0.09)) had the lowest incidence among all the regions examined.
Comparisons between occurrence indices of microbleeds and lacunes

Occurrence indices of microbleeds (A) and lacunes (B) in specific locations. The occurrence indices were examined statistically using the Mann–Whitney U test. Data are means, error bars = ±2 SEM. †p<0.05 v the values in the thalamus;*p<0.05 v the values in the basal ganglia; ‡p<0.05 v the values in the brain stem; §p<0.05 v the values in the cerebellum.
With respect to the lacunes, the cortico-subcortical region (mean (SEM), 1.20 (0.13)), basal ganglia (1.33 (0.15)), and thalamus (1.01 (0.13)) had higher occurrence indices than the brain stem (0.52 (0.08)) and cerebellum (0.20 (0.08)). However, there were no significant differences between the occurrence indices in the cortico-subcortical region, the basal ganglia, and the thalamus (fig 2B). The lowest occurrence index of lacunes was observed in the cerebellum, where the value was similar to that of microbleeds in the same region.
Correlation between microbleeds, lacunes, and leukoaraiosis
According to the grading system that we established for microbleeds, 13 patients were classified as severe, 19 as moderate, and 40 as mild. With respect to the lacunes, 15 patients were classified as severe, 41 as moderate, and 53 as mild. There was a significant positive correlation between the grades of microbleeds and the grades of the lacunes (Spearman’s correlation coefficient: r = 0.408, p<0.001). The grades of leukoaraiosis were positively correlated with those of the microbleeds (r = 0.469, p<0.001), and also with those of the lacunes (r = 0.456, p<0.001).
DISCUSSION
We found that both microbleeds and lacunes were most common in the cortico-subcortical region and in the areas of deep grey matter, including the thalamus and the basal ganglia. The occurrence index of microbleeds was highest in the cortico-subcortical region, while lacunes had similar occurrence indices in the cortico-subcortical region and the deep grey matter. Correlation analysis showed that the severity of microbleeds was closely related to the severity of lacunes, and the severity grades of the two types of lesion were correlated with the severity of leukoaraiosis. Thus both types of lesion may be caused by hypertension to a similar extent, but showed different lesion densities according to cerebral location. To our knowledge, this is the first study comparing the spatial distributions of cerebral microbleeds and old lacunes.
The frequency of microbleeds ranges from 4% to 80% in the various subject groups, as reported previously5–7,10–13,16,17; however, since the introduction of GE-MRI, microbleeds have been shown to occur in about 50% of cases of primary intracerebral haemorrhage. In our present study we found a higher detection rate than in earlier reports (55.8% in the patients with hypertension; 85.7% in hypertensive patients with primary intracerebral haemorrhage). Our hypothesis of why this should be is as follows. First, our subject group was confined to patients with hypertension, which is the most important risk factor for microbleeds, so the number of patients with such lesions would be expected to be relatively large. Second, it is possible that some of the patients in our study had relatively severe hypertension in comparison with other studies, while epidemiological conditions also need to be taken into account (for example, the fact that intracerebral haemorrhage occurs more often in far east Asia than in Western countries). Our results correspond closely to the figure of 56% reported in hypertensive patients in Japan.16 Third, we excluded patients with large territorial infarcts which may interfere with the analysis of microbleeds. As the incidence of microbleeds is higher in patients with intracerebral haemorrhage than in those with infarcts, exclusion of the latter may have increased the relative proportion of microbleeds in our study. All these factors would be expected to influence the results of lacunes in a similar manner.
In our study, the occurrence index of the lesions was found to be highest in the cortico-subcortical region. This is important, because it has been reported that the histopathological finding of microbleeds is closely associated with intracerebral haemorrhage,16,18 which suggests that microbleeds may be lesions that precede intracerebral haemorrhage. However, it is generally accepted that the site most commonly affected by intracerebral haemorrhage is the basal ganglia,19–25 while overall it appears that susceptibility to microhaemorrhage may be greatest in the cortico-subcortical area. This discrepancy was also demonstrated in a recent distribution analysis by Roob et al.7 The regional discrepancies between microbleeds and intracerebral haemorrhage and their mechanism need to be confirmed in a future study.
Our study included hypertensive patients with various neurological diseases, but was limited to those admitted to the department of neurology in our hospital. Although most of the patients had experienced an acute stroke, 34 who had never had a stroke were included in the study. There was a higher detection rate for microbleeds in the stroke subgroup than in the subgroup containing the patients with hypertension only. To the best of our knowledge, however, there has been no previous report that these subgroups show any differences in the distribution of microbleeds. A recent study by Kinoshita et al indicated that there was no significant difference in the location of microbleeds between haemorrhagic and multiple lacunar stroke groups,13 and we also found no difference between our groups with ischaemic stroke, haemorrhagic stroke, or no history of stroke, neither was there any difference between the groups with respect to lacunes. Thus we believe that, in terms of the distribution of the various diagnostic subgroups, our comparative analysis should not have been influenced by the composition of the study population.
The pathological findings that are representative of hypertensive microangiopathy are lipohyalinosis, microatheroma, and Charcot–Bouchard microaneurysm,26–28 which are all closely associated with lacunes, microbleeds, and intracerebral haemorrhage.26,27,29–31 Recent correlative pathological studies16,18 showed that the microbleeds observed on GE-MRI were focal haemosiderin deposits associated with moderate to severe arteriosclerotic vessels, and suggested an association with intracerebral haemorrhage. Microbleeds were also reported to accompany the lacunes and white matter hyperintensities in T2-MRI scans.4–7,11,16 However, these studies did not analyse the correlation between the degree of severity of lacunes and microbleeds. Our results show that the degree of severity of lacunes and microbleeds correlated well between the different types of lesion, and that they were closely associated with leukoaraiosis on T2 weighted MRI. Because leukoaraiosis has multiple causes, it is difficult to determine how it is related to microbleeds in the cerebral vasculature. A recent report32 on the positive relation between left ventricular hypertrophy and leukoaraiosis suggests that leukoaraiosis may be associated with the severity or duration of hypertension. Our findings therefore suggest that microbleeds may be the result of, and be a potential marker for, hypertensive microangiopathy. However, the distributional differences observed for lacunes have yet to be explained. Each cerebral area may have a different susceptibility to the causative pathological lesions resulting from hypertension (for example, lipohyalinosis or microaneurysm), but this hypothesis needs to be examined in future pathological studies.
Conclusions
We have shown that the spatial distribution of microbleeds is somewhat different from that of lacunes, and that the cortico-subcortical region is the most common site for these lesions. We also found a correlation between the degree of severity of lacunes and microbleeds in hypertensive patients. The difference in distribution of these two types of lesion suggests that hypertension may influence their development in different ways. We did not investigate possible causative factors, but low serum cholesterol, matrix metalloproteinases, or fibrinogen may be important biochemical factors. Further investigations will be needed to resolve this issue.
REFERENCES
Footnotes
-
Competing interests: none declared