Article Text

Abstract
Objective: To determine whether apparent diffusion coefficient (ADC) values and fractional anisotropy (FA) values can detect early pathological involvement in multiple system atrophy (MSA), and be used to differentiate MSA-P (multiple system atrophy if parkinsonian features predominate) from Parkinson’s disease (PD).
Methods: We compared ADC and FA values in the pons, cerebellum and putamen of 61 subjects (20 probable MSA patients, 21 age matched PD patients and 20 age matched healthy controls) using a 3.0 T magnetic resonance system.
Results: ADC values in the pons, cerebellum and putamen were significantly higher, and FA values lower in MSA than in PD or controls. These differences were prominent in MSA lacking dorsolateral putaminal hyperintensity (DPH) or hot cross bun (HCB) sign. In differentiating MSA-P from PD using FA and ADC values, we obtained equal sensitivity (70%) and higher specificity (100%) in the pons than in the putamen and cerebellum. In addition, all patients that had both significant low FA and high ADC values in each of these three areas were MSA-P cases, and those that had both normal FA and ADC values in the pons were all PD cases. Our diagnostic algorithm based on these results accurately diagnosed 90% of patients with MSA-P.
Conclusion: FA and ADC values detected early pathological involvement prior to magnetic resonance signal changes in MSA. In particular, low FA values in the pons showed high specificity in discriminating MSA-P from PD. In addition, combined analysis of both FA and ADC values in all three areas was more useful than only one.
- ADC, apparent diffusion coefficient
- DPH, dorsolateral putaminal hyperintensity
- FA, fractional anisotropy
- HCB, hot cross bun
- MSA, multiple system atrophy
- MSA-C, multiple system atrophy if cerebellar features predominate
- MSA-P, multiple system atrophy if parkinsonian features predominate
- PD, Parkinson’s disease
- ROC, receiver operating characteristic
- ROI, region of interest
Statistics from Altmetric.com
- ADC, apparent diffusion coefficient
- DPH, dorsolateral putaminal hyperintensity
- FA, fractional anisotropy
- HCB, hot cross bun
- MSA, multiple system atrophy
- MSA-C, multiple system atrophy if cerebellar features predominate
- MSA-P, multiple system atrophy if parkinsonian features predominate
- PD, Parkinson’s disease
- ROC, receiver operating characteristic
- ROI, region of interest
Multiple system atrophy (MSA) is a sporadic adult onset neurodegenerative disease presenting a combination of parkinsonism, cerebellar ataxia and autonomic failure during the course of the illness.1–4 A consensus statement recommended designating patients as having MSA-P if parkinsonian features predominated or MSA-C if cerebellar features predominated.5 Differentiation of Parkinson’s disease (PD) from MSA-P is particularly important because these disorders differ in progression, prognosis and treatment responses.6 However, a purely clinical differentiation, especially in the early phase of the disease, remains challenging.
In advanced MSA, MRI reliably shows characteristic signal changes, such as dorsolateral putaminal hyperintensity (DPH) and the hot cross bun (HCB) sign,7,8,9,10 but these signs are not useful for differentiation between MSA-P and PD in their early phases.11
Apparent diffusion coefficient (ADC) values and fractional anisotropy (FA) values are new parameters on MRI, and these were used to evaluate the degree of tissue degeneration in various disorders. ADC values measure the average water diffusion, and increasing ADC values indicate tissue degeneration. FA values measure the degree of anisotropy of the diffusing water along different axes of the image, and decreasing FA values represent tissue degeneration. Recently, there have been some reports concerning ADC and FA values in MSA-P and PD patients. ADC values in the striatum were higher in MSA-P than in PD,12 and those in the basis pontis and cerebellum were higher in MSA-C than in controls.13 FA values in the middle cerebellar penduncle, basis pontis and internal capsule were lower in MSA-C than in controls.14 However, these results still do not confirm whether ADC and FA values are really effective at discriminating MSA-P from PD, particularly in their early phases. To confirm the hypothesis that ADC and FA values can detect abnormalities in patients with MSA, even without DPH and HCB, and discriminate MSA-P from PD, a direct study of these values at various stages of MSA and PD and in various regions is needed.
The aim of the present investigation was to examine the utility of ADC and FA values in the pons, cerebellum and putamen to detect not only the early pathological changes in MSA but also to differentiate MSA-P from PD.
PATIENTS AND METHODS
We studied 61 subjects (20 consecutive patients with probable MSA (10 MSA-C; 10 MSA-P), 21 age and sex matched patients with probable PD and 20 age and sex matched healthy volunteers) (table 1). There was a significant difference in the duration from initial symptoms to MRI evaluation between MSA (4 (2) years, range 1–10) and PD (10 (8) years, range 1–30) patients. Furthermore, patients with MSA-P and PD were assessed using the Hohen–Yahr score. There was no significant difference in the Hohen–Yahr score between the MSA-P (3.6 (1.0)) and PD (3.5 (1.0)) groups. Patients in the relatively early stage of MSA were included in this study. Clinical diagnoses of MSA5 and PD15 were established by consensus diagnostic criteria. All MSA patients fulfilled clinically probable criteria. In addition, controls underwent the same MRI examination. Informed consent was established before subject participation. This study was approved by the ethics committee of the Nagoya University Graduate School of Medicine.
Patients data
MRI protocol
All scanning was carried out with a 3.0 T MR scanner (Trio, Siemens, Erlangen, Germany), using a receive only 8 channel phased array head coil. Diffusion weighted imaging was obtained with optimal methods16 using a Stejskal–Tanner sequence with single shot spin echo-type echo planar imaging, flip angle of 90° and a repetition time of 7700 ms. Echo times corresponding to respective b-factors were 75 ms for 700 s/mm2. Echo spacing was 0.79 ms, and matrix size was 128×128 with a readout bandwidth of 1562 Hz/pixel. Sixty axial slices, 2 mm thick with a 0.6 mm interslice gap, were used to image the entire brain with a 23 cm square field of view.
A motion probing gradient was applied in six orientations after acquisition of b = 700 images. The 128×128 data matrix was zero fill interpolated to 256×256. An acceleration factor of 2 was applied using the parallel imaging technique, generalised autocalibrating partially parallel acquisitions (GRAPPA),17 which is an extension of the simultaneous acquisition of spatial harmonics technique. Eddy current related geometric distortions were not prominent between the images of each motion probing gradient directions and thus distortion correction post-processing was not applied.
Data analyses
ADC and FA values, and tractography were obtained using the public domain software dTV II for diffusion weighted imaging analysis developed by the Imaging Computing and Analysis Laboratory (Department of Radiology, University of Tokyo Hospital, Japan), and made available via the URL http://www.ut-radiology.umin.jp/people/masutani/dTV.htm. Regions of interest (ROIs) in the pons and cerebellum were placed within closed curves drawn around the entire axially imaged pons and around the axial cerebellum section that showed the largest dentate nucleus profile (fig 1A, 1B). As it was difficult to discriminate the entire axial putamen on MRI, ROIs in the putamen were placed within closed fixed circles drawn on the axial putaminal section (fig 1C). Regional ADC and FA values were calculated in each ROI. Mean ADC and FA values were adapted as representative indices of ADC and FA values. For tractography visualisation in the pons and cerebellum, which could be anatomically analysed in their entirety, seed areas were defined on T2 weighted axial images (b = 0) as the interior of the previously mentioned closed curve drawn around the pons and cerebellum. The presence or absence of HCB or DPH signs18 was determined on T2 weighted axial images of the pons or putamen by the radiologist.

Regions of interest (ROI). ROIs in the pons (A), cerebellum (B) and putamen (C).
Statistical analyses were performed using SPSS 11.0 for Windows (SPSS Inc, USA). The Kruskal–Wallis test was used for comparison of ADC or FA values among MSA, PD and controls or MSA-P, PD and controls. The significance level was set at p<0.05. In addition, to differentiate probable MSA-P from PD, we performed receiver operating characteristic (ROC) analysis for FA and ADC values in each ROI. Based on these ROC data, we set cut off points for FA and ADC values, respectively.
RESULTS
Features of tractography
Tractography in representative MSA, PD and control subjects is shown in fig 2. Compared with PD and controls, MSA showed a decreased volume of fibre bundles corresponding anatomically to the middle cerebellar peduncle, transverse pontine and pyramidal tract fibres located in the pontine ROI, and also to the middle cerebellar peduncle and frontocerebellar tract located in the cerebellar ROI. No marked difference was seen between PD and controls. Although these fibre bundle losses were prominent in most MSA patients, some MSA cases had relatively well preserved tractography.

Tractography in the pons and cerebellum. (A) Pons. Visualisation of fibres in the pons and pyramidal tract fibres is unclear in multiple system atrophy (MSA). (B) Cerebellum. Visualisation of transverse fibres proceeding via the middle cerebellar peduncle, and of fibres connecting to the frontal lobe is unclear in MSA. PD, Parkinson’s disease.
FA and ADC values in the pons, cerebellum and putamen
FA values in the pons, cerebellum and putamen in MSA were significantly lower than those in PD or controls. With respect to MSA phenotype, FA values in all three areas were significantly lower in MSA-P and MSA-C than in either PD or controls (fig 3A–C). However, FA values in the pons and cerebellum tended to be lower in MSA-C than in MSA-P, but the differences were not significant. FA values in the putamen were similar in MSA-C and MSA-P subjects.

Fractional anisotropy (FA) values in the pons, cerebellum and putamen. FA values in multiple system atrophy if cerebellar features predominate (MSA-C), multiple system atrophy if parkinsonian features predominate (MSA-P), Parkinson’s disease (PD) and controls are shown in the pons (A), cerebellum (B) and putamen (C). **p<0.01, ***p<0.005, ****p<0.001. FA values in all three areas were significantly lower in MSA-P and MSA-C than in PD or controls.
ADC values in the pons, cerebellum and putamen were significantly higher in MSA than in PD or controls. With respect to MSA phenotype, ADC values in all three areas were significantly higher in MSA-P or MSA-C than in PD or controls (fig 4A–C), while ADC values in the pons and cerebellum tended to be higher in MSA-C than in MSA-P, but the difference was not significant. ADC values in the putamen were similar in MSA-C and MSA-P.

Apparent diffusion coefficient (ADC) values in the pons, cerebellum and putamen. ADC values (×10−3 mm2/s) in multiple system atrophy if cerebellar features predominate (MSA-C), multiple system atrophy if parkinsonian features predominate (MSA-P), Parkinson’s disease (PD) and controls are shown in the pons (A), cerebellum (B) and putamen (C). *p<0.05, **p<0.01, ***p<0.005, ****p<0.001. ADC values in all three areas were significantly higher in MSA-P or MSA-C than in PD or controls.
Statistically lower FA and higher ADC values in the pons and cerebellum were more prominent than those in the putamen.
FA and ADC values in MSA with or without magnetic resonance signal changes
In our MSA patients, specificity of the HCB and DPH signs were both 100%, while sensitivity of the HCB and DPH signs were only 45.0% and 40.0%, respectively. However, in 11 MSA patients without the HCB sign, 8 (72.7%) showed low FA values in the pons, 7 (63.6%) in the cerebellum and 6 (54.5%) in the putamen, and 8 (72.7%) showed high ADC values in the pons, 6 (54.5%) in the cerebellum and 8 (72.7%) in the putamen (table 2). In 12 MSA patients without the DPH sign, 10 (83.3%) showed low FA values in the pons, 10 (83.3%) in the cerebellum and 10 (83.3%) in the putamen, and 8 (66.7%) showed high ADC values in the pons, 9 (75.0%) in the cerebellum and 6 (50.0%) in the putamen (table 2). These observations demonstrate that changes in FA and ADC values can be detected prior to the appearance of HCB and DPH signs in early phase MSA. FA values were significantly lower in MSA patients without DPH or HCB signs than in PD patients. Likewise, ADC values were significantly higher in MSA patients without DPH or HCB signs than in PD patients.
Percentage of patients with multiple system atrophy presenting with low fractional anisotropy or high apparent diffusion coefficient values without dorsolateral putaminal hyperintensity or hot cross bun signs
Differentiating MSA-P from PD
To differentiate probable MSA-P from PD, we performed ROC analysis. Based on these ROC data, we set cut off points for FA values in the pons, cerebellum and putamen at 0.38, 0.30 and 0.35, and for ADC values 0.98, 0.96 and 0.83, respectively, and that both sensitivity and specificity were as high as possible in our cases. Sensitivity and specificity based on these cut off points for FA values were 70.0% and 100.0% in the pons, 70.0% and 63.6% in the cerebellum and 70.0% and 87.5% in the putamen (fig 5). Sensitivity and specificity based on these cut off points for ADC values were 70.0% and 70.0% in the pons, 60.0% and 87.5% in the cerebellum and 70.0% and 63.6% in the putamen (fig 5). FA values in the pons were particularly useful for readily differentiating MSA-P from PD, and provided equal sensitivity and higher specificity than those in the cerebellum and putamen. Hence pontine FA values were especially useful markers to diagnose MSA-P as well as those in the cerebellum and putamen.
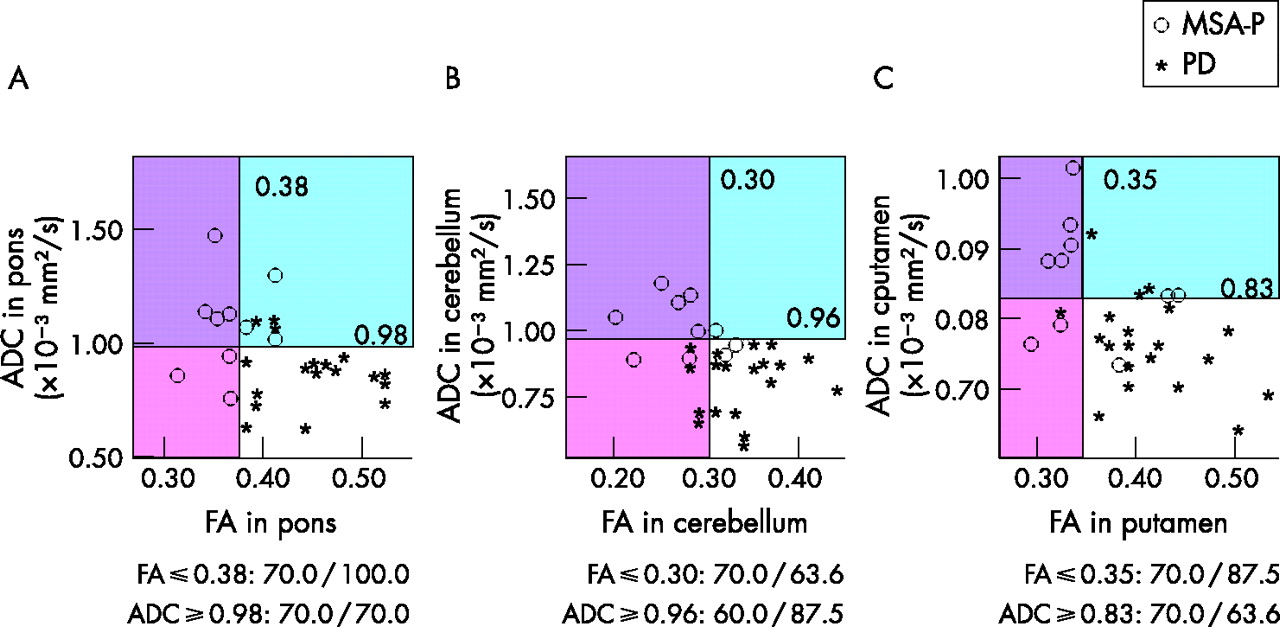
Differentiation of multiple system atrophy if parkinsonian features predominate (MSA-P) from Parkinson’s disease (PD). Fractional anisotropy (FA) and apparent diffusion coefficient (ADC) values in the pons (A), cerebellum (B) and putamen (C). In the pons, cerebellum and putamen, the cut off point was set at 0.38, 0.30 and 0.35 for FA, and 0.98, 0.96 and 0.83 for ADC, respectively. Sensitivity/specificity in differentiating probable MSA-P from PD using these cut off points are shown. FA values in the pons were particularly useful for readily differentiating MSA-P from PD. In addition, some MSA-P cases had low FA and normal ADC values or normal FA and high ADC values. All patients that had both low FA and high ADC values in all three areas were MSA cases, and all patients that had both normal FA and ADC values in the pons were PD cases.
In addition, our results showed that three MSA-P patients had low FA but normal ADC values (fig 5A, red area) and three had normal FA but high ADC values (fig 5A, blue area) in the pons. In the cerebellum and putamen (fig 5B, C), two and two MSA-P patients, respectively, had low FA but normal ADC values, and one and two, respectively, had normal FA but high ADC values.
All patients that had both low FA and high ADC values in each of the three areas were probable MSA-P cases (fig 5A–C, purple areas), suggesting that patients with such values have a high possibility of being correctly diagnosed as MSA-P. Furthermore, no MSA cases had both normal FA and ADC values in the pons (fig 5A, white area), and all patients that had both normal FA and ADC values in the pons were PD cases. However, in the cerebellum and putamen (fig 5B, C, white areas), two and one MSA-P cases, respectively, had both normal FA and ADC values. Hence it was more useful to examine both FA and ADC values than only one or the other to distinguish MSA-P from PD.
Therefore, based on these results, we devised an algorithm for differentiating probable MSA-P from PD (fig 6). Using this algorithm in our 31 cases (PD 21; probable MSA-p 10), all patients that had both normal FA and ADC values in all three areas were PD cases (12 PD cases). In addition, all patients that had both low FA and high ADC values in any of the three areas were probable MSA-P cases (9 probable MSA-P cases). Taken together, the “MSA area” included 90.0% of probable MSA-P cases and no PD cases, and the “PD area” included 57.1% of PD cases and no probable MSA-P cases.

Algorithm for differentiating probable multiple system atrophy if parkinsonian features predominate (MSA-P) from Parkinson’s disease (PD) using fractional anisotropy (FA) and apparent diffusion coefficient (ADC) values. Using this algorithm in our 31 cases (PD 21; probable MSA-p 10), the “MSA area” included 90% of probable MSA-P cases and no PD cases, and the “PD area” included 57.1% of PD cases and no MSA-P cases.
DISCUSSION
To our knowledge, this is the first systematic study to demonstrate the usefulness of simultaneous assessment of ADC and FA values on multiple regions, including the pons, cerebellum and putamen in MSA, PD and controls. We showed that low FA and high ADC values in these regions were significant even in MSA cases without HCB or DPH signs, suggesting that FA and ADC assessment can be a potent procedure to detect early involvement in MSA without diagnostic MRI findings. In particular, 90.0% of probable MSA-P cases showed a combination of low FA and high ADC values in one or more of the three areas, but no PD patients showed both low FA and high ADC values in any of the three areas. In addition, 57.1% of PD cases showed a combination of normal FA and ADC values in all three areas. These results suggest that combined evaluation of FA and ADC values in early disease stages provides an accurate method for differentiating MSA-P from PD.
ADC values measure the average water diffusion. High putaminal ADC values were reported to be helpful in differentiating MSA-P from PD.12 Subsequently, brainstem ADC values in MSA-C were demonstrated to be increased.13 As increases in ADC values have been shown in certain other diseases19–21 and in normal aging,22 high ADC values are thought to reflect destruction of tissue architecture. In contrast, FA values are new parameters specifically measuring the degree of anisotropy of the diffusing water along different axes of the image, enabling useful quantitative estimation of decreased tissue anisotropy reflecting degeneration. Reduced FA values have been reported in certain other diseases23–25 and in normal aging.26 More recently, decreased FA values in cerebellopetal fibres and pyramidal tracts have been reported in MSA-C,14 and low FA values are also thought to reflect destruction of tissue architecture. In this study, we demonstrated that by using small voxels and optimised parameters,16 as well as a generalised autocalibrating partially parallel acquisitions (GRAPPA)17 algorithm for suppressing artefact and noise to obtain reliable ADC and FA values, as evidenced by clear tractography results, increased ADC and decreased FA values could reflect destruction of brainstem, cerebellar or putaminal tissue architecture resulting from neuronal loss and/or gliosis, enhancing random mobility of free water molecules within the tissue. Our results support previous observations and extend the significance of FA and ADC values in the diagnosis of MSA-P, even in cases without DPH or HCB signs.
Some of our MSA-P or PD cases showed a combination of normal FA but high ADC or low FA but normal ADC values in various regions. As above, high ADC and low FA values could reflect similar destruction of tissue architecture and have been demonstrated in various pathological changes, including brain atrophy, atherosclerotic change and normal aging.22,26 However, these parameters are based on different pathological conditions. This may be one of the reasons why some cases showed normal FA but high ADC or low FA but normal ADC values. Furthermore, only cases of MSA-P had both low FA and high ADC values in each of the three areas. FA and ADC values may mutually provide additional information about the evolution of the disease that is not available from one method. These findings suggest that the combined evaluation of FA and ADC values could be more useful for early detection of pathological involvement in MSA-P than evaluation of either of these separately.
With respect to location, pontine FA and ADC values were especially useful markers in diagnosing MSA-P compared with those in the cerebellum and putamen. Although degeneration of olivopontocerebellar systems is evident from clinical features and MRI findings in MSA-C, these changes are not apparent in the early phase of MSA-P. The present study clearly demonstrated that even though reductions in FA values and increases in ADC values in the pons and cerebellum were more remarkable in MSA-C than in MSA-P, these changes were still highly evident in MSA-P. The question arises as to why significantly abnormal ADC and FA values can be seen in the pons even in early phase MSA. Patients with early stage MSA in Caucasian populations have been reported to show selective neuronal cell loss in the substantia nigra and locus coeruleus, with relative sparing of both the striatum and the olivopontocerebellar system.27 One possible explanation may be that ADC and FA values have the potential to detect minimal and subclinical, but accumulated, neurodegeneration in the pons, because the pons contains the neurons and fibre tracts (eg, the pontine nuclei, transverse pontine fibres and corticospinal tracts) that are preferentially effected in MSA and thus could accumulate and reflect the MSA specific neurodegenerative process at an early phase of illness. Alternatively, it could be due to differences in the pathological features of MSA among Japanese and Caucasian populations. We previously reported that MSA-C was more frequent, and MSA-P less frequent, in Japanese populations11 compared with Western populations,3 and also that proton magnetic resonance spectroscopy (1H-MRS) showed significantly lower N-acethylaspartate/creatine ratios in the basis pontis suggesting more neuroaxonal loss or dysfunction in MSA-P than in PD.28 The olivopontocerebellar system shows more profound degeneration in Japanese MSA-P. While further study is needed to address this issue, we suggest that the pons is a beneficial region to detect early pathological change in MSA.
In previous reports,12 ADC values in the dorsolateral putaminal ROIs were reported to be more useful in distinguishing MSA from PD compared with those in the anteroventral ROIs. It is interesting that this result corresponded well to the spatial distribution of pathological lesions in the putamen in MSA. In contrast, we used relatively large sized ROIs than previous reports to obtain reliable data under our MRI conditions, such as higher magnetic field strength, special software and parameters to analyse FA and ADC values. In addition, as some MSA and PD patients showed obscure putaminal edges on MRI, we set the ROIs in the relatively midst putamen, including dorsolateral parts. These specific MRI conditions may have caused the differences in the sensitivity and specificity in the putamen between our study and previous ones. These discrepancies may also be explained by ethnic differences. The olivopontocerebellar system could be more severely affected in Japanese than in Western populations. A multicentre survey will be needed to clarify the optimised size of ROIs, magnetic field strengths and parameters to standardise the FA and ADC values as diagnostic criteria.
In summary, combined evaluation of FA and ADC values in the putamen, cerebellum and putamen would provide useful information for highly and accurate differentiation of MSA-P from PD. Such early FA reduction and ADC increase are likely to be associated with subtle early degenerative processes in MSA, even without diagnostic magnetic resonance signal abnormalities. In addition, to justify our conclusion, it will be necessary to apply this algorithm, in a prospective manner, to patients with possible MSA without diagnostic MRI findings, and to determine whether these patients will develop full blown MSA symptoms in several years.
REFERENCES
Footnotes
-
Published Online First 12 March 2007
-
Competing interests: None.