Article Text

Abstract
Background: Histopathological studies of amyotrophic lateral sclerosis (ALS) are of end stage disease. Diffusion tensor imaging (DTI) provides the opportunity to investigate indirectly corticospinal tract pathology of ALS in vivo.
Methods: DTI was used to study the water diffusion characteristics of the corticospinal tracts in 21 patients with ALS and 14 normal controls. The authors measured the fractional anisotropy (FA) and mean diffusivity (MD) along the pyramidal tracts from the internal capsules down to the pyramids. A mixed model regression analysis was used to compare FA and MD between the ALS and control groups.
Results: FA showed a downward linear trend from the cerebral peduncles to the pyramids and was lower in the ALS group than controls at multiple levels of the corticospinal tract. At the internal capsules, FA was higher on the right. MD showed an upward trend, progressing caudally from the internal capsules to the pyramids. MD was higher at the level of the internal capsule in the ALS group, but caudally this difference was not maintained. No correlations were found between clinical markers of disability and water diffusion indices.
Conclusions: These findings provide insights into the pathological processes of ALS. Differences in diffusion characteristics at different anatomical levels may relate to underlying tract architecture or the distribution of pathological damage in ALS. Further development may permit monitoring of progression and treatment of disease.
- diffusion tensor imaging
- amyotrophic lateral sclerosis
- motor neuron disease
- ALS, amyotrophic lateral sclerosis
- DTI, diffusion tensor imaging
- FA, fractional anisotropy
- MD, mean diffusivity
Statistics from Altmetric.com
- ALS, amyotrophic lateral sclerosis
- DTI, diffusion tensor imaging
- FA, fractional anisotropy
- MD, mean diffusivity
Amyotrophic lateral sclerosis (ALS) is a neurodegenerative condition of complex pathology that targets the corticospinal tracts, brain stem, and lower motor neurons.1–3 It results in progressive weakness of the bulbar, limb, thoracic, and abdominal musculature usually with a mixture of upper and lower motor neurological signs. Phenotypic variants include progressive bulbar palsy, progressive muscular atrophy (lower motor syndrome), and primary lateral sclerosis (upper motor syndrome). The main histological changes include loss of motor neurons and associated astrocytosis.4
Magnetic resonance imaging has investigated the involvement of the corticospinal tracts in ALS with variable success. Changes in signal intensity along the internal capsule have been described using T2 weighted,5,6 proton density,5,7 and FLAIR8 sequences. Magnetisation transfer imaging has demonstrated quantitative evidence for a reduced magnetisation transfer ratio in the internal capsule9 and magnetic resonance spectroscopy has shown changes in the primary motor cortex.10–12
Diffusion tensor imaging (DTI) has also been used to quantitatively assess involvement of the corticospinal tracts in ALS at the level of the internal capsule.13 DTI is an MR technique that is able to characterise the diffusion properties of water molecules in vivo.14 Diffusion refers to the random translational motion of molecules (Brownian motion) resulting from their thermal energy. It may not be the same in all directions. In vivo limitation of movement results from the presence of membranes, macromolecules and subcellular structures that behave as barriers to diffusion. These make the diffusion anisotropic—that is, they impose a directional bias. For example, white matter tracts display comparatively high anisotropy (directional bias) because water diffusion is faster along the direction of the nerve fibres than across them.15,16 The magnitude of water diffusion per unit time may be described by the term diffusivity and depends upon the hindrances imposed on diffusion regardless of direction. For example, CSF has high diffusivity because diffusion is comparatively free. Indices of anisotropy (for example, fractional anisotropy (FA)) and diffusivity (for example, mean diffusivity (MD)) can be calculated from the diffusion tensor.17 This is a mathematical representation of water diffusion in the form of a three by three matrix, six elements of which are unique.18 The diffusion tensor can be derived by measuring changes in the magnetic resonance signal acquired with diffusion sensitising gradients along at least six non-collinear directions.
The quantitative assessment of water diffusion using DTI permits the investigation of white matter architecture affected by different pathologies. This has been performed for longstanding conditions that exhibit Wallerian (anterograde) degeneration such as stroke,19,20 tumour,21 and trauma.22,23 These studies consistently show reduced anisotropy in the affected white matter tracts and, less consistently, increased diffusivity.
ALS pathology affects both white and grey matter but its hallmark is corticospinal tract degeneration (as well as lower motor neuron degeneration). This was studied by Ellis et al who found evidence for reduced FA and increased MD at the level of the internal capsules in ALS patients when compared with controls13 although other levels of the corticospinal tracts were not sampled. We acquired wholebrain DTI in patients with ALS. This enabled us to investigate the intracranial course of the corticospinal tract from the internal capsules down to the pyramids.
METHODS
Subject recruitment
Twenty one patients (median age 58 years; range 28–71 years; 16 men, 5 women) with probable or definite ALS24 were recruited from the Motor Neuron Disease clinic at The National Hospital for Neurology and Neurosurgery, London. Fourteen controls (median age 51.5; range 37–71 years; 9 men, 5 women) were also recruited. All subjects gave written informed consent to participate in the study. The study was approved by the joint ethics committee of the Institute of Neurology and The National Hospital for Neurology and Neurosurgery.
Each patient was examined and a questionnaire for the ALS functional rating scale (ALSFRS) was used to assess disease severity.25 This provided a bulbar and spinal score that were added together to give a total ALS severity score out of 40. A greater disability was indicated by a lower score. The disease progression rate was estimated by the following formula13:
Image acquisition
Imaging was performed on a 1.5 T GE Signa Horizon Echospeed system (General Electric, Milwaukee, WI, USA) with a standard quadrature head coil and gradient coils (0–22 mT/m). Head motion was restricted by placing pads on both sides of the subject’s head. A single shot spin echo EPI (echo planar imaging) diffusion weighted sequence was performed for DTI acquisition. Three sets of seven 5 mm slices were collected, with a 10 mm slice gap, giving a total of 21 contiguous 5 mm axial slices that covered most of the brain (TE 78 ms, TR about 2.25 s, acquired image matrix 96×96 reconstructed as 128×128 giving pixel dimensions 1.88 mm×1.88 mm, four diffusion b values increasing from 0 to 700 smm−2, Δ=35 ms, δ=28 ms, maximum gradient 22 mT/m in each of seven non-collinear directions). Five acquisitions for each set of diffusion data were performed and averaged after magnitude reconstruction to improve the signal to noise ratio. Cardiac gating was used to avoid pulsatile artefacts; image acquisition was triggered from every second R wave monitored using pulse oximetry (trigger delay 10% of the expected RR interval—that is, about 200 ms, three or four shots per RR interval).
Structural images were also acquired, including axial dual echo FSE images (28 contiguous axial slices, dimensions 0.94×0.94 mm, matrix 256×256, slice thickness 5 mm, TR 3 s, TE 15/90 ms) and high resolution multishot inversion recovery prepared EPI images matched in position and geometric distortion to the corresponding diffusion weighted images (28 contiguous axial slices, dimensions 0.94×0.94 mm, matrix 256×256, slice thickness 5 mm, TR 5.5 s, TE 78 ms, TI 200 ms).
Correction of eddy current distortions in DW-EPI was performed using a two dimensional image registration technique (M R Symms, et al, Proceedings of the International Society for Magnetic Resonance in Medicine, 1997). The diffusion tensor, MD, and FA were calculated on a pixel by pixel basis.14,17
Region of interest (ROI) analysis
On the FA and MD maps (both derived from the diffusion tensor and therefore in the same space), ROIs were manually applied to the left and right corticospinal tracts on all axial slices extending from the pyramids to the top of the internal capsule (DispImage26). The high resolution EPI images and coregistered z weighted ADC (apparent diffusion coefficient) map were also displayed during ROI positioning. The z weighted ADC map displayed voxels in which signal intensity was proportional to diffusion magnitude in the vertical direction permitting more precise positioning of the ROIs along the corticospinal tracts. The datasets under analysis were observer blinded. All ROIs were the same size (28 mm2) and the pyramidal tracts were localised based on a priori anatomical knowledge and reference to relevant literature.27,28 The cross sectional area and length of the corticospinal tracts varied between each person. We therefore chose to vary the number of ROIs that were applied per side on each axial slice so that the corticospinal tract area was sufficiently covered (fig 1). In practice we applied two to three ROIs per side on each axial slice except for the pyramids where one ROI was applied per side per axial slice (because the cross sectional areas of the pyramids were smaller). The ROI measurements were then divided into four groups corresponding to four locations along the corticospinal tract—internal capsule, cerebral peduncles, pons, and pyramids. The average value of the ROIs for each location was then entered into the statistical analysis.

Axial images through the internal capsules, cerebral peduncles, pons, and pyramids on FA and z weighted ADC maps for a representative control subject. Regions of interest have been positioned along the left and right corticospinal tracts.
Statistical analysis
Fractional anisotropy
A mixed model regression analysis was performed with age and sex as covariates and side and location as within subject fixed effect factors.29,30 A random coefficients model was adopted. Fixed effects terms were selected using the likelihood ratio test to compare various nested models. Akaikes Information Criterion30 was used to determine which random effects should be included in the model. The covariance structure was modelled using separate covariance matrices for the two groups to account for the greater between subject variability within the patient group. Probability values were obtained subsequent to a conversion of the restricted maximum likelihood (REML) Wald statistics to F ratios, using denominator degrees of freedom (ddf) equal to the difference between the number of observations and the rank of the fixed effects design matrix. Inferences were not changed by adopting alternative specifications for the ddf. The calculations were performed using SAS Version 6.12 PROC MIXED.31 In the results, two sided probability values are given throughout, although many of the statements are expressed in a one sided form.
Mean diffusivity
The same procedure was used with the exception of the regression model that included quadratic terms in corticospinal location, together with linear and quadratic random coefficient location terms. The latter were required to capture the progressive increase in between subject variability associated with the caudal corticospinal locations.
Assessment of gradient calibration changes over time
The FA plots for predicted FA versus location showed a random intercept effect—that is, an apparently constant offset for a given subject. To determine if this could be caused by changes in scanner gradient calibration over time, serial data for three controls were analysed. These controls belonged to the original control group and had been rescanned at 12 months. For each of these six scans (three at baseline and three at one year), another control dataset was selected that had been acquired within one month of each scan. This gave six “date matched” pairs of datasets. The first member of each pair was either a baseline scan or a one year rescan of the three selected controls. Examination of the resulting FA data demonstrated that the observed between-subject random intercept effect was not caused by changes in gradient calibration—that is, real intersubject differences make a major contribution to the observed differences.
RESULTS
Subject characteristics
Table 1 shows the subject characteristics. Sex was found to be unimportant and was removed from the model. Age was incorporated into the model as a covariate during statistical analysis because some dependence of FA and MD on age was found that differed between ALS and control groups. This, however, did not change the major findings that are discussed for MD and FA and the qualitative results are maintained across the age range. Thus, for simplicity, the estimated differences between sides and subject groups will be quoted only for a representative midpoint age of 55 years.
Patient characteristics for age, sex, disease duration, ALS functional rating scale, and disease rate. Clinical examination findings divided patients into those with predominantly upper motor neuron (umn), lower motor neuron (lmn), and mixed signs. One patient with some missing clinical data was not entered into the correlation analyses between FA, MD, and clinical markers. Median values with ranges (in parentheses) are shown at the bottom of the table
Fractional anisotropy
The estimated population means for control and ALS groups were plotted against location from internal capsule caudally to pyramids (fig 2). These estimates were obtained using a regression model in which a linear dependence on location was adopted between the pyramids and peduncles, while an unconstrained mean value was adopted for the internal capsule. A dependence on side was found at the internal capsule (p=0.0004) with the FA higher on the right, which was not group specific (p=0.68). Therefore left (LHS) and right (RHS) estimated means are plotted separately to permit better visualisation. There is a significant linear downward trend in FA (p=0.0001) descending caudally from the peduncles to the pyramids. The gradient does not differ significantly between group (p=0.48) or side (p=0.54). Mean FA is lower in patients compared with controls at the internal capsule (p=0.036), and at the peduncles, pons, and pyramids (p=0.038). These differences were quantified. For age 55 years, at the internal capsule, the estimated FA difference between groups for the LHS is 48.8×10⁻³ (standard error (SE) =22.6×10⁻³, t=2.16, p=0.032) and for the RHS is 58.0×10⁻³ (SE=22.6×10⁻³, t=2.56, p=0.011). Below the internal capsule the estimated difference in FA for the LHS is 52.2×10⁻³ (SE=16.1×10⁻³, t=3.25, p=0.0013) and for the RHS is 41.8×10⁻³ (SE=16.1×10⁻³, t=2.60, p=0.01).

The predicted population FA means for age 55 years are plotted against corticospinal tract location for the controls (left and right hand sides) and patients (left and right hand sides). FA values theoretically range from 0 to 1, where 0 indicates completely isotropic diffusion and 1 indicates perfectly coherent (anisotropic) diffusion. Note that there is some side dependence of FA at the internal capsules. ALS demonstrates significantly lower FA at all levels. Controls LHS (solid line), RHS (short dashed line), patients LHS (long and short alternating dashed line), RHS (long dashed line).
FA observations were plotted against location, showing variability of FA raw data (fig 3). Greater FA variance is demonstrated in the ALS group relative to the control group, which is consistent with the assumption that disease pathology increases between subject variability.

FA raw data measurements in ALS patients and controls for left and right sides are plotted against location demonstrating the variability in observed FA. The predicted (fitted) population means are overlaid for each group.
Correlation between FA and clinical markers
No significant correlations were found between FA and ALS rating scale or between FA and disease progression rate (Spearman’s ρ), at each location on both sides.
Mean diffusivity
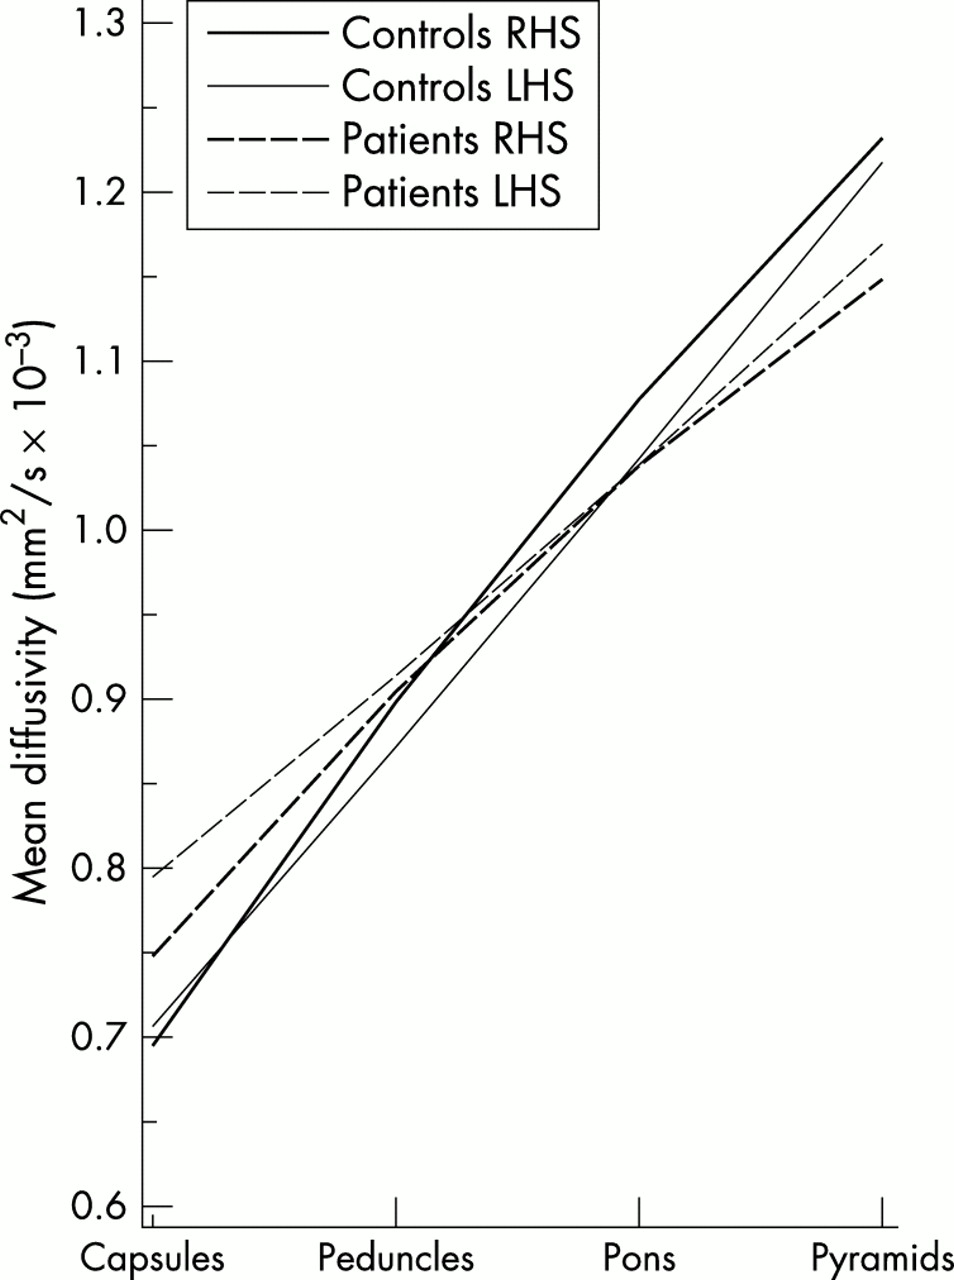
The estimated population means were plotted against location for LHS and RHS (fig 4). There is borderline significance for a difference in sides that is group dependent (p=0.05). For example, at age 55 years, mean diffusivity at the internal capsule, is higher on the left than the right in patients although this does not reach significance (p=0.08) and not significantly different between left and right sides in controls (p=0.68). Overall there is weak evidence for a group difference that is dependent on location (p=0.09). This is reflected by the different gradients of the regression slopes for the ALS and control group (fig 4). MD is significantly higher in patients than controls at the level of the internal capsule on the LHS (for example, for age 55 years, estimated MD difference 87.4×10⁻⁶ mm2/s, SE 33.9×10⁻⁶, t−2.58, p=0.01) although on the RHS it does not reach significance (for example, for age 55, estimated MD difference 52.3×10⁻⁶ mm2/s, SE 33.9×10⁻³, t−1.54, p=0.12). Descending caudally along the corticospinal tract, the predicted means for the ALS group cross over and dip below the control group. At the level of the pyramids the MD predicted means for the ALS group (for LHS and RHS) are lower than for the control group but these differences are not significant (for LHS at age 55, estimated MD difference 49.0×10⁻⁶ mm2s/, SE 79.6×10⁻³, t 0.62, p=0.54; for RHS, estimated MD difference 84.1×10⁻⁶ mm2/s, SE 79.6×10⁻³, t 1.06, p=0.29).

The predicted population MD means for age 55 years are plotted against corticospinal tract location for controls and patients. Control lines are solid, patient lines are dashed. Right hand side lines are bold, left hand side lines are thin. Note that the gradients of the regression slopes for the patient and control groups show some differences over all ages (p=0.09). MD in the ALS group is lower than in the control group at the internal capsules. The MD for both groups increases as one descends caudally. However, towards the pyramids, the patient lines crossover and dip below the control lines. There are also some differences in side which vary according to location and group.
MD was plotted against location for LHS and RHS (fig 5). As well as showing the upward trend in MD as one ascends the corticospinal tracts, greater MD variance is demonstrated caudally in the corticospinal tracts especially at the pyramids.

MD raw data are plotted against location to demonstrate the variability in MD measurements at different levels of the corticospinal tracts. Greater variability is observed lower down in the corticospinal tracts and in the patient group. The predicted (fitted) population means are overlaid for each group.
Correlation between MD and clinical markers
Correlations between MD with disease progression rate and MD with ALS rating scale were examined using Spearman’s ρ for each location on each side. No correlations were found between MD and the ALS rating scale. For the disease progression rate, borderline significance was found for MD in the right pyramid (p=0.05) after performing the correlations without correcting for multiple comparisons. We considered that this could be attributable to the influence of the excessive disease rate in one patient, which was 3.14 units/month (see table 1). All other patients had disease rates of less than 1.30. When this particular patient was excluded, no significant correlations were found.
DISCUSSION
This study quantifies the water diffusion characteristics along the corticospinal tracts in ALS and provides insight into the underlying in vivo pathology. MD and FA form the basis for this characterisation, and regression analysis has been used to examine the spatial dependence in these parameters. Thus, the main focus is on the spatial trends in MD and FA along the corticospinal tracts, although we also give statistics for the individual regions. We emphasise, however, that the region specific statistics arise from the simultaneous modelling of the behaviour of all four regions. It is also important to note that a smooth dependence on location is not imposed on the statistical model at the outset. In fact, an adequate modelling of the FA data was obtained only after allowing for the presence of a discontinuity between the capsules and peduncles (see fig 3). The main result arising from the regression analysis is that the corticospinal tract FA is lower in ALS compared with controls, this difference being maintained from the capsules to the pyramids. In addition, there is weak evidence that the MD is higher in ALS at the level of the internal capsules but caudally in the corticospinal tracts this difference is lost and there is an associated larger between subject variance in observed MD (figs 4 and 5).
To interpret findings in relation to ALS pathology, it is first necessary to explain the changes in FA and MD along the corticospinal tract in normal controls. Progressing caudally along the corticospinal tract, we found that FA generally decreases and MD increases. Other studies have investigated measures of anisotropy and/or diffusivity at different levels of the corticospinal tracts.19,32,34 Virta et al measured water diffusion changes at the peduncles, pons, and medulla; Stieltjies et al at the midbrain, pons, and medulla; and Pierpaoli et al at the capsules, peduncles and pons. They all reported trends in water diffusion characteristics similar to the observations of this study.
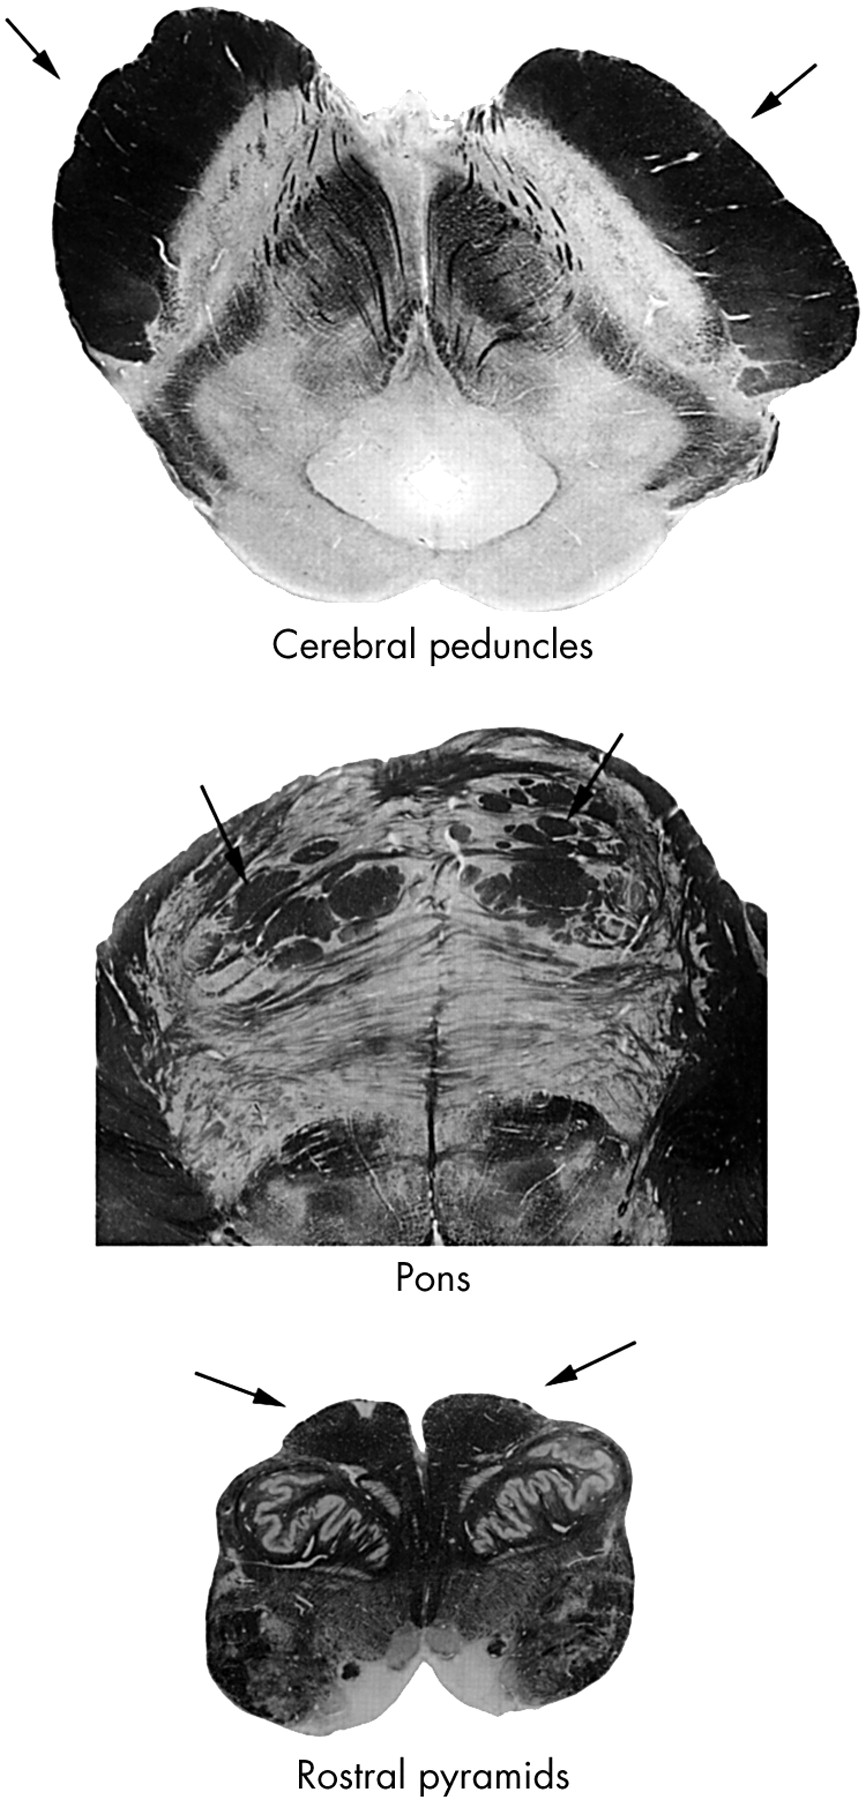
Anatomically, the tract fibres are very coherent and tightly packed in the internal capsule and more so in the peduncle (fig 6). Thus, diffusivity is comparatively low and FA is comparatively high. We observed a higher FA on the right than the left at the internal capsules. FA asymmetry of the anterior limbs of the internal capsules has been reported previously34 and was found not to be associated with handedness. At the pons the corticospinal tract fibres split into multiple bundles, which run through interdigitating transverse pontine fibres. Fibre packing is less tight than higher up, leading to a reduction in FA and an increase in MD (because there is more extracellular matrix to permit greater water diffusion) within each ROI resulting from partial volume effects. Progressing from the peduncles to the pyramids, many fibres leave the corticospinal tracts. In the pons and pyramids, collateral fibres leave to various brain stem nuclei, and the peduncles consist of 20 million fibres per side, whereas the pyramids contain only 1 million fibres per side.35 At the pyramids, therefore, although the motor tracts may be comparatively coherent, small pyramid size and limitations of ROI analysis mean that there will be contributing influences on disruption of fibre coherence from adjacent multidirectional tracts to other brain stem nuclei, adjacent CSF, and the decussation of the pyramids. These factors collectively decrease FA and increase MD.

Histological sections of the brain stem taken at the cerebral peduncles, pons, and rostral medulla to indicate the relative fibre packing and local architecture at each level. Black arrows indicate the corticospinal tracts. At the peduncles, pyramidal fibres are comparatively tightly packed. At the pons, the tracts split into multiple bundles resulting in some loss of fibre coherence. The rostral medulla illustrates the smaller size of the pyramids and the complexity of multidirectional fibres connecting other nuclei and pathways. The photgraphs are reprinted from The human brain by J Nolte, J B Angevine, pages 23, 25, 27, 1995, with permission from Elsevier Science.
In the ALS group, the findings at the internal capsule are compatible with a previous study that used DTI to quantify water diffusion changes in ALS13 and found evidence for lower FA and higher MD. These changes were interpreted as being secondary to axonal degeneration accompanied by increased extracellular volume. In our study, which investigates water diffusion changes at additional levels from the internal capsules down to the pyramids a more complex relation emerges. The relation to ALS pathology and the underlying tissue architecture is of interest. Most histopathological studies have been performed on end stage or near end stage disease and little is known about in vivo pathology or its temporal evolution.36 The main features are: loss of large motor neurons with focal astrogliosis, “senescent changes” with lipofuscin pigment atrophy, various cytoplasmic inclusions with chromatolysis, proximal, and distal axonopathy with axonal spheroids, tract degeneration, lower motor fibre degeneration, and muscle atrophy.4,37,38 Postmortem studies have described histologically uneven involvement of the corticospinal tracts showing variable patterns of degeneration.39–41 The changes in ALS are thus more complex than those seen in classic Wallerian degeneration—the anterograde degeneration of axons and their myelin sheaths after proximal axonal or cell body injury. The main histological changes seen in the corticospinal system include the loss of cortical pyramidal motor neurons and the degeneration of corticospinal tract axons with associated astrocytosis, which can be very variable.4,38 Disorders of axonal transport are thought to play important parts in the development of the resulting axonopathy and a “dying back” model of axon degeneration has been proposed as part of the natural history of motor neuron degeneration.42 Surviving motor neurons tend to be smaller and are histologically abnormal. They contain various inclusion bodies (within the cell body) and abnormalities of the neurofilament and microtubule structures that will disrupt intra-axonal flow.44 Further evidence of abnormalities within the surviving motor tracts comes from observations of the accumulation of axonal spheroids (swellings of the axons thought to result from impaired axonal transport), particularly at the level of the internal capsules.44,45 These may affect intracellular water diffusion and contribute to the changes in measured diffusivity. The relation between water diffusion and neurodegeneration has been previously investigated in both the peripheral46 and central19 nervous systems. Diffusion changes have been explained in terms of contributions from degenerated fibre tracts, extracellular matrix, glial cell proliferation, and residual cell debris.
The finding of lower FA in the ALS group, at multiple levels, reflects tract degeneration, which results in loss of fibre coherence. The space between surviving fibres may be occupied by partially degenerated tracts, extracellular matrix, or glial cells. Abnormalities of the surviving axons and reduced anisotropy of intracellular diffusion contribute to the reduced FA.
Changes in MD as a result of ALS pathology also depend on a balance between the competing influences of similar factors including extracellular matrix expansion, which will encourage water diffusion and increase MD, astrocytosis within the inter-axonal spaces, which will hinder free water diffusion and lower MD, and cell debris resulting from partially degenerated or disintegrated nerve fibres along the corticospinal tracts that should restrict diffusion between the surviving axons and lower MD. In support of this, neuronophagia, shrinkage, pyknosis, and vacuolation have been described in the brain stem in postmortem studies.47,48 In the ALS group, the changes in MD, progressing caudally down the corticospinal tracts, suggest differing relative contributions of these factors, restricting or encouraging water diffusion. Thus, the group effect of ALS pathology at the internal capsules increases MD, whereas at lower levels, this is counterbalanced by factors that restrict diffusion. The interpretation of MD differences at the lowest levels, where the corticospinal tract is smallest, is limited by partial volume effects that may obscure subtle changes in MD due to disease and contribute to the greater variance of MD measurements (fig 5). The differences in MD between ALS and controls at the internal capsule were asymmetrical, and this is supported by descriptions of asymmetry in ALS pathology of the corticospinal tracts.49
Clinicopathological correlations in ALS are heterogeneous. Prominent clinical disability during life may occur in the absence of corticospinal tract involvement at postmortem examination, the reverse has also been observed reported.41,50 In addition, the ALS functional rating scale used may not monitor clinical involvement of the upper motor neurons sensitively. It is therefore not surprising that we did not detect any convincing correlations between markers of clinical disability and indices of water diffusion. It was not feasible in our study to compare the DTI findings between patients with upper and lower motor neuron signs because most possessed a mixed clinical picture, as is typical in ALS (see table 1). A future approach will be to compare larger numbers of patients with predominantly upper motor neuron signs against mixed and lower motor neuron signs to determine whether DTI distinguishes corticospinal tract degeneration more readily. It may be, however, that further technological advances in MRI or a greater understanding of the molecular pathology of ALS are required to develop more reliable clinical or prognostic indicators.
In the quantitative image analysis, we used an ROI approach, which has several limitations. Determining the boundaries of the structure of interest and avoiding partial volume contamination from CSF or grey matter are universal problems. In our experience the pyramidal tract is anatomically well defined and readily identified on the FA maps. In addition we displayed co-registered z directional ADC maps where signal intensity is proportional to high diffusivity in the z direction, helping to exclude non-pyramidal fibres tracking in orthogonal directions. This approach was satisfactory higher up in the corticospinal tracts. At the level of the pyramids, however, limitations of ROI analysis were more apparent. The pyramids are small and there is partial volume contamination from surrounding CSF (at higher levels of the corticospinal tracts CSF does not contaminate ROI placement). In addition, the medulla is anatomically complex with many crossing fibres. These factors will reduce FA, increase MD, and increase the variability of ROI measurements, especially for MD, which is partial to CSF contamination. This was reflected in the greater variance of the measurements at the pyramids compared with higher levels.
The advantage of ROI analysis is that specific parts of the brain may be accurately localised, permitting comparison between people, provided the areas of interest (for example, pyramidal tract) are anatomically well defined and there is no operator dependent bias. An alternative method is to co-register the FA and MD maps of interest into a standard space and cross reference the measurements with a known coordinate system or perform voxel based morphometry.51 However, the registration process may not be error free. It assumes that each part of a person’s pyramidal tract will map precisely to the standard map, but there is probably some natural interindividual variation for pyramidal tract location and structure. A better method may be to use the recently developed technique of tractography52 to map the pyramidal tract location, and use this as an unbiased guide to placing ROIs. Formal assessments of these alternative techniques will establish which will provide the best quantitative assessment of ALS pathology. However, neither of these alternative methods fully overcomes partial volume effects with ROI analysis. This requires DTI to be developed to acquire higher resolution images. Advances in newer techniques related to DTI, such as diffusion spectrum imaging (DSI) or conductivity tensor mapping (M R Wiegell, et al, Proceedings of the 9th International Society of Magnetic Resonance in Medicine, Berkeley, CA, USA, 2001 and Tuch et al53) may provide important insights into brain tissue microstructure in the future, although the effectiveness of clinical DSI may be determined by gradient strength limitations.54,55
In conclusion, in sampling the corticospinal tracts from the internal capsule down to the pyramids using DTI, and performing a rigorous statistical analysis to detect differences between the ALS and the control group, we found evidence for changed microstructural organisation at multiple levels, which we attribute to neuronal degeneration in ALS. Further development of these techniques and direct comparisons with other MR imaging modalities (for example, magnetisation transfer imaging, magnetic resonance spectroscopy) may be important for the sequential quantification of neuronal degeneration, understanding the progress of disease pathology, and assessing the effects of therapeutic intervention, in patients with ALS.
Acknowledgments
We wish to thank David MacManus, Chris Benton, and Ros Gordon with their assistance in scanning the subjects.
REFERENCES
Footnotes
-
Funding: this work was supported by the Brain Research Trust. GJB is funded by the MS Society of Great Britain.
-
Competing interests: none declared.