Article Text

Abstract
Objective To determine whether brain atrophy and lesion volumes predict subsequent 10 year clinical evolution in multiple sclerosis (MS).
Design From eight MAGNIMS (MAGNetic resonance Imaging in MS) centres, we retrospectively included 261 MS patients with MR imaging at baseline and after 1–2 years, and Expanded Disability Status Scale (EDSS) scoring at baseline and after 10 years. Annualised whole brain atrophy, central brain atrophy rates and T2 lesion volumes were calculated. Patients were categorised by baseline diagnosis as primary progressive MS (n=77), clinically isolated syndromes (n=18), relapsing–remitting MS (n=97) and secondary progressive MS (n=69). Relapse onset patients were classified as minimally impaired (EDSS=0–3.5, n=111) or moderately impaired (EDSS=4–6, n=55) according to their baseline disability (and regardless of disease type). Linear regression models tested whether whole brain and central atrophy, lesion volumes at baseline, follow-up and lesion volume change predicted 10 year EDSS and MS Severity Scale scores.
Results In the whole patient group, whole brain and central atrophy predicted EDSS at 10 years, corrected for imaging protocol, baseline EDSS and disease modifying treatment. The combined model with central atrophy and lesion volume change as MRI predictors predicted 10 year EDSS with R2=0.74 in the whole group and R2=0.72 in the relapse onset group. In subgroups, central atrophy was predictive in the minimally impaired relapse onset patients (R2=0.68), lesion volumes in moderately impaired relapse onset patients (R2=0.21) and whole brain atrophy in primary progressive MS (R2=0.34).
Conclusions This large multicentre study points to the complementary predictive value of atrophy and lesion volumes for predicting long term disability in MS.
- MULTIPLE SCLEROSIS
- MRI
Statistics from Altmetric.com
Introduction
In multiple sclerosis (MS), neurodegeneration, measured by brain atrophy, is associated with short and medium term clinical progression more strongly than other MRI measures of disease burden.1–10 The longer term clinical prognostic value of brain atrophy measures and lesion volumes has been studied less extensively. A recent study in relapsing–remitting MS (RRMS) found that neither atrophy nor lesions predicted clinical outcomes 11 years later11 while atrophy rates have been found to be predictive in primary progressive MS (PPMS) over 10 years12 but data on large groups across MS subtypes are lacking.
Large and long term prospective studies on the predictive value of imaging are difficult to carry out and therefore multicentre and retrospective studies may represent an efficient and quick way to collect MRI data on large patient cohorts to understand the role of brain atrophy in determining clinical outcome. However, not all sequences are suitable for such retrospective studies. Many old datasets contain only dual echo imaging, while analysis software, such as SIENA,13 is designed for T1 weighted images. However, previous work has shown that SIENA(X) analysis on pseudo T1 weighted images (derived from dual echo image pairs14) compares well to ‘true’ T1 weighted images.15
This study aimed to determine the prognostic value for 10 year disability of whole brain atrophy (WBA), central brain atrophy and T2 lesion volumes (T2LV) in a large MS patient group, taking into account disease type, disease modifying treatment (DMT) and initial clinical status.
Materials and methods
This study was longitudinal, retrospective, with short term serial MRI data and long term clinical follow-up. We aimed for clinical follow-up at 10 years after the first MRI scan, and included cases with at least 8 years of clinical follow-up. Ethics committee approval was obtained for this study and the original studies in which patients participated.
Inclusion criteria were: two MRI scans performed using the same protocol with a 1–2 year interval, baseline scan before 1 January 2000 and MS diagnosis at 10 years of follow-up according to the McDonald criteria.16 Exclusion criteria were: insufficient MRI image quality for reliable measurements and age under 18 years.
Clinical data
The following clinical data were collected: gender; Expanded Disability Status Scale (EDSS) scores at baseline and at 10 years of follow-up; disease onset date; and disease type. We included patients who died after the second MRI if the cause of death was related to MS; these patients were assigned EDSS=10.
For most patients, the 10 year follow-up EDSS was assessed during routine clinical review. For 70 Amsterdam patients who had undergone MRI scans, but had not been clinically assessed close to the 10 year time point, an experienced investigator (HEH) performed a telephone EDSS interview.17
From EDSS scores at 10 years, MS Severity Scale (MSSS) scores were calculated.18
DMT was administered according to clinical criteria, and was analysed as a dichotomous variable indicating whether the patient had ever received DMT.
MRI data acquisition
Sixty-eight (24%) of the patients were scanned on 1 T scanners and the rest on 1.5 T MRI scanners, inplane pixel size was approximately 1×1 mm2 and slice thickness varied between 3 (203 patients—74%) and 5 mm (for 74 patients—26.5%); some protocols with a 5 mm slice thickness (27 patients—10%) included a 0.5 mm gap between slices.
Brain atrophy measurements
All MRI analyses were performed centrally. We used SIENAX and SIENA13 for cross sectional and longitudinal atrophy measurements, respectively. Both are part of the FMRIB software library (http://www.fmrib.ox.ac.uk/fsl) and are described in detail elsewhere.13 Briefly, SIENAX registers the individual scan to the standard space brain and then converts the individual brain volume to a normalised brain volume. SIENA performs halfway registration between the images from the two time points and calculates WBA as percentage brain volume change from the mean brain edge displacement between the two scans. Percentage brain volume change was divided by the interval between scans to obtain the annualised WBA rate.
Using a local adaptation of SIENA, we calculated central atrophy rate as percentage ventricular volume change, where only brain/non-brain edge points on the ventricular edges were selected and their mean edge displacement was calculated.6 ,19 Percentage ventricular volume change was divided by the interval between scans to obtain the annualised central atrophy rate.
Because dual echo images were most consistently available, we used pseudo T1 images created by subtracting the T2 weighted images from the proton density weighted images for atrophy measurements, after lesion filling.20 ,21
Lesion volumes
T2LV were measured by one experienced investigator (VP) on all images using the JIM5 analysis package (Xinapse Systems Ltd, Northants, UK, http://www.xinapse.com). Baseline and follow-up lesion volumes were measured by the same rater in separate sessions with up to 6 months in between for individual patients. Patients were presented to the rater in a pseudorandom order. Lesion volumes were normalised for head size using the ‘vscaling’ measure obtained from SIENAX. The difference in lesion volumes was divided by the interval between scans to obtain annualised lesion volume change.
Grouping of patients for analysis
The total group was split into PPMS and relapse onset patients. The relapse onset group was subdivided by baseline disease type into clinically isolated syndrome (CIS), RRMS and secondary progressive MS (SPMS) patients, regardless of baseline disability. The total relapse onset group was also subdivided into two subgroups according to their baseline disability as (1) minimally impaired relapse onset MS (EDSS=0–3.5) and (2) moderately impaired relapse onset MS (EDSS=4–6). The different patient groups studied are indicated in figure 1.

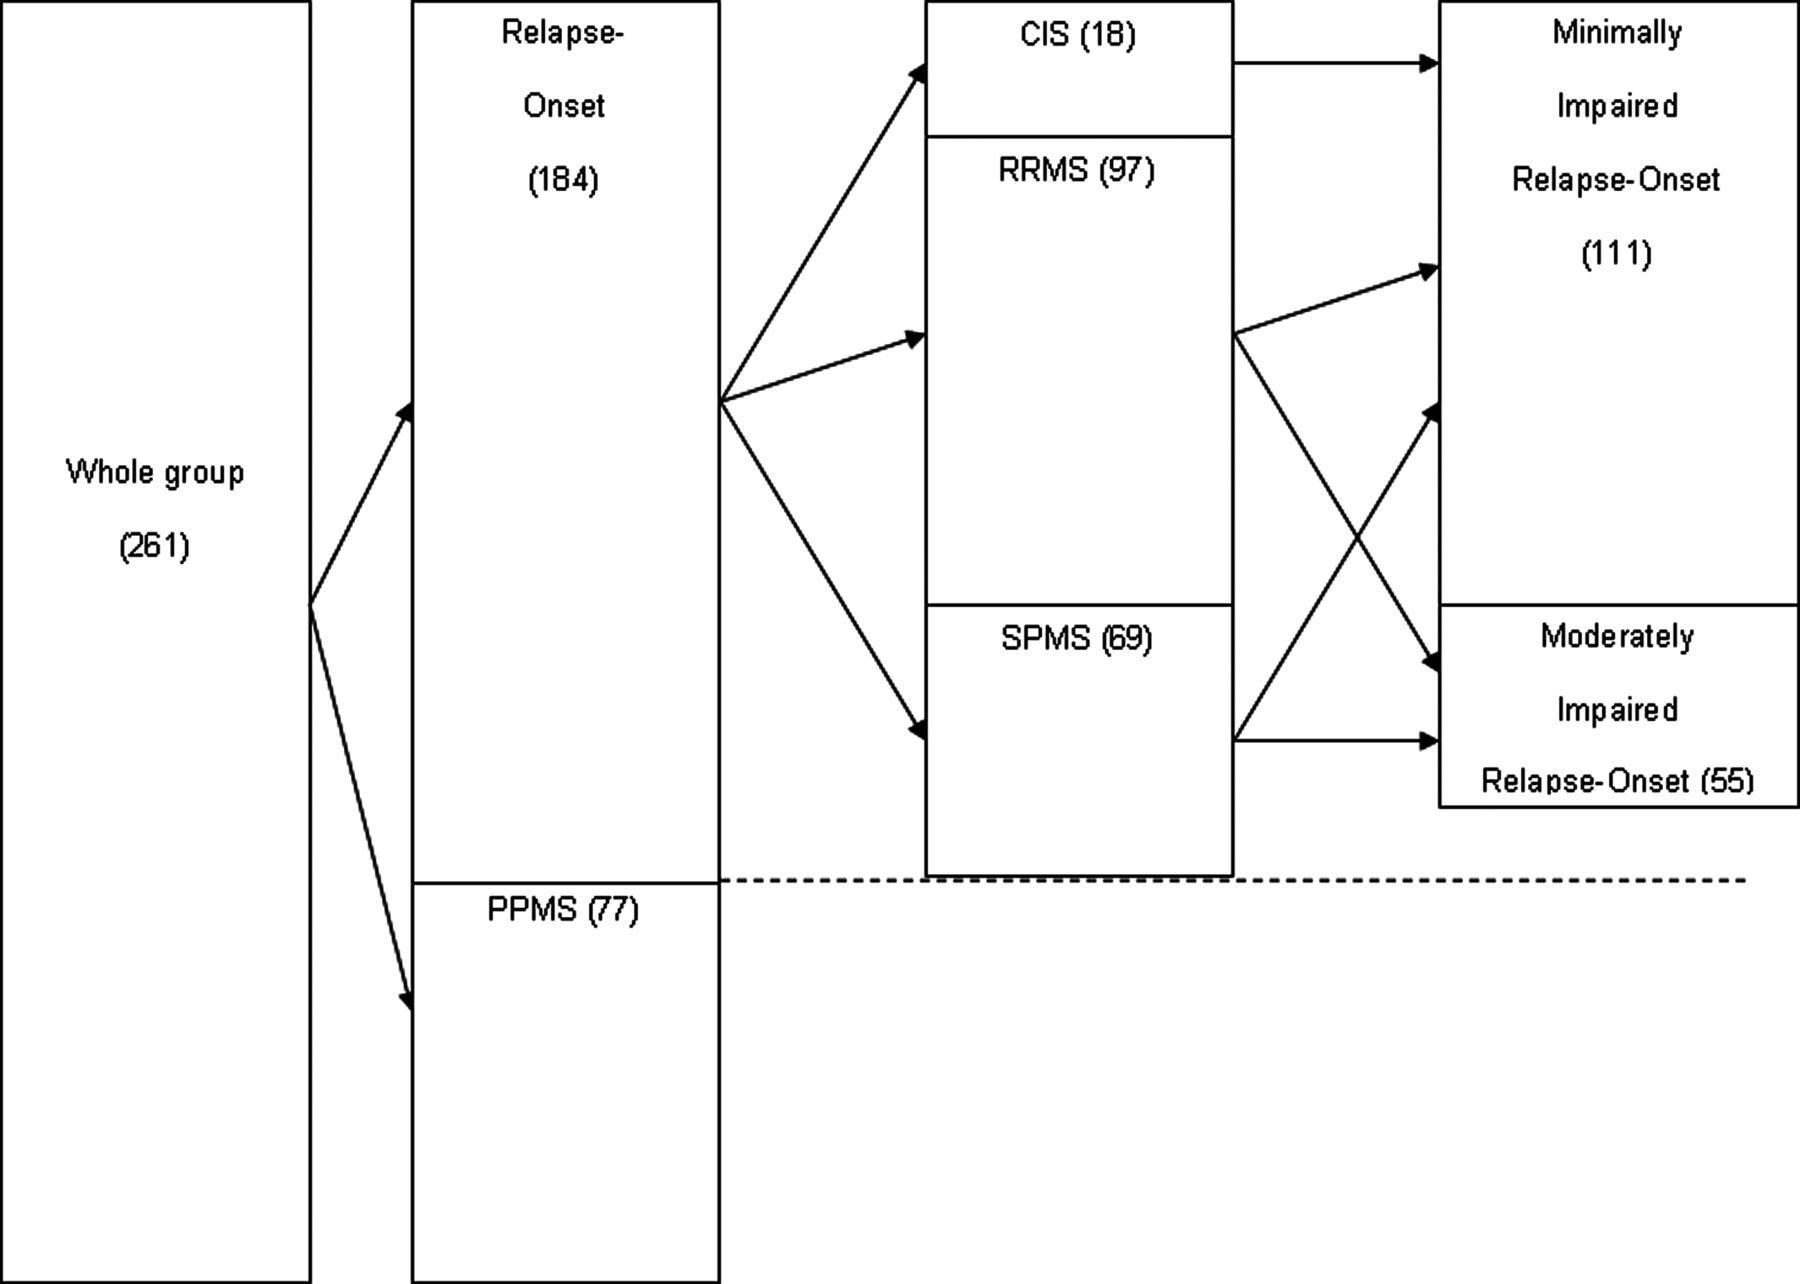
Splitting of the groups. CIS, clinically isolated syndrome; MS, multiple sclerosis; PPMS, primary progressive MS; RRMS, relapsing–remitting MS; SPMS, secondary progressive MS.
Statistical analysis
Statistical analyses were performed using SPSS V.15. Linear regression was used to model 10 year EDSS and MSSS scores in each group listed above. A ‘base model’ was built with fixed factors: imaging protocol (eight levels), use of DMT (yes/no), disease type (CIS/RRMS/SPMS/PPMS) and baseline EDSS score, if these were statistically significant. Statistical significance was considered at p<0.05. Each possible MRI predictor listed in table 2 was then added to the ‘base model’ in a separate model. If several MRI predictors were significant in these models, then regression analysis with a backward selection procedure was used to build a combined model, starting from the full set of predictors. The models were compared based on the squared multiple correlation coefficient (R2), the R2 change and the general linear test performed using SPSS. Standardised residuals were checked for normality.
Results
We identified 359 candidate patients from eight MAGNIMS (MAGNetic resonance Imaging in MS) consortium centres (http://www.magnims.eu). Ninety-eight patients were excluded: 65 because of insufficient image quality or artefacts, 15 patients were lost to follow-up, 12 patients died from causes other than MS, three did not comply with the minimum follow-up duration, two patients were aged under 18 years at baseline and one was still CIS at the 10-year follow-up. The characteristics of the remaining 261 patients included in the study, and of all subgroups, are listed in tables 1 and 2. Over the follow-up period (median 10 years, IQR 9.5–11), the median EDSS score change was 1.5 (IQR 0.5–3) points. Eight patients who died due to a cause related to MS within 10 years had significantly higher baseline EDSS and MSSS scores compared with the other 253 patients (Mann–Whitney U test, p values <0.001 for both EDSS and MSSS scores); other baseline values did not differ. Use of DMT could be reliably established retrospectively for 173 patients (124 had DMT). In these patients, DMT was administered with variable durations (median 3 years, IQR 0–8) and using different types of treatment.
Demographic and clinical characteristics of the patients
MRI characteristics of the patients
Predictors of EDSS and MSSS at 10 years
Base models
Imaging protocol, use of DMT and baseline EDSS predicted 10 year EDSS in the whole group, the relapse onset group, the minimally impaired relapse onset group and the RRMS group, and therefore these predictors were retained in the final base model. In the moderately impaired relapse onset group, the base model included only disease type. The PPMS group base model included only baseline EDSS (table 3).
Significant predictors for the Expanded Disability Status Scale score at 10 years, using the linear regression model
Imaging protocol, baseline disease type and baseline EDSS predicted 10 year MSSS in the whole group, relapse onset group and minimally impaired group, and therefore these predictors were retained in the final base model. The RRMS group base model consisted of imaging protocol, and baseline EDSS. The base model in the SPMS and PPMS groups included only EDSS baseline (table 4).
Significant predictors for the Multiple Sclerosis Severity Scale score at 10 years, using the linear regression model
No significant predictors were found for predicting EDSS and MSSS in the base models for CIS and for predicting MSSS in moderately impaired relapse onset patients.
Combined models
In the whole group (n=261), WBA, central atrophy and 1 year lesion volumes significantly predicted 10 year EDSS (table 3), and WBA, central atrophy and lesion volume change significantly predicted 10 year MSSS (table 4). In the final combined model, central atrophy and lesion volume change significantly predicted EDSS; the model explained 74.3% of the variance in clinical outcome (table 5). WBA was the only MRI predictor of 10 year MSSS and the combined model explained 64.1% of the variance in MSSS (table 5).
Linear regression analysis within the groups where several radiological predictors were statistically significant
In the relapse onset group (n=184), central atrophy and lesion volumes at baseline and at 1 year significantly predicted 10 year EDSS (table 3), and central atrophy and lesion volume change significantly predicted 10 year MSSS (table 4). In the final combined model, central atrophy and lesion volume change significantly predicted EDSS; the model explained 72.4% of the variance in clinical outcome (table 5). In the final combined model, central atrophy and lesion volume change significantly predicted MSSS; the model explained 66% of the variance in clinical outcome (table 5).
In the minimally impaired relapse onset group (n=111), central atrophy was the only MRI predictor of 10 year EDSS (table 3) and significantly predicted 10 year MSSS (table 4). In the final combined model, central atrophy and lesion volume at 1 year significantly predicted EDSS; the model explained 68.2% of the variance in clinical outcome (table 5). Central atrophy was the only MRI predictor of 10 year MSSS and the combined model explained 63.1% of the variance in MSSS (table 5).
In the moderately impaired relapse onset group (n=55), lesion volumes at baseline and at 1 year predicted 10 year EDSS (table 3) and MSSS (table 4); these two lesion volume measures were not entered into multiple regression together. For predicting EDSS, both models explained 21.4% of the variance in clinical outcome (table 3). For predicting MSSS, baseline T2LV explained most of the variance in clinical outcome (10%) (table 4).
In the small CIS group (n=18), baseline brain volume was the only MRI predictor of 10 year EDSS, explaining 24.2% of the variance in clinical outcome (table 3), and central atrophy displayed a trend at p=0.052 for predicting 10 year MSSS and explained 30% of the variance in clinical outcome (table 4).
In the RRMS group (n=97), lesion volumes at 1 year were the only MRI predictor of 10 year EDSS; the model explained 56.2% of the variance in clinical outcome (table 3), and both lesion volumes at 1 year and lesion volume change were predictors of 10 year MSSS (table 4); these two lesion volume measures were not entered into multiple regression together. For predicting MSSS, the model including lesion volumes at 1 year explained most of the variance in clinical outcome (51.5%) (table 4).
In the SPMS group (n=69), no MRI variables were significant in linear regression. The only variable that was significant was baseline EDSS (R2=20.5% for EDSS and 14.1% for MSSS) (tables 3, 4).
In the PPMS group (n=77), WBA was the only MRI predictor of 10 year EDSS and 10 year MSSS. For predicting EDSS, the model explained 34% of the variance in clinical outcome (table 3), and for predicting MSSS, 21.8% of the variance (table 4).
Discussion
This study investigated long term clinical associations with retrospective MR disease measures in a large multicentre MS group with all major disease subtypes and clinical follow-up at 10 years. Despite the characteristic variability among MS patients, and the fact that the most prominent predictive value could be attributed to clinical variables (baseline EDSS, disease type, treatment, imaging protocol), we still noted associations between MR measures (both cross sectional and longitudinal) and clinical status 10 years later. Differences were found between subgroups, with brain atrophy rates predictive of subsequent disability in the relapse onset, minimally disabled relapse onset and PPMS patients, while lesion volumes were predictive in the entire relapse onset group, in RRMS and in moderately disabled relapse onset patients. Considering the entire clinically heterogeneous group of 261 patients, whole brain and central atrophy, lesion volumes and lesion volume change were predictive of subsequent disability and disease severity, and the best model predicting clinical status at 10 years included as MR measures both central atrophy and lesion volume change, suggesting that both relate to long term clinical outcome.
We also performed separate analyses for the different subgroups although some caution is warranted in interpreting these results, given the smaller sample sizes. These subgroup analyses revealed first a predictive value of central atrophy in minimally impaired relapse onset patients and the entire relapse onset group, but not in any other group. Central atrophy was previously found to differ between MS disease subtypes.22 ,23 In early RRMS, central atrophy was related to subsequent clinical progression over 5.5 years.6 The present study suggests that early central atrophy is predictive of subsequent clinical progression in relapse onset MS patients with a larger and more diverse sample, a longer clinical follow-up (10 years) and using final EDSS scores directly as outcome measure.
In the present study, central atrophy was a better predictor than WBA. This may possibly be due to a higher sensitivity of the central atrophy measurement compared with the WBA measurement, as has been suggested.24 Alternatively, periventricular atrophy may truly be more closely related to long term clinical decline than peripheral brain atrophy, in relapse onset disease, as periventricular pathological processes seem to start earlier in the disease course.25 Interestingly, in progressive onset disease, only WBA was predictive of 10 year disability. A previous study on PPMS long term prognosis found that WBA, over 2 years, was a significant predictor of EDSS change over 10 years.12 In the same cohort, lesion volume change had predictive value for medium term clinical deterioration but lost significance for long term prediction.26 Our study confirms their findings on lesion volumes and WBA, but adds to them by predicting directly the EDSS and MSSS scores and by showing that WBA is more important than central atrophy for long term clinical outcome in PPMS. This suggests a possible different anatomical distribution of clinically relevant brain atrophy in PPMS compared with relapse onset disease. Cortical atrophy in PPMS was found to be important and strongly correlated with whole brain volume, suggesting that in PPMS, neocortical neurodegeneration may be more relevant to clinical development than other disease processes.27
In addition to atrophy measures, lesion volume measures were also predictive of 10 year disability. Specifically, lesion volume change was predictive of EDSS in the whole group, minimally impaired relapse onset group and RRMS group; and of MSSS in the whole group, relapse onset group and RRMS group, and as part of the multiple regression models (together with central atrophy) in the whole group and relapse onset group. The measured lesion volume change over the 1–2 year period was relatively large compared with baseline volumes. Extensive visual inspection showed that this cannot be attributed to lesion volumetry errors, thus suggesting that patients in this sample were having a relatively active disease course. Cross sectional lesion volumes were also predictive: 1 year lesion volume was a predictor of EDSS in the whole group and the RRMS group, and of MSSS in the moderately impaired group. In the moderately impaired group, only baseline and 1 year lesion volumes were predictive, and lesion volume change was not significant as an individual predictor, possibly due to the lower statistical power of prediction in this group (only 55 patients).
Earlier studies found that brain atrophy was related to clinical evolution in RRMS,4 ,28 but this was not confirmed by our study. In RRMS, only 1 year lesion volume predicted EDSS while 1 year lesion volume and lesion volume change predicted MSSS. In a recent RRMS study, brain atrophy, lesion volumes or black hole ratio did not predict MSSS 11 years later.11
In SPMS, we observed no significant MRI predictors, while a predictive role for brain atrophy has been reported.22 ,29 Our SPMS group was relatively small (n=69) and had a median baseline EDSS score of 5.5, leaving a limited range for possible further EDSS score increase, which hampers prediction. In addition, for the relation of lesion volumes to subsequent worsening, a plateau effect has been reported for EDSS scores over 4.5.30 Interestingly, the SPMS patients included a larger proportion of men (52%), and at a slightly longer disease duration than the PPMS group in our sample had comparable baseline EDSS scores. It cannot be excluded that to some extent these patients had a relatively severe disease course.
In the small CIS group (n=18), the cross sectional baseline brain volume, rather than a measure of atrophy rate, predicted 10 year EDSS. Similarly, a previous study on early patients found that brain volume was correlated with the 2 year EDSS more strongly than WBA or lesion volumes8; central atrophy was not investigated in that study. Central atrophy showed a trend (p=0.052) for predicting MSSS, in line with the observed clinical value of central atrophy in early RRMS.6 In a seminal study that started with CIS patients, baseline lesion volumes and lesion volume change correlated with EDSS scores in a CIS cohort at 14 years of follow-up31 and after 20 years32; atrophy measures were not included in either of these studies. Taken together, these results suggest that even at the earliest phase of relapse onset disease, both atrophy and lesion measures may be predictive of clinical development. Larger studies should investigate their potential value in prognostic models for CIS patients.
Models predicting EDSS and MSSS scores contained slightly different sets of predictors, which is not unexpected as EDSS is a measure of disability while MSSS is a measure of how one patient's evolution compares with other patients with similar EDSS scores and disease durations.18 Nevertheless, the sets of MRI predictors included in the best models were almost identical in each case (tables 3, 4). The only notable exception was the whole group analysis, in which 10 year EDSS score was predicted by central atrophy and lesion volume change, while 10 year MSSS score was predicted by WBA (table 5). Differences between models for EDSS and MSSS mainly concerned the use of DMT, which was predictive for EDSS, but not for MSSS. A previous study on 195 patients followed-up for 2 years showed that the effect of treatment on MSSS was limited.33 The group used as a reference in the MSSS algorithm contained 30% of patients who did have DMT18; therefore, the modulating effect of the treatment on disease course is to some extent taken into account in the MSSS calculation, while this is not the case for EDSS scores.
Limitations
One limitation of this study concerns the use of pseudo T1 images instead of pre-contrast T1 weighted for atrophy measurements, to maximise patient numbers. Standard two-dimensional T1 weighted images would have been optimal but these were not available for a large proportion of patients with the long clinical follow-up duration requested by our current study protocol. Our earlier comparison of different image types15 showed that pseudo T1 images produced SIENA(X) results closest to those from ‘true’ T1 weighted images.
In the present study, whole brain measures of lesions and atrophy demonstrated predictive value. One may expect improved prediction from anatomically detailed atrophy measurements, such as cortical thickness or deep grey matter volume measurements,34–37 and future studies should therefore exploit high resolution images that are currently being obtained once enough time has passed to allow long term clinical follow-up of these patients. Future prospective studies should preferably be able to include large samples of patients with consistent imaging for state of the art quantitative analyses. Ideally, such an analysis would be performed by splitting the group into a prediction and a validation set. However, the group of patients we were able to accumulate for this study, although large for this type of long follow-up research, was limited from a statistical viewpoint and therefore the sample sizes would have become too small. The adjusted R2 values are provided as a gauge of the generalisability of the models, as well as the similarity of our findings with the published literature.
The multicentre nature of this study introduced some unavoidable limitations. Most notably, MR scanners and image acquisition protocols differed between patient groups. We cannot exclude the fact that the measured atrophy rates might have varied slightly between image types. Similarly, lesion volumes may differ between the different types of dual echo images. These potential imaging related differences were to some extent accounted for by including a combined ‘imaging protocol’ categorical variable in the statistical models (if significant). Still, the multicentre nature of the study allowed the collection of a large dataset including all MS disease types and varied disease durations that would have been unavailable in most single centres. Due to the retrospective nature of the study, some information could not be collected. A major limitation is the fact that more information on the administration and duration of the DMTs was unavailable, so this parameter had to be coded as a dichotomous variable instead of more comprehensively. Also, we had to restrict ourselves to EDSS scores for disability information. Although EDSS may be a suboptimal outcome measure,38 it is the accepted MS disability standard, is easy to record and can be acquired by phone when patients are unable or unwilling to come for a visit.17 Cognitive evaluation might have also provided valuable insights, but it was unavailable to us. We also could not assess relapse rates or detailed information about the treatment (which had been administered on clinical reasons) as these were unavailable to us for most patients; future (prospective) studies should include the putative prognostic value of relapses in their designs,39 as well as detailed information on the type of treatment and time on treatment. Another limitation is the absence of information on atrophy and lesions in the spinal cord. As three out of the seven functions evaluated by the EDSS have their pathways running through the spinal cord, spinal cord damage, as reflected by MS lesions and spinal cord atrophy, might have a large impact on disability, as expressed by the EDSS,28 although not all studies agree.40 Unfortunately, due to the retrospective nature of our study, spinal cord imaging was not available for our dataset. Future prospective studies should include spinal cord imaging and measurements of spinal cord lesions and atrophy if possible.
In conclusion, this large multicentre study suggests that early brain atrophy rates are related to subsequent long term disability in MS, and that atrophy and lesion volumes have a complementary predictive value. Our findings may help develop predictors of future disability in MS, which could be used in clinical trials and eventually also for predicting the evolution of individual patients.41
Acknowledgments
The authors would like to thank Dr Mark Horsfield (Xinapse Systems Ltd, Northants, UK, http://www.xinapse.com) for generously providing the JIM image analysis package, V.5.0, for the lesion volume measurements.
References
Supplementary materials
Supplementary Data
This web only file has been produced by the BMJ Publishing Group from an electronic file supplied by the author(s) and has not been edited for content.
Files in this Data Supplement:
- Data supplement 1 - Online figure
Footnotes
-
Contributors VP contributed to the design and conceptualisation of the study, analysis and interpretation of the data, conducted the statistical analysis, and drafted and revised the manuscript. FA contributed to the design and conceptualisation of the study, analysis and interpretation of the data, and revising the manuscript. HEH and ICS contributed to the analysis of the data and revising the manuscript. DLK and MPS contributed to the analysis and interpretation of the data, and revising the manuscript. CE, SR, JA, JS-G, AR, XM, BB, OC, ZK, DTC, LM, JP, AG, NDS, PE, AG, CHP and BMJU contributed to the design and conceptualisation of the study, interpretation of the data, and revising the manuscript. MJM and GC contributed to the design and conceptualisation of the study, and revising the manuscript. MF, FB and HV contributed to the design and conceptualisation of the study, analysis and interpretation of the data, and revising the manuscript.
-
Funding This work was supported by the MAGNIMS ECTRIMS Fellowship 2009 awarded to VP. The MS Center Amsterdam is funded by the Dutch MS Research Foundation programme grant 98-358, 02-358b, 05-358c, 09-358d.
Competing interests FA has received funding for travel from Teva Pharmaceutical Industries Ltd, has received speaker honoraria from Bayer Schering Pharma, Sanofi Aventis and Serono Symposia International Foundation, and has received research support from the Italian Ministry of Health. MPS has received speaker honoraria from Biogen-Dompe, Biogen Idec, Merck Serono and Teva Pharmaceutical Industries. She serves as a consultant for Actelion Pharmaceuticals, Biogen Idec, Eidetica and Merck Serono. CE has received funding for travel from Biogen-Idec, Bayer Schering Pharma, Teva Pharmaceutical Industries Ltd, Sanofi Aventis, Merck-Serono and Novartis Pharma. He has received speaker honoraria from Bayer Schering, Sanofi Aventis, Biogen-Idec and Merck-Serono, and has received research support from the Austrian MS Society and the Austrian National Bank (‘Jubiläumsfonds der Österreichischen Nationalbank’). JS-G has received compensation for consulting services and/or speaking from Biogen, Bayer-Schering, Merck-Serono, Sanofi-Aventis, Novartis, TEVA and Almirall. AR serves on scientific advisory boards for NeuroTEC, Bayer-Schering Pharma and BTG International Ltd, and on the editorial board of the American Journal of Neuroradiology and Neuroradiology, has received speaker honoraria from Bayer Schering Pharma, Sanofi-Aventis, Bracco, Merck-Serono, Teva Pharmaceutical Industries Ltd and Biogen Idec, and receives research support from Bayer Schering Pharma. XM has received speaking honoraria and travel expenses for scientific meetings, has been a steering committee member of clinical trials or participated in advisory boards of clinical trials in the past years with Bayer Schering Pharma, Biogen Idec, EMD Merck Serono, Genentech, Genzyme, Novartis, Sanofi-Aventis, Teva Pharmaceuticals and Almirall. OC functions on the editorial board of Neurology and is a clinical editor for CML Multiple Sclerosis. She has received research funding from the Wellcome Trust, MS Society of Great Britain and Northern Ireland, UCL Biomedical Research Centre, and Engineering and Physical Sciences Research Council. She has also received speaker honoraria from Bayer.
-
DTC receives research support from the Multiple Sclerosis Society of Great Britain and Northern Ireland, and holds stock in GlaxoSmithKline.
-
LM is funded by the Medical Research Council, UK.
-
JP has received support for scientific meetings and honorariums for advisory committees from Merck Serono, Biogen Idec, Novartis, Teva and Bayer Schering.
-
NDS serves on a scientific advisory board for Merck Serono, has received funding for travel from Teva Pharmaceutical Industries Ltd and Merck Serono, has received speaker honoraria from Teva Pharmaceutical Industries Ltd, BioMS Medical, Biogen-Dompé AG, Bayer Schering Pharma and Merck Serono, and receives research support from the Italian MS Society.
-
PE has received honoraria for travel expenses from Bayer HealthCare and received a travel grant within the frame of the ECTRIMS/ACTRIMS Congress 2011, Amsterdam, The Netherlands.
-
AG has received honoraria for lecturing, travel expenses for attending meetings and financial support for research from Bayer Schering, Biogen Idec, Merck Serono, Novartis and TEVA Neurosciences.
-
CHP serves on scientific advisory boards for and has received funding for travel and speaker honoraria from Actelion Pharmaceuticals Ltd, Biogen Idec, Bayer Schering Pharma, GlaxoSmithKline, Teva Pharmaceutical Industries Ltd, Merck Serono, Novartis and UCB Roche, serves on the editorial boards of Lancet Neurology and Multiple Sclerosis, and receives research support from Biogen Idec, Merck Serono, Novartis, UCB, European Community Brussels and MS Research Foundation Netherlands.
-
BMJU has received honoraria for consultancy activities from Novartis, MerckSerono, Synthon and Danone Research.
-
GC has received consulting fees for participating on advisory boards from Novartis, Teva Pharmaceutical Industries, Sanofi-Aventis, Merck Serono, Bayer Schering and Actelion, and has received lecture fees from Novartis, Teva Pharmaceutical Industries, Sanofi-Aventis, Merck Serono, Bayer Schering and Biogen Dompè.
-
MF serves on scientific advisory boards for Teva Pharmaceutical Industries Ltd and Genmab A/S, has received funding for travel from Bayer Schering Pharma, Biogen-Dompè, Genmab A/S, Merck Serono and Teva Pharmaceutical Industries Ltd, serves as a consultant to Bayer Schering Pharma, Biogen-Dompè, Genmab A/S, Merck Serono, Pepgen Corporation and Teva Pharmaceutical Industries Ltd, serves on speakers’ bureaus for Bayer Schering Pharma, Biogen-Dompè, Genmab A/S, Merck Serono and Teva Pharmaceutical Industries Ltd, receives research support from Bayer Schering Pharma, Biogen-Dompè, Genmab A/S, Merck Serono, Teva Pharmaceutical Industries Ltd and Fondazione Italiana Sclerosi Multipla, is editor-in-chief of the Journal of Neurology and serves on editorial boards of the American Journal of Neuroradiology, BMC Musculoskeletal Disorders, Clinical Neurology and Neurosurgery, Erciyes Medical Journal, Journal of Neuroimaging, Journal of Neurovirology, MRI, Multiple Sclerosis, Neurological Sciences and Lancet Neurology.
-
FB serves on the editorial boards of Brain, European Radiology, Journal of Neurology, Neurosurgery and Psychiatry, Journal of Neurology, Multiple Sclerosis and Neuroradiology, and serves as a consultant for Bayer-Shering Pharma, Sanofi-Aventis, Biogen-Idec, UCB, Merck-Serono, Novartis and Roche.
-
HV receives research support from the Dutch MS Research Foundation, grant numbers 05-358c, 09-358d and 10-718, has performed sponsored contract research projects for Pfizer, Novartis and Merck-Serono, and has received speaker's honorarium from Novartis (The Novartis Innovation Exchange Lounge, ECTRIMS 2011).
-
Ethics approval The study was approved by the institutional review board of the VU University Medical Center Amsterdam, The Netherlands.
-
Provenance and peer review Not commissioned; externally peer reviewed.