
Abstract
BACKGROUND AND PURPOSE: Two 3D image analysis algorithms, nearest-neighbor tissue segmentation and surface modeling, were applied separately to serial MR images in patients with glioblastoma multiforme (GBM). Rates of volumetric change were tracked for contrast-enhancing tumor tissue. Our purpose was to compare the two image analysis algorithms in their ability to track tumor volume relative to a manually defined standard of reference.
METHODS: Three-dimensional T2-weighted and contrast-enhanced T1-weighted spoiled gradient-echo MR volumes were acquired in 10 patients with GBM. One of two protocols was observed: 1) a nearest-neighbor algorithm, which used manually determined or propagated tags and automatically segmented tissues into specific classes to determine tissue volume; or 2) a surface modeling algorithm, which used operator-defined contrast-enhancing boundaries to convert traced points into a parametric mesh model. Volumes were automatically calculated from the mesh models. Volumes determined by each algorithm were compared with the standard of reference, generated by manual segmentation of contrast-enhancing tissue in each cross section of a scan.
RESULTS: Nearest-neighbor algorithm enhancement volumes were highly correlated with manually segmented volumes, as were growth rates, which were measured in terms of halving and doubling times. Enhancement volumes generated by the surface modeling algorithm were also highly correlated with the standard of reference, although growth rates were not.
CONCLUSION: The nearest-neighbor tissue segmentation algorithm provides significant power in quantifying tumor volume and in tracking growth rates of contrast-enhancing tissue in patients with GBM. The surface modeling algorithm is able to quantify tumor volume reliably as well.
MR imaging provides noninvasive, high-quality images of neuroanatomy and disease processes. Through its ability to detect contrast in soft tissues, MR imaging is well suited to monitor and evaluate cerebral tumors as they develop and respond or, as the case may be, fail to respond to therapy. An algorithm capable of reliably and accurately tracking changes in tumor volume would be of value as an adjunct marker in following up patients with cerebral tumors. Such a method would have direct application in therapy trials in which tumor volume quantification could be used to measure response. Image analysis algorithms may also be used to facilitate the planning of radiation therapy and surgery.
The ability to track change in tumor contrast enhancement is important. There is no method presently in widespread use to quantify tumor volume. A method currently used by the Eastern Cooperative Oncology Group and the Radiation and Treatment Group to determine tumor response to treatment relies on measuring the area of tumor enhancement in a single MR section (1). Response in irregularly shaped tumors is difficult to estimate. The method has difficulty in detecting small lesions, poorly enhanced lesions, and multiple lesions. This method also relies on the hypothesis that the largest area is an accurate adjunct marker for tumor volume. Clarke et al (1), however, concluded that this was not the case.
Much effort has been devoted to the development and testing of semiautomatic and automated tissue segmentation algorithms as well as to the optimization of scanning protocols (2). Factors that can determine the quality of segmented images and the feasibility of using a specific algorithm have been discussed often (3). For example, the time required for an algorithm to generate volumes for specific tissues is important in a clinical setting (1). The time required for segmentation decreases as the segmentation process becomes less operator dependent. Decreasing the amount of time needed for segmentation is desirable as long as accuracy is not sacrificed. Stereotaxic space, a coordinate system applied across scan data to relate data from different patients and different time points in a common 3D space, has been used to advance segmentation techniques. Bayesian segmentation models provide additional advantages, drawing on empirical information as to the location of tissue classes in stereotaxic space (4).
As part of a comprehensive longitudinal study of patients with high-grade gliomas, we analyzed the performance of two different algorithms in their ability to segment tissue (eg, contrast-enhancing tumor) and to follow or track changes in tumor tissue over time. The term modeling, as used in the literature and in this study, may be defined as the creation of digital representations of tissue elements whose shape and volume can be quantified using computer algorithms for the purpose of tracking volumetric changes in tissue. Two 3D image analysis algorithms, one a nearest-neighbor–based tissue segmentation algorithm, the other a surface modeling algorithm, were applied to serial MR images. The algorithms operate on different principles to determine tumor volume: the nearest-neighbor approach uses manually identified tag points to assist in classifying tissue types while boundary and volumes are calculated automatically. The surface modeling algorithm relies on manual segmentation while volume determination is automated. Volumes of contrast enhancement and rates of volumetric change were determined by both algorithms. The tissue segmentation algorithm was used to create 3D maps of peritumoral edema, cystic compartments, and CSF volumes, as well as to track changes in adjacent white and gray matter.
The goal of this study was to compare the automatic tissue segmentation and surface modeling algorithms with manually segmented maps, which served as a standard of reference, to understand the advantages and limitations of these two approaches to tissue volume analysis in terms of their ability to measure tumor growth. Finally, we review the uses of 3D structural maps in neurooncology and the potential for automated registration to accelerate tissue classification and subsequent image analysis.
Methods
The subjects consisted of 10 patients with pathologically confirmed glioblastoma multiforme (GBM). Patients ranged in age from 4 to 54 years (mean age, 40.0 ± 14.7 years) and were examined with MR imaging between two and six times. Before or during the scan interval, patients underwent surgery and received chemotherapy or radiation therapy or a combination of both.
Image Protocol
MR images were acquired using a 1.5-T system. The images consisted of contrast-enhanced T1-weighted sequences with parameters of 550/8/2 (TR/TE/excitations), a 3-mm slice thickness with no interslice gap, a 256 × 256 matrix, and a 25-cm field of view, and T2-weighted sequences with parameters of 6000/14,126/2, a 3-mm slice thickness with no interslice gap, and a 256 × 256 matrix (Fig 1). Images were subsequently aligned and segmented on 180 MHz R10000 SGI workstations. Image volumes were aligned into Talairach stereotaxic space using six-parameter rigid transformation (5). Alignment was performed across time and across T1- and T2-weighted sequences. Both automated and manually assisted registration software, developed at the UCLA Laboratory of Neuro Imaging, was used for the alignment (6). Images were manually aligned to a population-based average brain data set (7, 8). The algorithms were applied independently to the patients' images. Since application of each algorithm was independent of the others and of previous or subsequent results, tumor volumes were unaffected by the order in which the algorithms were applied.
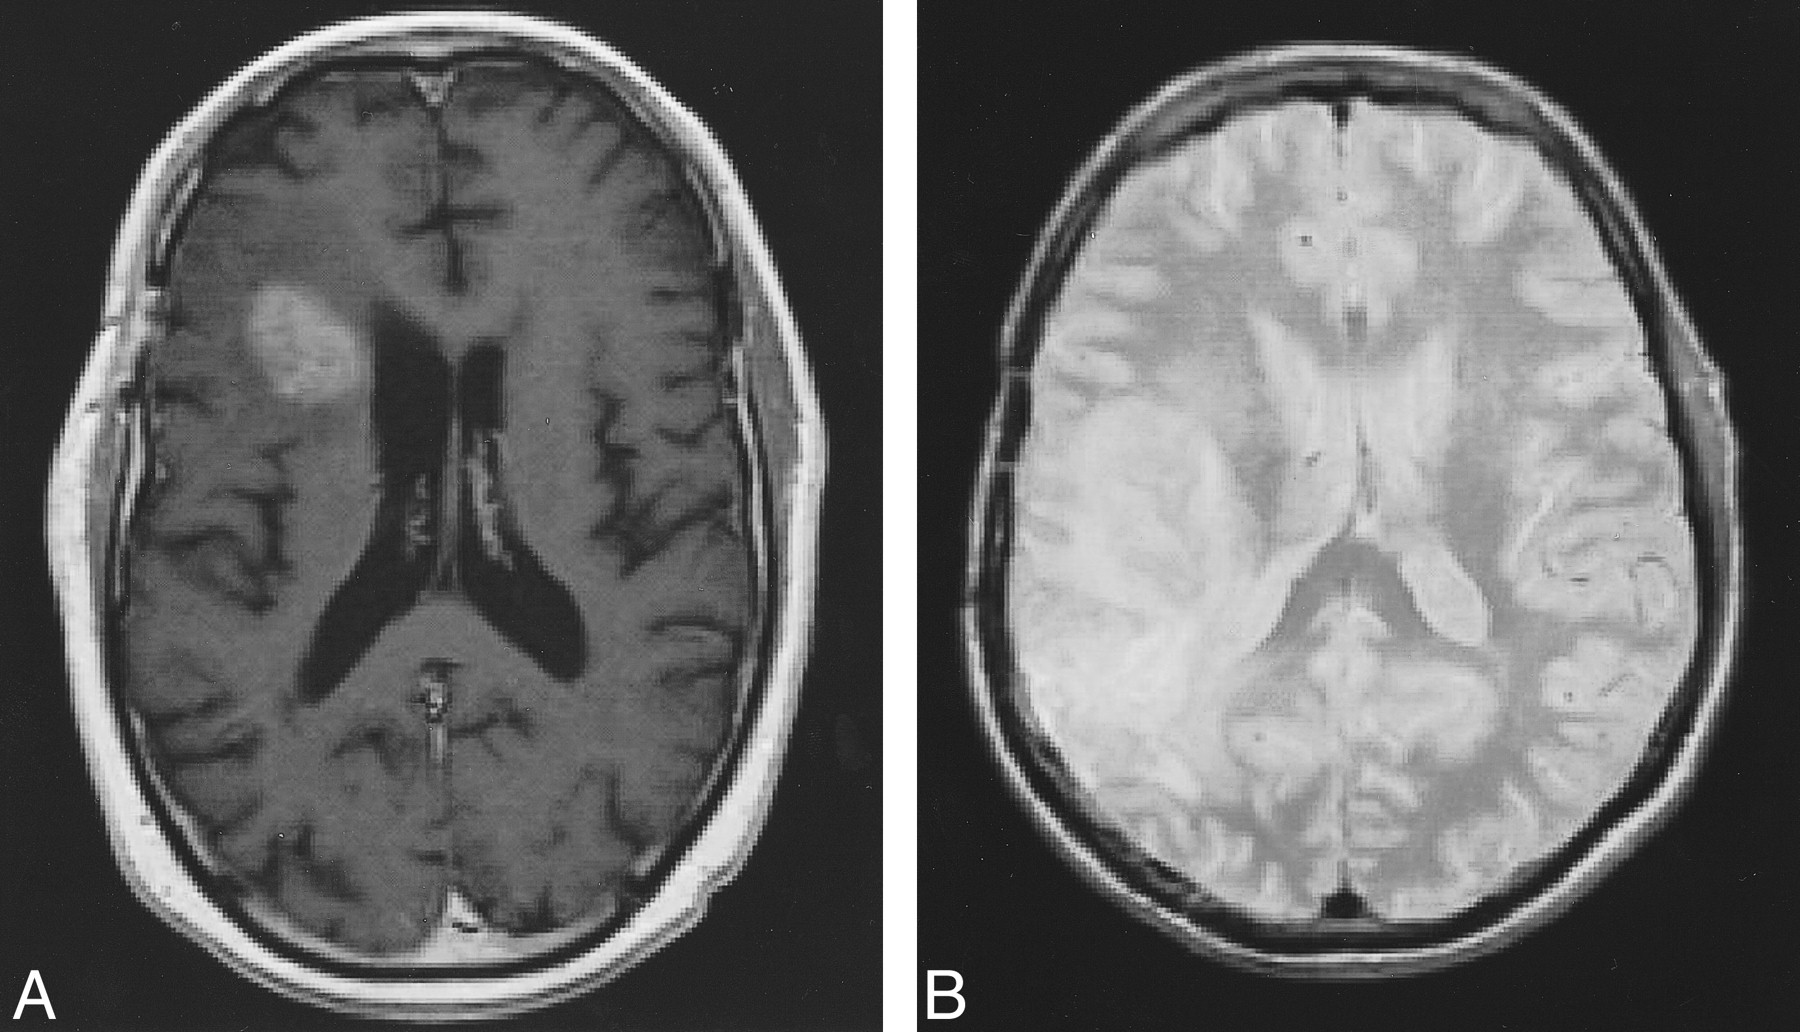
Examples of MR images that may be used for segmentation.
A, Contrast-enhanced T1-weighted image (500/8/2).
B, T2-weighted image (6000/14/2).

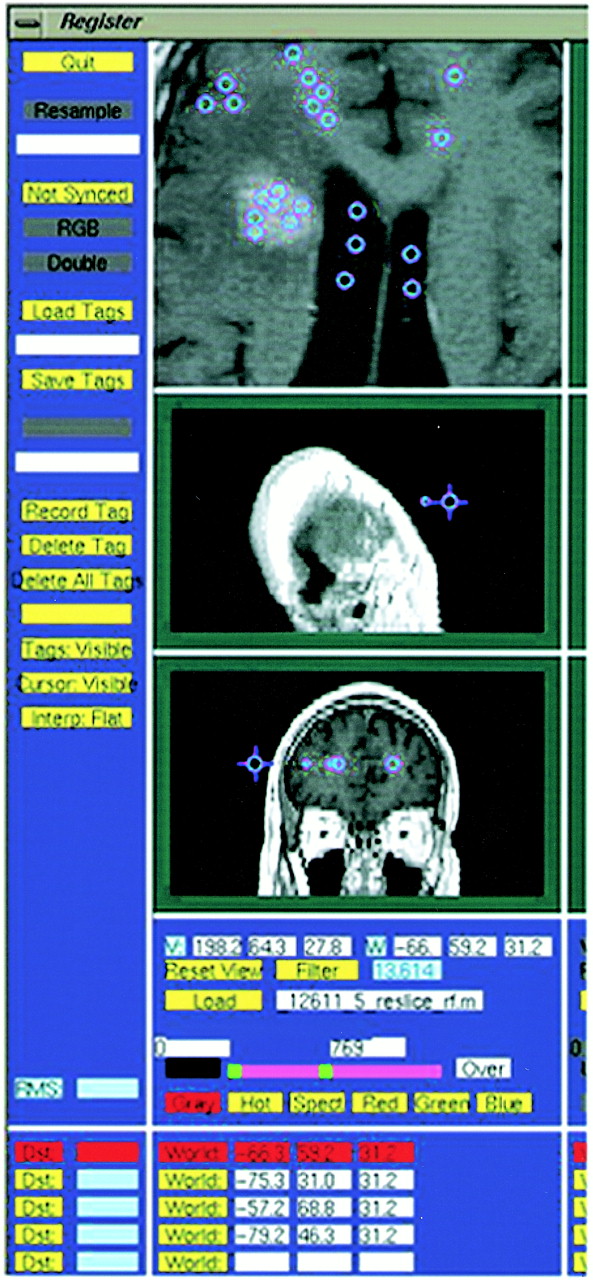
This T1-weighted image (500/8/2) illustrates the selection of tag points by an operator. The accuracy of segmentation is dependent on tag points representing the various tissue types being segmented
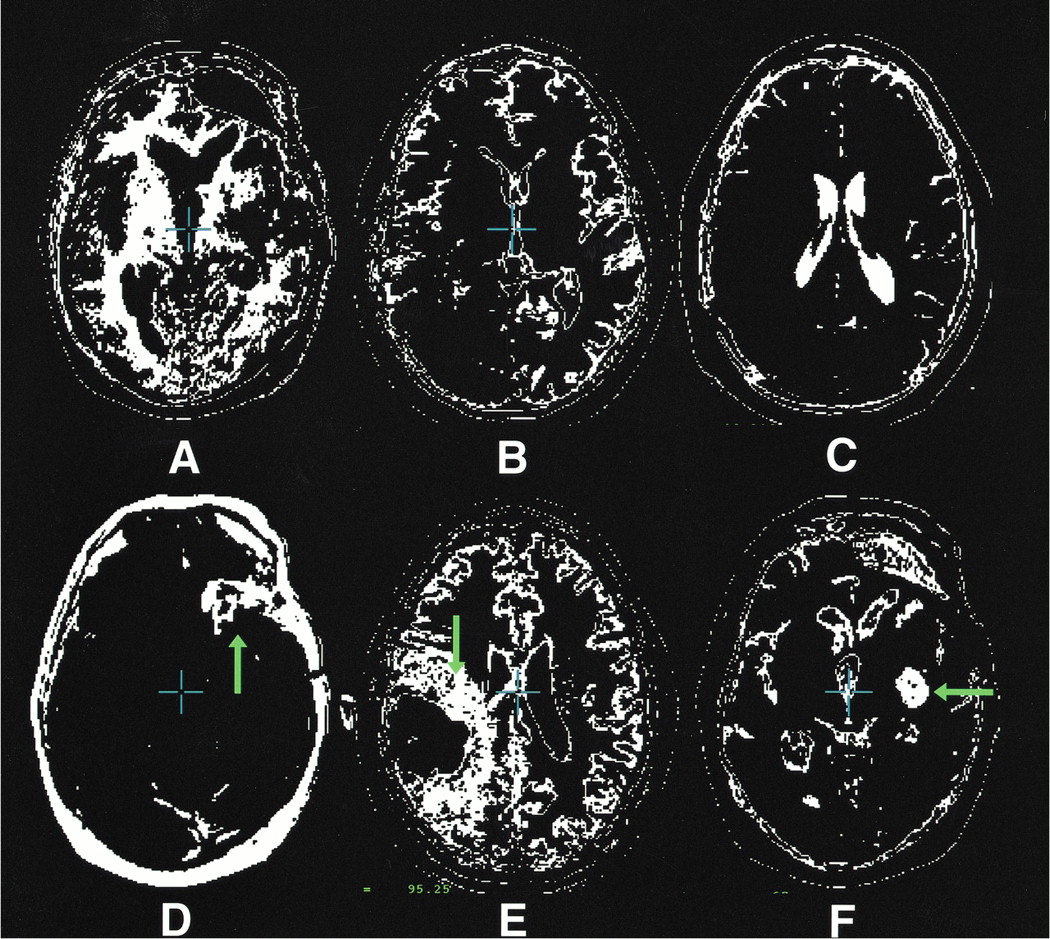
The segmentation maps illustrated in this figure are representative of the types of maps generated by the nearest-neighbor algorithm. They were taken at a variety of levels from more than one patient.
A, White matter.
B, Gray matter.
C, CSF.
D, Tumor contrast enhancement (arrow).
E, Edema (arrow).
F, Cystic compartment (arrow).

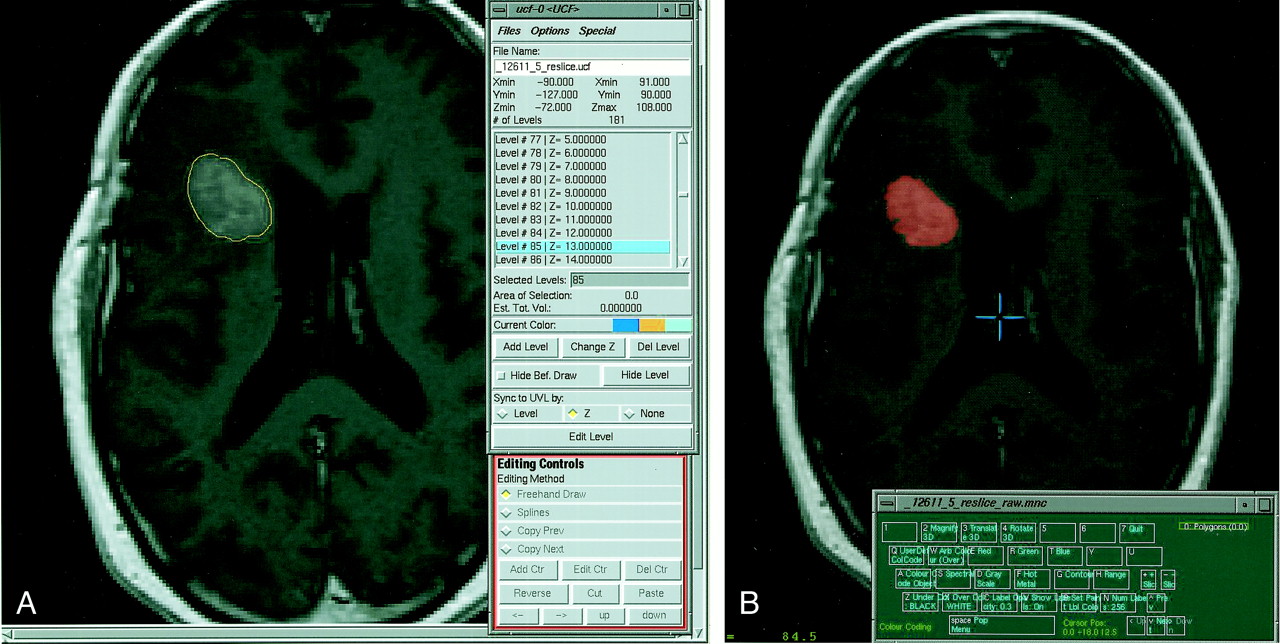
A, This contrast-enhanced T1-weighted image (500/8/2) illustrates the tumor boundary defined by an operator as part of the surface modeling algorithm approach to volume analysis.
B, This figure illustrates the process of generating the manually defined standard of reference. An operator overlays a chosen color on a specific tissue type (contrast-enhancing tumor tissue in the case of this study). Accuracy is improved by varying the image and color overlay intensity and magnitude. Despite techniques to improve accuracy, the process remains subjective.
The nearest-neighbor approach, using manual or propagated tagging, is capable of automated segmentation and volume determination. The following protocol was used for nearest-neighbor tissue segmentation: 160 tags were selected (170 when there was a cystic compartment), representing points in white matter, gray matter, CSF, background (extracranial regions of the image), tumor, edema, and cystic components (when present) (see Fig 2). Both direct tagging and tagging via the propagation of tags through scan series were used. In other words, tissue samples could often be identified on later scans by anatomically registering the scan with previously labeled data sets from the same patient. All images were RF corrected before segmentation to eliminate any signal fluctuations due to magnetic field distortions in the scanner (9). Segmentation was performed through the use of population-based tissue maps. These maps, containing probabilistic information on tissue locations in stereotaxic space, were automatically aligned with the scan data and adjusted for herniation effects with nonlinear registration. The population-based tissue maps were used to determine a gaussian function, a unimodal bell-shaped probabilistic distribution reflecting the intensities of specific tissue classes at each time point in the scan series. A nearest-neighbor algorithm was then used to differentiate tissue types, and its accuracy was confirmed by tagging individual points in each anatomic region. Tissue maps for tumor, peritumoral edema, white and gray matter, CSF, and cystic compartments were then generated (see Fig 3). These tissue maps were manually adjusted to delineate class boundaries better, and the results of automated and manually segmented standards of reference were compared in terms of their ability to measure absolute volume and track changes in each MR sequence. The procedure was repeated for subsequent images in the patient series by rigidly aligning each subsequent scan to the primary scan with Automated Image Registration software (6). The process of registration, tagging, and generating a segmentation map takes approximately 10 to 12 minutes per scan. The time needed to adjust boundaries varies significantly; it may take anywhere from no time to 15 minutes.
For the surface modeling algorithm, the following steps were performed: first, using a graphic user interface, a single image from a multispectral image set was displayed (Fig 4A). An operator defined the boundaries of the tumor. Accuracy of boundary delineation was enhanced by the operator's ability to increase the image scale and vary image intensity. The traced boundary generated a large number of sample points. The algorithm then converted the set of traced points into a tiled parametric mesh model. The algorithm does this by uniformly redigitizing the points at each level in the adjacent sections and reconstructing the surface using triangular tiles (10) (Fig 5). The principle is analogous to stretching a net over an object. Volumes are then determined from the mesh models. The time required to generate volumes varies with the size and complexity of the border being defined but may range from a few minutes to 40 minutes. Results from the surface modeling algorithm were also compared with manually defined standards of reference.
The manually segmented standard of reference was generated by an experienced operator who defined the tumor boundaries. By using a graphic user interface, an image from the multispectral data set was displayed. An operator overlaid color, in shades of red or green, on pixels of the selected tissue type, consisting of contrast-enhancing tissue in the case of this study (Fig 4B). The intensity of the overlaid label and of the underlying image may be adjusted so as to improve accuracy in defining a tissue class. The time required to manually segment contrast-enhancing tissue varies from several minutes to 45 minutes depending on the nature and complexity of the tumor (see Fig 6). It is important to note that any method based on operator-defined tumor boundaries is subjective. The Table provides a summary of the two algorithms and the standard of reference.
Comparison of nearest-neighbor segmentation, surface modeling, and the manually defined standard of reference in terms of operator input and accuracy
Data Analysis
Absolute and serial changes in tissue parameters for volumetric results from the tissue segmentation and the surface modeling algorithm were compared using manual and progressively more automated methods. A Pearson linear correlation coefficient was derived to determine the significance of the volume quantification and growth rate determination.
Validation
Manually segmented images served as a standard of reference against which the performance of the algorithms were judged. As in the study of Velthuizen et al (11), a single operator-generated standard may be used as a standard of reference to assess the performance of segmentation algorithms. In this study, intra- and intersubject accuracy and reproducibility were maximized by repeated image assessment.
Results
Enhancement Volumes
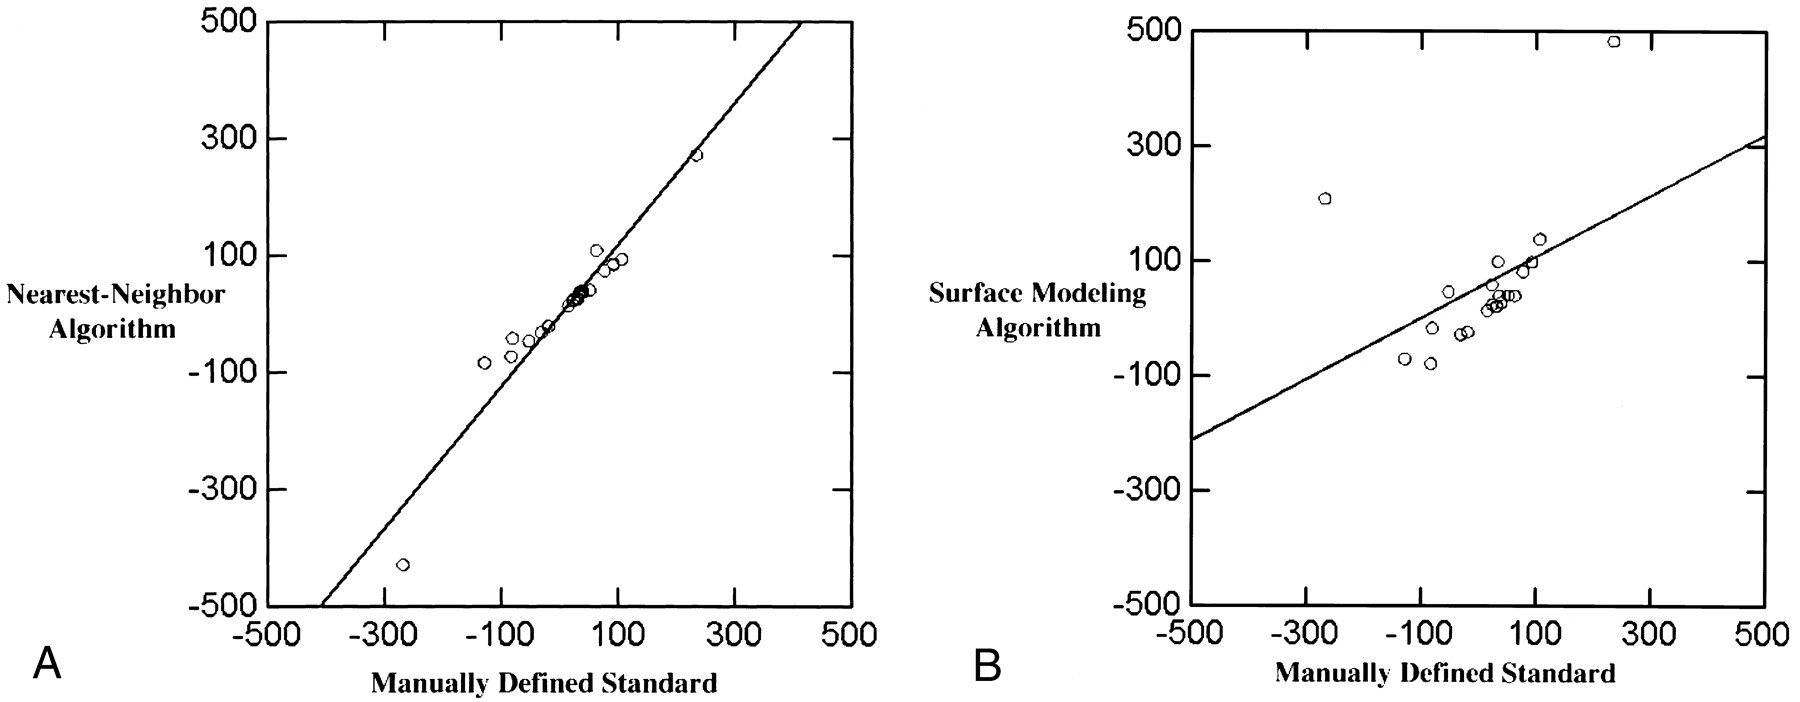
In all, 42 images from 10 patients with histologically confirmed GBMs were analyzed using the nearest-neighbor algorithm. Tumor enhancement volumes as determined by the nearest-neighbor algorithm were highly correlated with volumes derived directly from manually segmented images, the standard of reference (r2 = .99, see Fig 7A). The volumes of enhancement as determined by the nearest-neighbor algorithm were on average 9.4% less than those of the manually defined standard (mean standard of reference, 20.3 cm3 ± 22.9; mean algorithm, 18.4 cm3 ± 22.1). However, this underestimation reflected a mean difference of only 1.9 cm3 (SD difference of 0.8). Twenty-nine T1-weighted contrast-enhanced images were analyzed using the surface modeling technique. Tumor enhancement volumes as determined by the surface modeling algorithm were also highly correlated with the manually segmented standard of reference (r2 = .94; mean standard of reference, 23.4 cm3 ± 27.1; mean surface modeling, 23.4 cm3 ± 31.5; SD difference, 4.4) (see Fig 7B).

The basic principles behind the surface modeling algorithm, which uses a parametric mesh approach, are as follows: an operator defines the structure of interest by tracing points on a 2D MR slice, the algorithm uniformly redigitizes the points at each level of the image for the region of interest, the points from adjacent sections are then sewn together using triangular tiles, and the result is a tiled parametric mesh model from which volumes are calculated

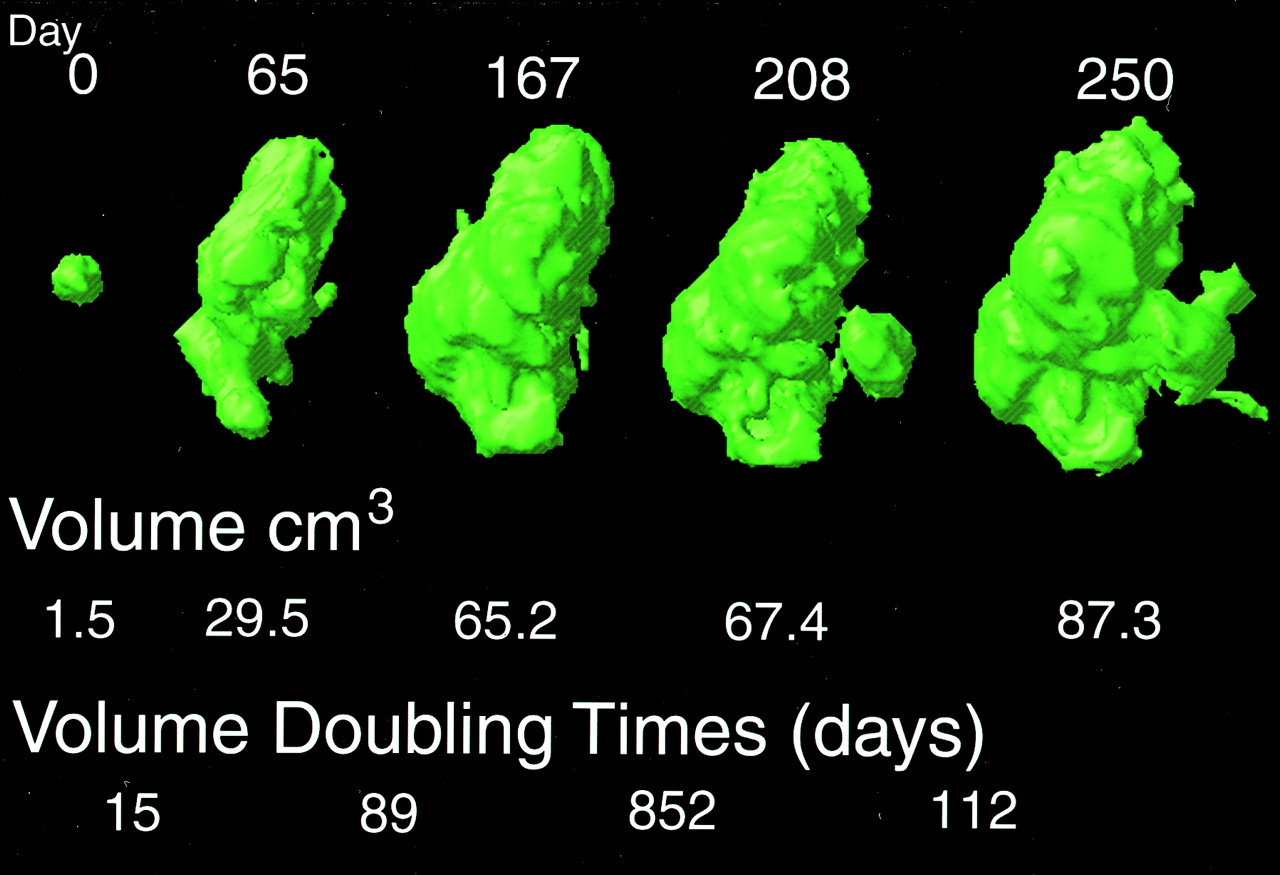
This figure shows the change in contrast enhancement and the corresponding growth rates computed from a manually defined standard over a 250-day period in a 44-year-old subject. By generating volumetric data across time, the patient may be tracked and response or nonresponse to therapy documented
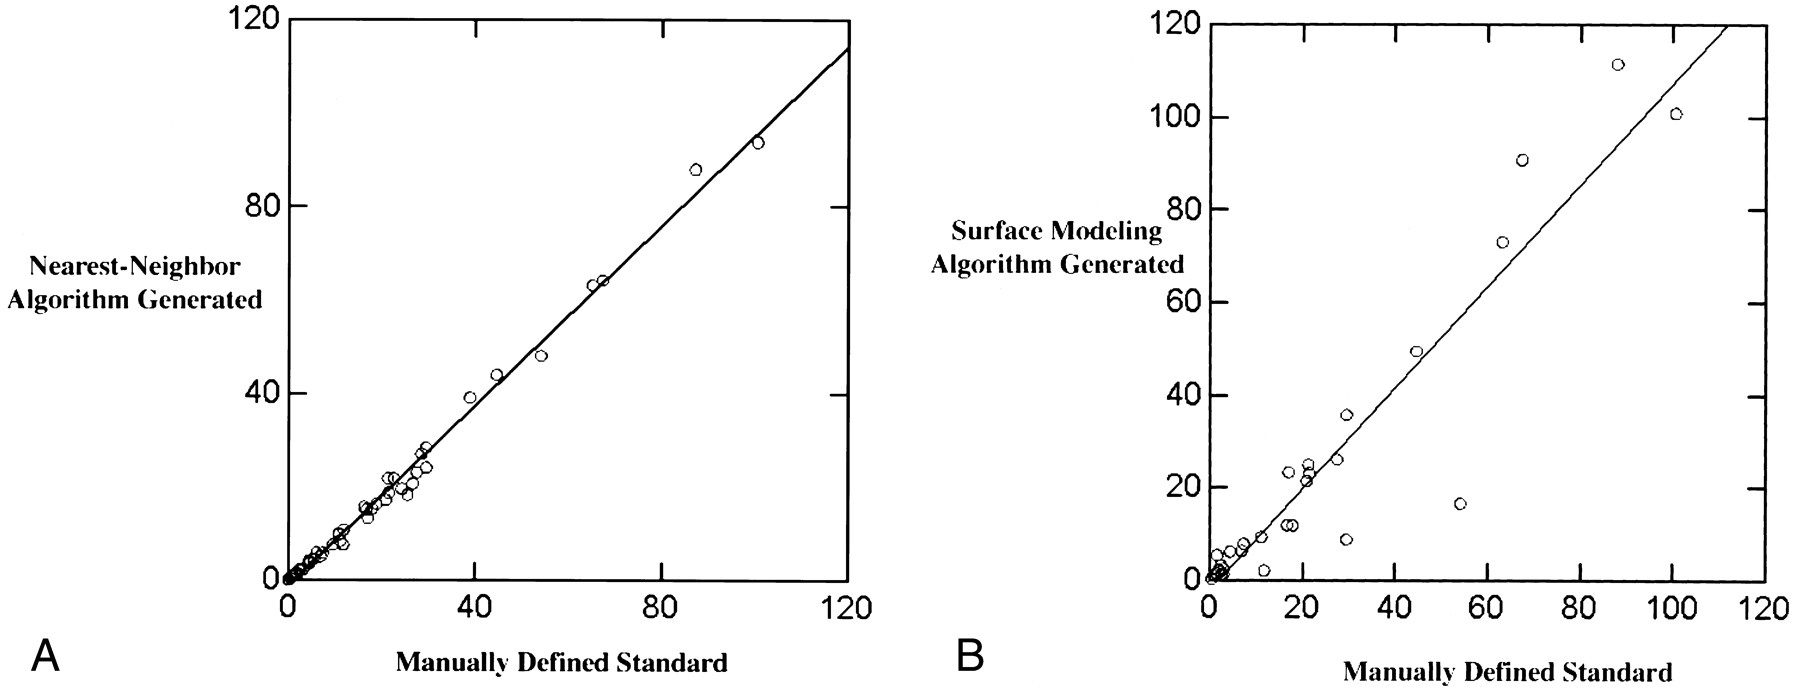
A, The nearest-neighbor generated enhancement volumes (cm3) are highly correlated (r2 = .99) with the manually defined standard. Though not able to duplicate the volumes as determined manually, the nearest-neighbor algorithm is systematic and accurate in its ability to quantify tumor volume based on contrast-enhancing tissue volumes.
B, The surface modeling algorithm generated enhancement volumes (cm3) are also highly correlated (r2 = .94) with the manually defined standard. It is unable to separate nonenhancing necrotic areas from surrounding enhancing areas and cannot generate volumes based on noncontiguous lesions. Therefore, the surface modeling algorithm has a tendency to overestimate and underestimate enhancement volumes to a greater degree than does the nearest-neighbor algorithm.
Growth Rates
Growth rates were calculated in terms of halving times or doubling times for change in tumor enhancement volumes according to the following formula:  where T* is the doubling time or halving time, t is the interval time in days, and Vo and V are the volumes at the onset of the interval and at the end of the interval period, respectively.
Growth rates are sensitive enough to determine response to treatment (12). The growth rates determined by the nearest-neighbor algorithm were highly correlated with the manually defined growth rates (n = 21, r2 = .96; mean standard of reference, 9.7 days, SD, 99.8 days; mean algorithm, 8.5 days, SD, 125.8 days) (see Fig 8A). The growth rates as determined by the surface modeling algorithm were not significantly correlated with manually defined growth rates (n = 21, r2 = .45; mean standard of reference, 9.7 days, SD, 99.8 days; mean surface modeling algorithm, 59 days, SD, 117.3 days) (see Fig 8B).
A, Growth rates (in days) measured in terms of halving times and doubling times for the nearest-neighbor algorithm are highly correlated with the growth rates for the manually defined volumes (r2 = .96).
B, Growth rates (in days) generated from the surface modeling algorithm were not highly correlated with growth rates generated from the manually defined standard of reference (r2 = .45).
Discussion
In an effort to improve reliability and to develop more automated approaches to tumor volume quantification, various approaches have been developed. Pattern recognition is a term often used to describe the decision-making process of specific segmentation techniques (13). Pattern recognition methods, which include a set of promising segmentation algorithms, are divided into those that rely on operator input (supervised) and those that do not depend on operator input (unsupervised). Bezdek et al (4) present a thorough review of MR image segmentation approaches based on statistical pattern recognition. Supervised methods may be based on a number of algorithms that depend on human assistance in assigning value to data sets: labeled maximum, nearest-neighbor, and feed forward neural network are examples of such algorithms. Artificial neural networks, which are used for supervised pattern recognition, have been tested and studied (14, 15). Unsupervised methods may be based on such algorithms as the unsupervised maximum likelihood method and the hard and fuzzy c–means algorithms (4). Surface reconstruction, another supervised segmentation technique, is based on an operator defining the boundary of a structure. The surface modeling algorithm, a surface reconstruction algorithm, has been successfully applied to determine dynamic growth patterns (16). As part of this study we chose to compare a nearest-neighbor algorithm (a supervised pattern recognition approach) and a surface modeling algorithm (a surface representation approach).
The nearest-neighbor tissue segmentation algorithm and the 3D surface modeling algorithm are both capable of accurately and reliably determining the volume of contrast enhancement in malignant gliomas. Contrast-enhanced volumes determined through the tissue segmentation algorithm were highly correlated with measurements from manually segmented images (r2 = .99). Nonetheless, the volumes of enhancement as measured by the algorithm were on average 9.4% less than those of the manually defined volumes. The surface modeling algorithm volumes were also highly correlated with the manually defined volumes (r2 = .94). These approaches may provide an accurate quantitative approach to following tumor change in individual patients and in groups of patients (see Fig 6). In addition, the structural models generated by these methods represent 3D and 4D structural maps that may be correlated with data from other techniques for direct comparison or partial volume correction (3).
The nearest-neighbor algorithm has been reviewed in the literature and used in prior studies (1, 2, 4, 13, 17). In a recent study by Kaus et al (18), a nearest-neighbor algorithm accurately determined volumes of meningiomas and low-grade gliomas. The nearest-neighbor algorithm, one of the algorithms reviewed by Bezdek et al (4), offers certain advantages while conceding certain weaknesses. Some of its advantages are as follows: 1) it provides stable segmentation (4, 13, 16, 17, 19); 2) it can detect anatomically relevant structures in areas in which more automated algorithms have difficulty (10, 16); 3) it is robust to changes in scanner protocol (TR/TE), including changes in the noise level of the images; and 4) it is one of the quickest algorithms in terms of operator input and execution time (4, 17).
The surface modeling algorithm has been used previously to map growth patterns in children (16), to detect asymmetry in cortical patterns, and to analyze corpus callosum morphology in schizophrenic patients (20). The algorithm sets up point-by-point correspondences between surfaces, enabling change to be tracked on a point-by-point basis over time (see Fig 7). The models generated are highly detailed, the level of detail being greater than that provided by the tissue segmentation approach. Though the level of detail provided may exceed that required to follow up patients accurately and determine whether they are responding to therapy, it may prove useful in creating structural models highlighting focal change, which may be analyzed to determine the effects of multiple therapies (eg, whether the therapies act synergistically or antagonistically). Lopez et al (19) have developed a model-based approach to determine the interactions of multiple cancer therapies in mice. The surface modeling algorithm might warrant the time investment needed to elucidate the effects of multiagent therapies on human gliomas.
Each algorithm is well suited for quantifying changes in contrast enhancement tumor tissue while the nearest-neighbor algorithm is also reliable in tracking change in growth rates. It is worth noting that contrast enhancement is not the tumor itself but rather the local breakdown of the blood-brain barrier with subsequent extravasation of contrast agent into the surrounding parenchyma. As such, contrast enhancement serves as an adjunct marker for tumor volume. The enhancement volumes generated by tissue segmentation were highly correlated with the manually defined volumes, more so than the volumes generated by surface modeling. There are two reasons for this: 1) the tissue segmentation algorithm can track contrast enhancement while excluding nonenhancing areas; the surface modeling algorithm generates a volume for the entire region, including nonenhancing necrotic areas enclosed within the defined surface boundary; and 2) multiple lesions can be detected by the tissue segmentation algorithm while the surface modeling algorithm detects only a single defined contiguous volume. For these two reasons, the surface modeling algorithm has a tendency to overestimate and underestimate to a greater extent than does the tissue segmentation algorithm, the degree to which depending on the tumor complexity. The tendency toward greater variability of the surface model as compared with that of the nearest-neighbor algorithm accounts for the inability to correlate the growth rates derived from the surface modeling algorithm significantly with those derived from manual segmentation. A determination of growth rates depends on use of the natural log of the quotient of the ending and onset volumes. Increased variations in the ending and onset volumes are magnified when taking the natural log of this quotient, which is likely to account for the inability of the surface modeling algorithm to correlate significantly with growth rates derived from the standard of reference.
Although both algorithms are operator dependent, the nearest-neighbor tissue segmentation approach requires less operator time. Surface modeling requires the operator to define the structure in question at each level in each image. These anatomic surfaces are complex in geometry and at times poorly enhancing, which makes it difficult to capture the boundaries and may in part explain the poor performance of the surface modeling algorithm as compared with the nearest-neighbor algorithm. The tissue segmentation algorithm, on the other hand, requires an operator to choose a number of tag points. Although this may take time (10 to 12 minutes) initially, the tag points may be transferred through the use of automated image registration and adjusted to fit subsequent images (6). This substantially reduces the time required to initiate the algorithm to only several minutes. Though requiring more time, a strength of the surface modeling technique is that it renders models in greater detail, so focal change may be more readily followed; this is accomplished by the algorithm's ability to track change across time on a point-by-point basis.
Although each algorithm is able to quantify tumor volume, neither is able to distinguish radiation necrosis from tumor tissue. In fact, conventional imaging does not reliably distinguish between radiation necrosis and progressive tumor growth. Distinguishing increased contrast enhancement due to radiation necrosis from tumor growth depends on determining the origin of the change in the enhancing lesion. Providing insight into cellular changes, MR spectroscopy has shown promise in distinguishing between radiation necrosis and tumor progression (21).
An important issue for any segmentation algorithm is variability. Variability may further be thought of in terms of precision, reproducibility, and objectivity. Studies indicate that the degree of variability is dependent on the type of segmentation method, the tissue being segmented, and the chosen scanning parameters (16). Vaidyanathan et al (22) found that the inter/intraoperator reliability for nearest-neighbor segmentations was 9% and 5%, respectively, when multispectral segmentation was used. Another study found operator variation in determining boundaries to be a major source of error, at times no less than 26% of points were disputed between operators (23). The interoperator variability of the algorithms, such as the nearest-neighbor approach, may be lower than the variability of manual segmentations (16). Kaus et al (18) reported greater reproducibility with the nearest-neighbor algorithm than with the use of manual segmentation. In summary, if the variability of the algorithm-generated segmentation volumes falls within the range of the manually segmented volumes, and the mean algorithm volumes have a known relationship to manually segmented volumes, then algorithm-generated volumes may be statistically indistinguishable from manually segmented volumes and should be treated as on a par with them.
Minimal variability is desirable, and the use of algorithms offers the potential to reduce variability in multicenter clinical trials. With the potential that segmentation volumes will be used to assist in planning surgery, the issue of variability may then be raised in regard to surgical resection in patients with GBM. Gross total resection has been shown to increase performance status and to improve neurologic symptoms (24, 25). The degree to which the extent of resection affects survival is still controversial (26), although some studies have shown increased survival with increased extent of resection (27, 28). Gross total resection with reduction of tumor burden is, on the other hand, noncontroversial as a principle of neurooncology for improving patients' functional status (25). Decisions regarding extent of tissue resection are made by the neurosurgeons. The extent to which variability in the algorithm may affect resection decisions depends on the extent to which neurosurgeons rely on algorithm volumes over their clinical experience.
The strong correlation between the manually defined volumes and the algorithmically generated volumes suggests that the algorithms are capable of detecting and following change relative to the standard of reference. This ability is important. The rate of tumor volume change as measured by halving time and doubling time represents a parameter sensitive enough to predict therapeutic response (12). With a large number of chemotherapy trials underway and currently being planned, the need exists for a protocol that can measure tumor response in a large number of patients. Such a protocol must be accurate and reliable, and preferably have a low level of operator input. The data presented here and in other studies indicate that the nearest-neighbor algorithm is robust and could play a role in therapeutic trials (1, 4, 17, 22).
Besides tracking the volumetric changes in tumor, 3D structural maps provide a framework in which other data may be analyzed. Analyses may be carried out while maintaining the integrity of the positional relationship between the various data sets and to neuroanatomy. Positron emission tomography (PET), MR spectroscopy, and diffusion imaging data may be aligned with 3D structural maps for multitechnique correlation and partial volume correction (29). MR spectroscopic data have aided in the discrimination between tumor recurrence and radiation necrosis (21) and have shown an increased choline/creatine ratio in high-grade gliomas (30). A study by Gupta et al (31) provided a good example of the power of linking various imaging techniques. Using MR spectroscopy and diffusion-weighted MR imaging, these authors found an inverse relationship between choline signal and apparent diffusion coefficient. In a study by Nairi et al (32), PET scans were registered to a 3D reconstruction of the cortical surface to delineate gyral structure from infiltrative tumor better. The results were encouraging, although additional study of the relationship between tumor growth and metabolic change is needed.
Conclusion
This study has shown that the nearest-neighbor tissue classification algorithm and the 3D surface modeling algorithm can both generate 3D structural maps of tumor enhancement volumes that are highly correlated with manually segmented volumes, and that rates of growth may be accurately tracked. The generated maps monitor the volume of tumor enhancement at a specific time and over the course of time. Three- and four-dimensional mapping of tumor change will gain momentum as technical advances are made and the possibilities of these techniques are realized.
Acknowledgments
We extend our thanks to Andrew Lee for his help with the images presented in this study.
Footnotes
1 Supported by grants NIMH/NIDA (P20 MH/DA52716), P41 NCRR (RR13642); NLM (LM/MH05633, NSF (BIR 93-22434), NCRR (RR05956), and NINCDS/NIMH (NS38753), NCI CA76524, ACS EDT-119.
↵2 Address reprint requests to Dr. Arthur W. Toga, Laboratory of Neuro Imaging, Department of Neurology, Division of Brain Mapping, University of California at Los Angeles School of Medicine, 4238 Reed Neurology, 710 Westwood Plaza, Los Angeles, CA 90095.
References
- Received February 4, 2000.
- Copyright © American Society of Neuroradiology


