
Abstract
BACKGROUND AND PURPOSE: Previous studies have primarily used single-voxel techniques to obtain MR spectra from the neonatal brain. In this study, we applied 3D MR spectroscopic imaging techniques to detect the spatial distribution of MR spectroscopic imaging–detectable compounds in premature and term infants. The goals were to test the feasibility of obtaining 3D MR spectroscopic images of newborns, assess the spatial variations of metabolite levels, and determine age-dependent differences in MR spectroscopic imaging data.
METHODS: MR spectroscopic imaging data were acquired from nine premature (postconceptional age, 30–34 weeks) and eight term (postconceptional age, 38–42 weeks) neonates, all with normal clinical and neurologic outcomes. A specialized point-resolved spectroscopy sequence with very selective saturation pulses was used to select a region encompassing the majority of the brain. Phase encoding in three dimensions was performed in a 17-minute acquisition time to obtain 3D spectral arrays with a 1.0 cm3 nominal spatial resolution.
RESULTS: This study showed the feasibility of detecting the 3D distributions of choline, creatine, and N-acetylaspartate resonances in the neonatal brain. Significant spectral differences were detected among anatomic locations and between the premature and term groups.
CONCLUSION: This initial study indicates that 3D MR spectroscopic imaging of the neonatal brain can detect anatomic and age-dependent variations in metabolite levels. This technique seems to be a powerful tool to assess the metabolic differences between anatomic regions and to follow the changes in cellular metabolites with brain maturation. This study also indicates the need for determining topologic and age-matched normative values before metabolic abnormalities in neonates can be accurately assessed by MR spectroscopy.
Previous studies have shown that MR spectroscopy can provide a unique and clinically important assessment of neonatal brain metabolism (1–12). In addition, studies have indicated an important role for single-voxel MR spectroscopy in the assessment of neonates with neurologic abnormalities, especially premature infants and those with suspected neonatal asphyxia (4–12). In these studies, spectra obtained from one or two voxels of 5 cm3 or greater have shown promising results; however, the single-voxel techniques are very limited in spatial coverage, spatial resolution, and information content. The large voxels average many different areas of the brain, all of which may have different ratios of metabolites because of differing inherent functions and differing levels of maturity. Thus, biochemical abnormalities in small regions of the brain (eg, subthalamic nucleus, caudate nucleus) might be missed because of averaging with surrounding normal areas. More importantly, abnormalities might be overlooked because the normal biochemical profile of the specific topological region at the specific age in question is not known. Recently, however, techniques for 3D MR proton spectroscopic imaging have been developed that allow spectra to be obtained from thousands of voxels throughout the adult brain at 1 cm3 resolution (13, 14). In this study, high-resolution 3D MR spectroscopic imaging techniques were applied to the neonatal brain studies to assess normal metabolite levels for premature and term neonates. A detailed assessment of the normal distribution of metabolite levels in the developing brain is important to improve our understanding of brain biochemical development and to establish a normal reference for determining abnormal metabolism in pathologic states. Establishing normative MR spectroscopy values requires both high spatial resolution and 3D coverage because metabolite levels in newborns vary dramatically with both postconceptional age and anatomic location.
Methods
Study Participants
Our patient population consists of 17 neonates who were studied by 3D MR spectroscopic imaging. Nine neonates were born prematurely and were studied by MR imaging within 21 days of birth at postconceptional ages between 30 and 34 weeks. Eight term neonates were studied 4 to 10 days after birth; their postconceptional ages ranged between 38 and 42 weeks. All these neonates were enrolled in studies evaluating the value of MR imaging in the assessment of neonatal brain damage. All had normal developmental and neurologic outcomes at 12 months of age. The study protocol was approved by our institutional review board, and parental consent was obtained for all infants included in this study.
Premature Neonates
All the premature neonates had either grade I or grade II germinal matrix hemorrhage (as determined by transfontanel sonography) or were born to a mother with a clinical diagnosis of chorioamnionitis. None of these neonates ever had clinical evidence of neurologic dysfunction. Those with clinical, laboratory, or radiologic evidence of brain injury, inborn error of metabolism, or congenital malformation were excluded from the study. The MR examination was performed when the infant was judged by the attending neonatologist to be stable enough to be transported to and from the MR imager and studied safely. Sound protection was provided by placing cotton in the external auditory canals and cotton ear muffs over the ears. Warmth was provided by imaging the neonate in a plexiglas cylindrical MR imaging–compatible isolette and by placing chemical blankets above and below the neonate to keep a constant temperature of 37°C. The infants were fed immediately before the study and slept through the procedure; thus, sedation was not used.
Term Neonates
The term neonates included in this study were a subset of the control participants in a study of perinatal asphyxia who met the inclusion/exclusion criteria for this study and had normal neurologic outcomes. Only those patients with normal clinical findings and normal imaging results at the time of the MR imaging/MR spectroscopic imaging examination and also normal developmental and neurologic outcomes at 12 months of age were included in this study of normal MR spectroscopic imaging evolution. Only newborn term infants of a gestational age of ≥38 weeks were included. Exclusion criteria were evidence of in utero or perinatal infection, major anomalies of the brain or other major organ systems, and evidence of congenital metabolic diseases. Although all radiologic and clinical measures indicated that these infants were normal, one cannot inconclusively rule out metabolic abnormalities undetectable by these clinical assessments.
MR Imaging Protocol
All studies were performed on a 1.5-T Signa EchoSpeed system (GE Medical Systems) using an MR imaging–compatible isolette that fits inside the head coil. Three MR imaging series were acquired before the MR spectroscopic imaging was performed: T1-weighted sagittal and axial-view spin-echo images (500/11/1 [TR/TE/excitation]; section thickness, 4 mm; acquisition matrix, 192 × 256; acquisition time, 3.5 min × 2, for a total of 7 min) and T2-weighted spin-echo images (3000/60, 120/1; section thickness, 4 mm; section gap, 2 mm; acquisition matrix, 192 × 256; acquisition time, 6 minutes). The total imaging time was approximately 15 minutes.
MR Spectroscopy Protocol
The point-resolved spectroscopy (15–17) technique was used to excite a selected region with further localization by 3D chemical shift imaging (18, 19). Optimal uniformity of the selected region was obtained by using shaped RF excitation pulses, designed using the Shinnar-Le Roux algorithm (20), to excite a slightly larger region than prescribed and then using very selective saturation pulses (21, 22) to provide submillimeter transition bands for the selected volume. The very selective saturation pulses offer five- to 10-fold higher selectivity and 10-fold higher bandwidths than do conventional suppression pulses (21, 22). When used to define the edges of the selected box, they provide very sharp edges and negligible chemical shift misregistration effects. The point-resolved spectroscopy-very selective saturation selected region is extremely uniform with <5% variation. In this study, the point-resolved spectroscopy-very selective saturation selected volume included a region of approximately 60 to 200 cc, which encompassed the majority of the newborn brains while excluding the spatial inclusion of subcutaneous lipids. Phase encoding in the point-resolved spectroscopy-chemical shift imaging sequence was used to obtain 8 × 8 × 8, 12 × 12 × 8, or 16 × 8 × 8 3D spectral arrays with a nominal spatial resolution of 1 cm3. After a 2- to 3-minute prescan procedure, including autoshimming, the 3D MR spectroscopic imaging data were acquired in a 17- or 19-minute acquisition time with a TR of 1 and a TE of 144.
MR Spectroscopic Imaging Analysis
The MR images and raw MR spectroscopic imaging data were transferred off-line to a Sun UltraSparc workstation (Sun Microsystems, Mountain View, CA) for analysis using software developed at our institution for 3D MR spectroscopic imaging processing. Spectral processing included 4D Fourier transformations, automatic frequency and phase adjustments, baseline fitting, and peak integration. No k-space filtering was used. The analysis software also can perform arbitrary postprocessing realignments of the spatial center of the spectral arrays. This function was used to center the MR spectroscopic imaging data on the point-resolved spectroscopy selected regions and to position 1 cm3 spectral voxels in specific anatomic locations, as defined from the MR images, by using a custom-designed region-of-interest tool. The region-of-interest tool and MR spectroscopic imaging display tool were written in the Interactive Display Language (IDL; Research Systems Inc., Boulder, CO).
To assess the MR spectra in various anatomic locations in the brain, spectral voxels were retrospectively centered in the following regions bilaterally: basal ganglia, thalamus, optic radiations, corticospinal tracts, frontal white matter, calcarine gray matter, and parietal white matter. The locations are shown for a representative case in Figure 1. These seven voxel locations were chosen for several reasons: they include both more mature (deep gray matter) and less mature (frontal white matter) portions of the brain; they involve areas that are important in motor (corticospinal tracts, basal ganglia), visual (calcarine cortex, thalamus), and cognitive (frontal and parietal white matter) activities; and they include the regions commonly affected by neonatal brain injury (deep gray nuclei, frontal intervascular boundary zones).
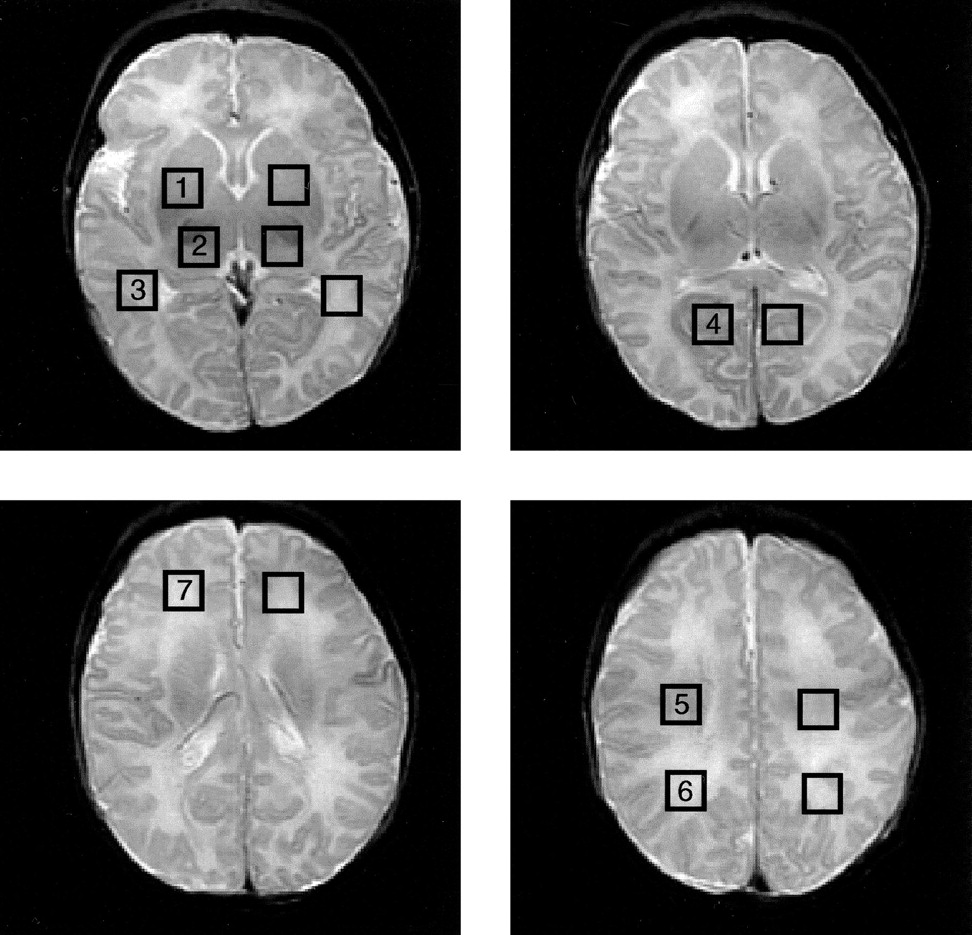
Square regions of interest, 1.0 cm2 in size, were centered bilaterally on basal ganglia (1), thalami (2), optic radiations (3), calcarine gray matter (4), corticospinal tracts (5), posterior white matter (6), and frontal white matter (7). MR spectroscopic imaging spectra were reconstructed to be centered on each location
The areas of the choline, creatine, and N-acetylaspartate resonances were calculated for each voxel, and ratios were calculated between different peaks in the same spectrum and between different regions for each resonance. Because F18 fluorodeoxyglucose positron emission tomography and iodine-123-labeled iodoamphetamine single-photon emission CT studies show that the thalami are the most mature regions of the supratentorial brain in neonates (23–25), the thalamus was chosen as the reference for spectral ratios between anatomic regions.
Statistical Analysis
Statistical analyses were performed using the statistical software package SAS 7.0 (SAS Institute, Cary, NC). Mean, SD, and data ranges were used to describe data. Mean differences between preterm and full-term babies in MR imaging measurements were compared for each anatomic location using a t test. Bonferroni P values were also used to adjust for multiple locations of each MR imaging measurement. Random-effects models were used to study the effect of maturity (premature versus full term) and anatomic location while controlling for the effect of multiple locations in the same participant. Participant effect was the random effect in this analysis. We examined the effects of maturity and anatomic location and their interactions. In cases of statistically insignificant interactions (P < .05), the interaction was removed from the final model. Pair-wise comparisons of anatomic locations were performed for random effects models by the least squared means, and the P values with Tukey-Kramer adjustment for multiple comparisons were used to evaluate these differences.
Results
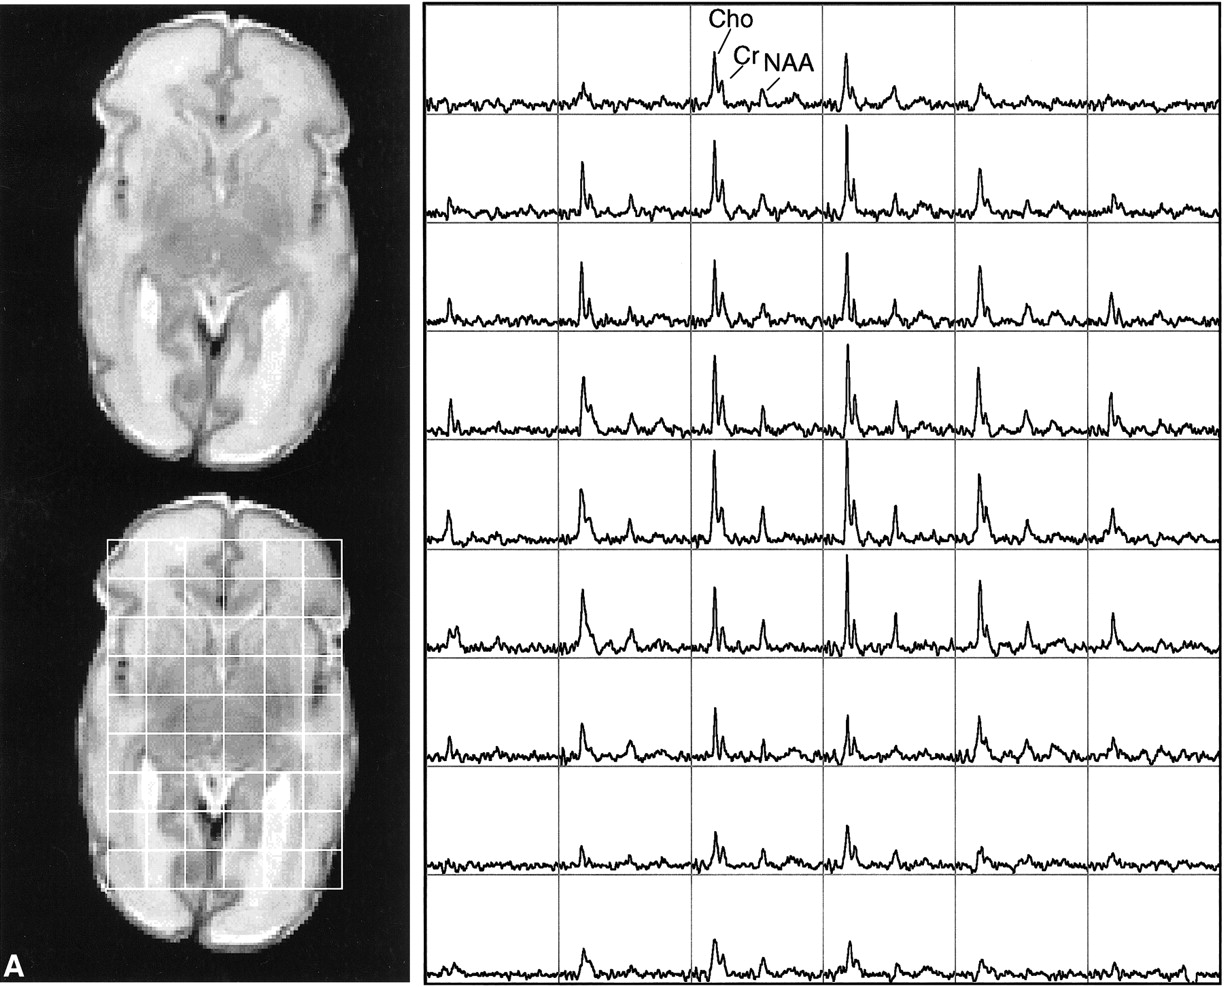
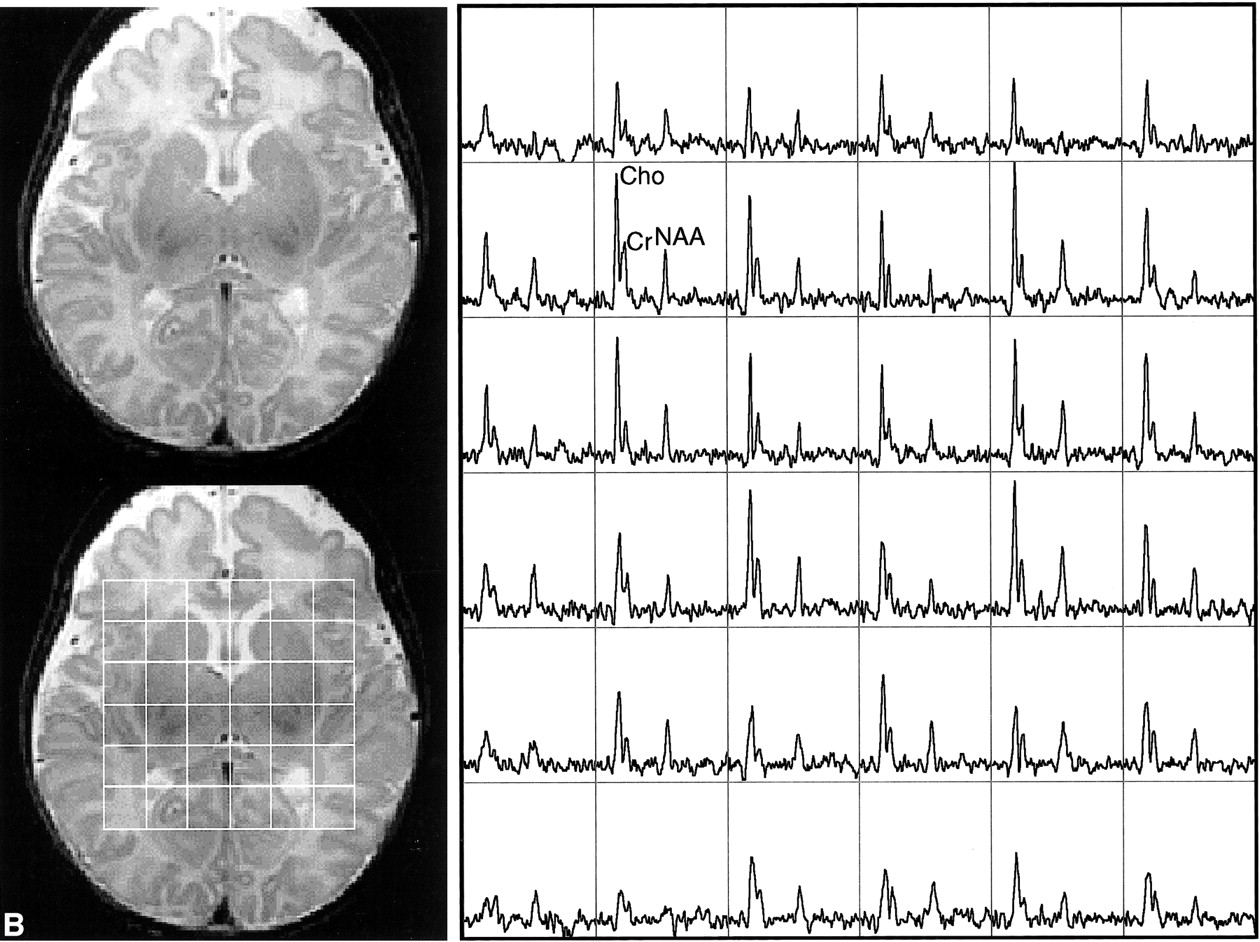
This study showed the feasibility of acquiring 3D MR spectroscopic imaging data from most of the neonatal brain at a 1 cm3 nominal spatial resolution. Diagnostic quality spectra were successfully obtained for all the infants studied. Including autoshimming and set-up time, the entire 3D MR spectroscopic imaging acquisition typically required 20 to 25 minutes. The number of spectral voxels obtained during each examination ranged from 68 to 130 cm3 in premature infants and 73 to 204 cm3 in term babies. Good quality spectra with a signal-to-noise ratio of ≤41 for the choline resonance were acquired from each baby; representative MR spectroscopic imaging data are shown for a premature and a term neonate in Figure 2. Note that these spectral arrays showed great spatial variation in choline, creatine, and N-acetylaspartate ratios; in addition, lactate/lipid intensities were low to insignificant in all babies studied.

Representative MR spectroscopic imaging data for a premature and a term neonate.
A, Images and spectral array from the brain of a premature, 30-week postconceptional age neonate with normal outcome.
B, Images and spectral array from the brain of a term, 41-week postconceptional age neonate with normal neurologic outcome.
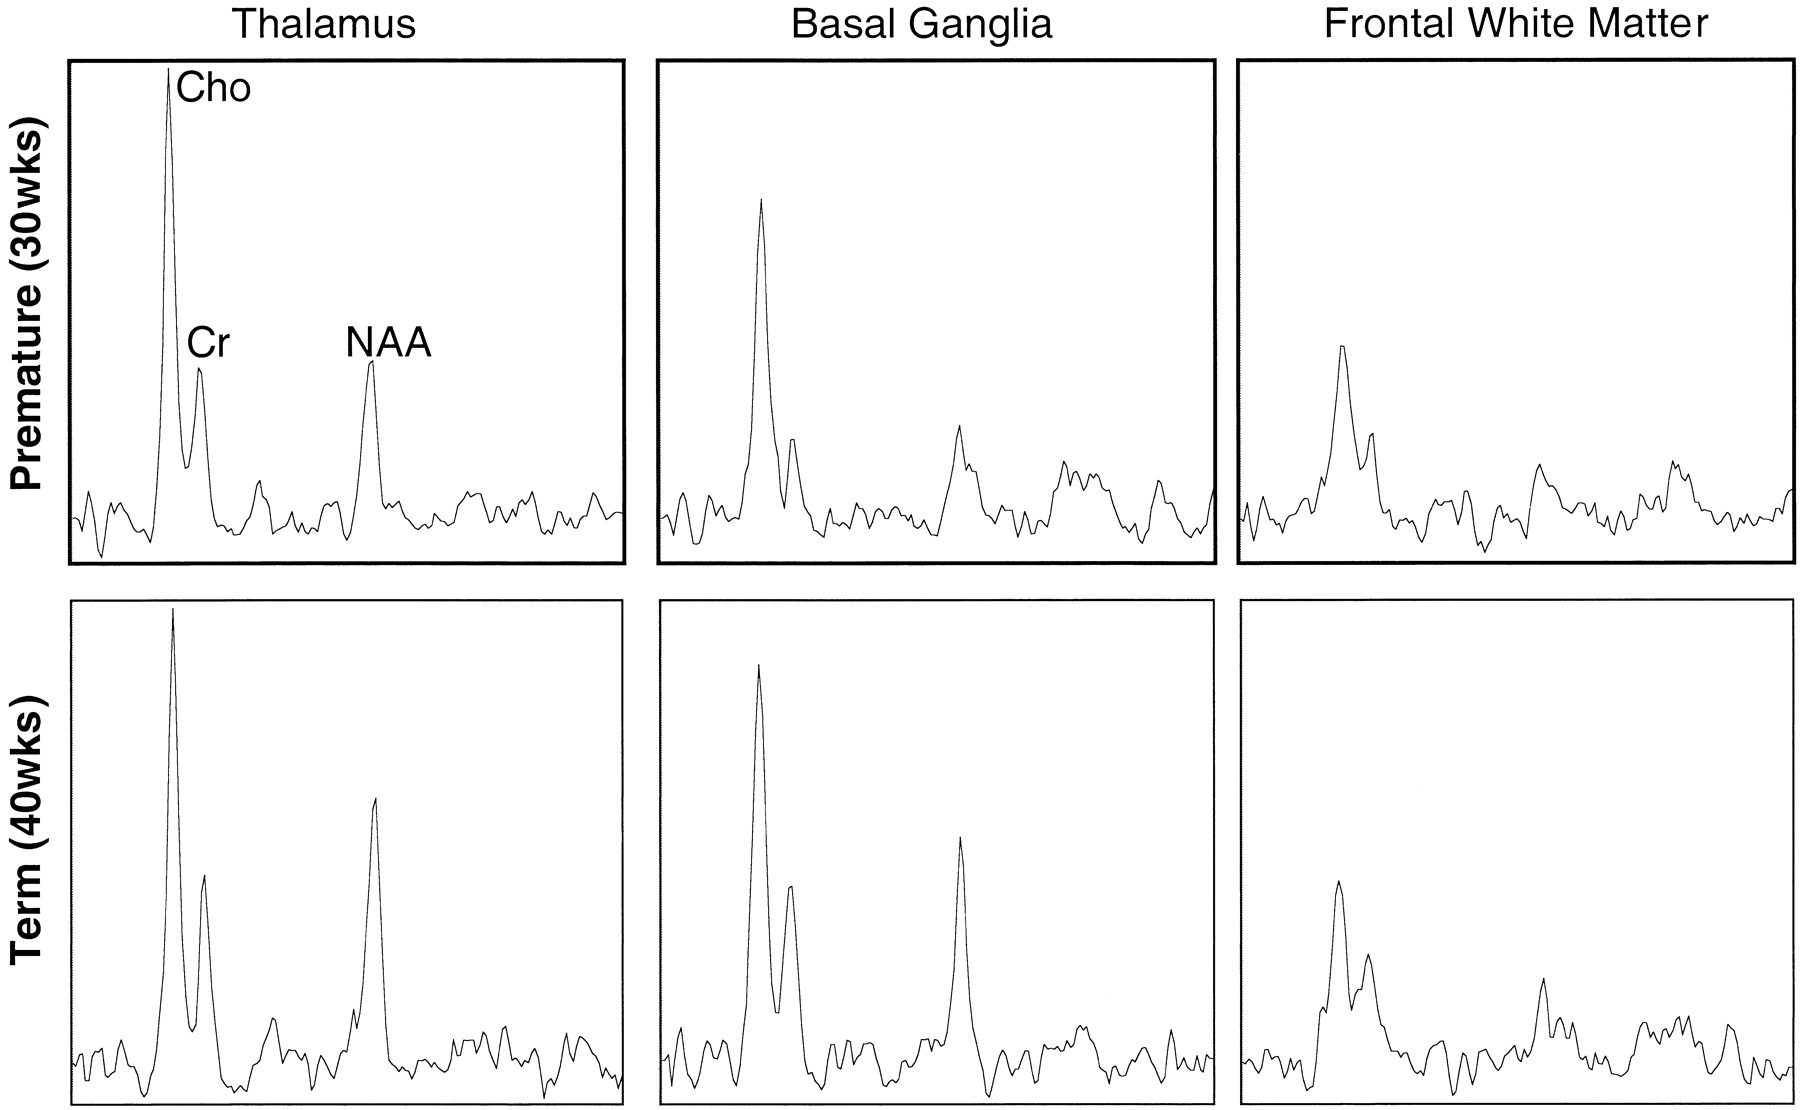
The relative peak intensities varied between anatomic regions with the highest choline, creatine, and N-acetylaspartate peak intensities occurring in the thalamus, which is the most mature area of the neonatal cerebrum. In Figure 3, selected spectra from the thalamus, basal ganglia, and frontal watershed white matter for a premature (postconceptional age, 30 weeks) and a term (postconceptional age, 40 weeks) infant are shown. These show lower levels of all metabolites and a decreased N-acetylaspartate:choline ratio in the basal ganglia as compared with the thalamus. The N-acetylaspartate:choline ratio is lowest in the frontal watershed white matter, suggesting that this is the least mature region. A difference was also detected when comparing the same locations at different postconceptional ages; metabolite levels and N-acetylaspartate:choline ratios in the basal ganglia and thalami were lower in the premature infant than in the term infant. However, in the immature frontal white matter, where metabolite levels were lowest, the spectra were very similar between premature and term infants.

Continued

Representative spectra from 1-cm3 voxels from three regions in the brain of a premature (postconceptional age, 30 weeks) and a term (postconceptional age, 40 weeks) neonate. Note higher relative N-acetylaspartate levels in the thalamus and especially the basal ganglia of the term infant. Note also a similar metabolite pattern in the frontal white matter, which is consistent with later maturation of this region
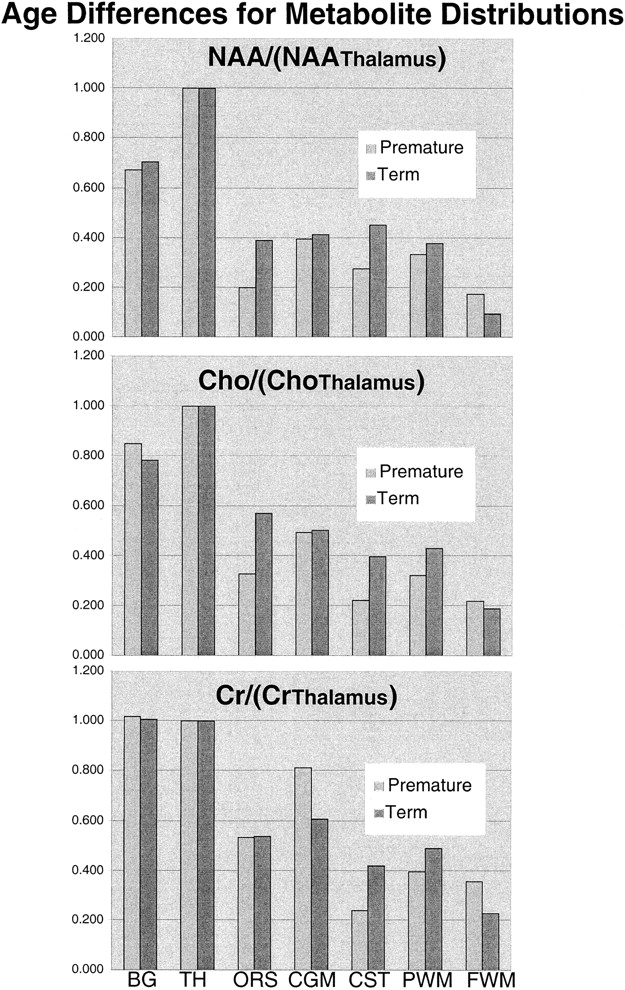
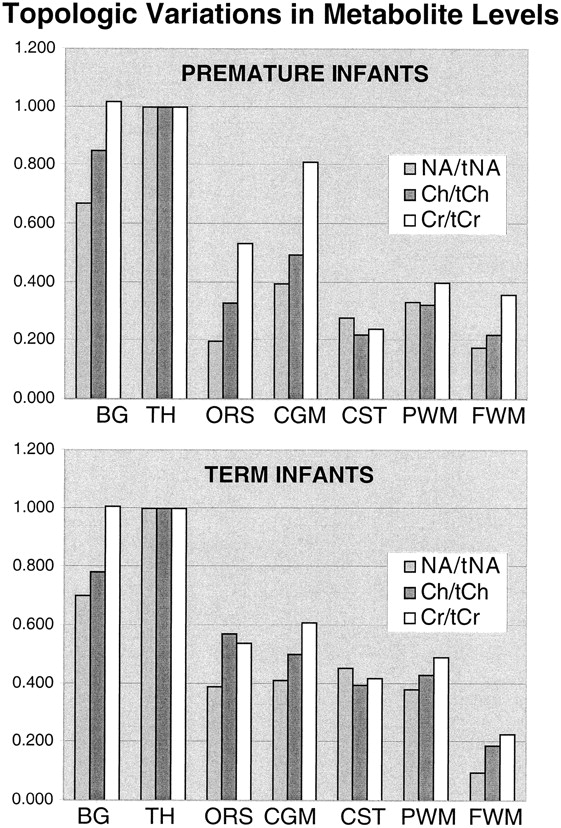
Table 1 and the graphs in Figure 4 show the mean topological variations in N-acetylaspartate, choline, and creatine intensities for both premature and term infants. Differences in the metabolite distributions and peak area ratios between the term and preterm infants (Figs 5 and 6) show that metabolites vary with both topology and brain maturation. Despite the small numbers of participants in this initial study, significant (P < .05) differences between the premature and term groups were observed for the N-acetylaspartate:choline and N-acetylaspartate:creatine ratios averaged over all regions. Regional variations in choline:creatine ratios also were found to differ between the premature and term infants, as shown by a significant (P < .006) difference in the interaction term. Several ratios from specific anatomic locations were also significantly different between the two age groups (noted by an asterisk in Table 1). These included N-acetylaspartate:choline and choline:creatine in the basal ganglia and thalamus. Also of note was the significant difference in relative N-acetylaspartate, choline, and creatine levels in the corticospinal tracts between the premature and term infants.
Measured metabolite ratios

Graphic representation of the topological variation of N-acetylaspartate (NA), choline (Ch), and creatine (Cr) peak areas relative to thalamus values. Higher levels of all metabolites were observed in the basal ganglia (BG) and thalamus (TH). N-acetylaspartate levels were higher in gray matter regions in both groups; however, relative to the calcarine gray matter (CGM), the difference decreased with age for the optic radiations (ORS), corticospinal tracts (CST), and parietal white matter (PWM), suggesting neuronal maturation in these regions. The minor relative changes in frontal watershed white matter (FWM) metabolite levels are consistent with late maturation
Graphic representation of the differences between premature and term N-acetylaspartate (top), choline (middle), and creatine (bottom) peak areas for each anatomic region relative to thalamus values
Significant differences in MR spectroscopic imaging data were also detected between anatomic regions within the premature and term groups (Tables 1–3). For the term infants, relative N-acetylaspartate and relative choline levels were significantly (P < .05) higher in the thalamus than in all other regions. Basal ganglia values were significantly lower than thalamus values but significantly higher than the values in the other regions studied. Relative creatine (creatine:total creatine) levels were not significantly different between the thalamus and basal ganglia but were between these two regions and all other regions. In the premature infants, similar significant differences were observed between the basal ganglia and other regions; however, there were more significant differences between different white matter regions than for the term infants (Tables 2 and 3). This suggests a greater variation of maturation for white matter tracts in the premature infant.
Premature neonates—MR spectroscopy imaging ratios significantly (P < .05) different between anatomic regions
Term neonates—MR spectroscopy imaging ratios significantly (P < .05) different between anatomic regions
Discussion
This study showed the feasibility of acquiring 3D MR spectroscopic imaging of the neonatal brain. The results of this study also indicate that both metabolite intensities and ratios of metabolite intensities in the neonate vary with both anatomic location and postconceptional age. These observations are consistent with the fact that different parts of the human brain undergo biochemical maturation at different rates (23–25). The results from this MR spectroscopic imaging study highlight the importance of considering the precise anatomic location and age of the participant when interpreting clinical MR spectroscopy data of neonates.
Relatively few MR spectroscopy studies of the newborn brain have been reported (1–12). Both phosphorus and proton MR spectroscopy techniques have been applied, with the majority of the more recent studies using proton MR spectroscopy because of its greater inherent sensitivity. These studies have shown the ability of MR spectroscopy to detect differences in cellular metabolite levels with developmental maturity, anatomic variation, and brain injury. The neonatal MR spectra were found to be strikingly different from those of adults, showing a significant correlation with age. Unlike in the adult brain, the N-acetylaspartate resonance is much smaller than the choline resonance in the neonatal brain. Also, the choline resonance in the neonate is twice as large as that found in the normal adult brain. The metabolite concentrations and ratios in babies change nonlinearly with age, and the changes occur most rapidly in premature newborns (1–3). The previous MR spectroscopy studies of the developing brain were acquired from specific regions (e.g., occipital cortex, parieto-occipital white matter, and thalamus), with voxel sizes of typically 8 cm3 (2). Although some studies were acquired with a dual spin-echo acquisition (3, 5), others used stimulated echo acquisitions (1, 2). By acquiring water-unsuppressed spectra and measuring the relaxation times for each resonance, some of the studies measured the absolute quantitation of each metabolite relative to water. This is a distinct advantage of single-voxel acquisitions over the 3D MR spectroscopic imaging, with which the measurement of unsuppressed water and relaxation times for each voxel would require prohibitively long examination times of multiple hours. For comparable regions such as the thalamus, the metabolite ratios observed in published single-voxel studies (5) using the similar point-resolved spectroscopy excitation technique were within 1 SD of the values found in this study.
Although the previous single-voxel MR spectroscopy studies clearly showed significant metabolic changes with maturation, the normative data that they provide is of limited use for clinical assessments of neonates. The reasons for this are limited coverage and that the coarse spatial resolution of previous studies resulted in the averaging of spectral intensities from tissues in contiguous but different anatomic locations. Therefore, the thalami, basal ganglia, and adjacent white matter are all averaged together. Subtle changes involving only the thalamic nuclei might be missed because of averaging with unaffected adjacent tissue. Accurate localization of a voxel to a specific anatomic location without spectral contamination from adjacent tissues is especially difficult in the premature brain because of its very small size. A single-voxel 5- to 8-cm3 MR spectroscopy study of the premature brain averages signals from a large portion of the brain, limiting the study to one or two regions of interest, both of which include multiple anatomic structures. The 1-cc spatial resolution of our 3D MR spectroscopic imaging data is fivefold smaller than the previous singe voxel studies, markedly diminishing the averaging of adjacent structures. With this higher spatial resolution, normative data were acquired for the maturation of specific regions within relatively small structures, such as the basal ganglia and thalami, which are areas that can be selectively affected by neonatal hypoxic-ischemic injury. The ability to better localize the biochemical changes will allow more accurate assessment of brain maturation. More importantly, it may allow more sensitive identification of small areas of abnormality. This increased sensitivity may allow earlier diagnosis of diseases that cause shifts in the levels of metabolites. We have already had anecdotal experience in detecting localized elevations of lactate in the white matter of premature neonates who went on to develop periventricular leukomalacia of prematurity (unpublished results).
In addition to providing multiple individual spectra throughout the volume of interest, 3D MR spectroscopic imaging has the advantage that the experimental conditions stipulate only the size of individual voxels. The spatial position of the spectra can be selected retrospectively via “voxel shifting,” using the appropriate mathematical weighting of the raw data on the basis of the translation property of the Fourier transform (26, 27). In addition to removing the guesswork from the location of abnormal metabolite levels, this feature allows retrospective alignment of the spectra with specific anatomic locations. Although single-voxel MR spectroscopy studies have shown significant anatomic differences at an 8-cc spatial resolution (2), a more complete assessment of the distribution of metabolite levels in the developing brain is provided by 3D MR spectroscopic imaging. The 3D MR spectroscopic imaging technique used in this study also allows the acquisition of large arrays of spectral data that can be analyzed in a number of different ways, as illustrated in Figures 4 through 6. Relative metabolite levels can be measured between different resonances and for the same resonance between regions. Topological variation of different metabolites within age groups can be assessed (Fig 4). Also, metabolite differences in specific topological locations can be compared between age groups (Fig 5). The plotting of ratios (Fig 6) provides comparisons of metabolite variations with respect to one another. Information such as this will be invaluable both in assessing normal biochemical development of the brain and in detecting, localizing, and potentially specifying disorders of the brain that affect metabolite concentrations.
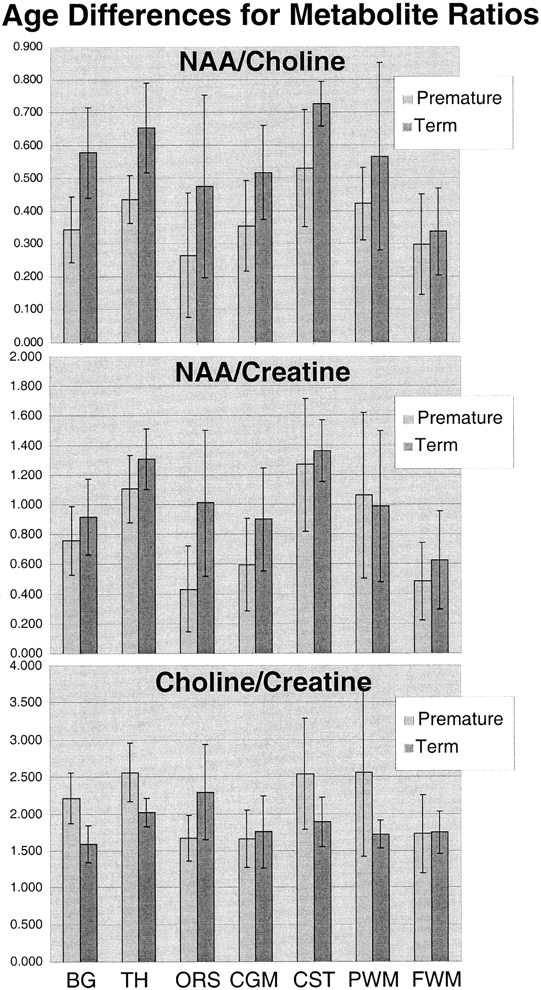
Graphic representation of the differences between premature and term N-acetylaspartate:choline (top), N-acetylaspartate:creatine (middle), and choline:creatine (bottom) peak area ratios for each anatomic region
This study supports the important concept that metabolite concentrations vary with both age and location in the developing brain and that 3D MR spectroscopic imaging can play in important role in assessing these changes. In both the preterm and term groups, significant differences were noted between anatomic regions; the highest levels of choline, creatine, and N-acetylaspartate were in the thalamus, followed by the basal ganglia and then the other regions (Tables 1–3). Significant differences also were detected between the premature and term groups for MR spectroscopic imaging data averaged over all locations and for specific anatomic locations (Table 1). These results are in agreement with the previous single-voxel MR spectroscopy studies of brain maturation (1–3) but include greater anatomic coverage and much higher spatial resolution.
The SD of the N-acetylaspartate:choline, N-acetylaspartate:creatine, and choline:creatine ratios (Fig 6) showed topological and age-dependent variations and were highest in the white matter regions of the premature infants. This may be artifactual because of the small sample size and lower signal-to-noise ratio in these locations but may also represent greater individual variation in maturation in these specific white matter fascicles. Further studies with much larger numbers at each age are required to address this question and to better define the normative metabolite distributions at each topological location and for each week of brain maturation. This study indicates that the creation of such a normative database is critical to allow the reliable determination of metabolic abnormalities by MR spectroscopic imaging in clinical assessments of the neonatal brain.
Conclusion
We have applied 3D MR spectroscopic imaging techniques to study the anatomic distributions of choline, creatine, and N-acetylaspartate in a small group of premature and term infants. Reproducible, good-quality spectra were obtained in a clinical setting by using a clinical MR imager and a reasonable imaging time. The spectra that were obtained indicate that the biochemical maturation of the brain varies both temporally and topologically. An understanding and mapping of the variations associated with brain maturation are critical for the use of MR spectroscopic imaging as a tool to diagnose disease in the neonatal brain and to study normal brain development.
Footnotes
1 This work was supported by National Institutes of Health grants PO1 NS35902 and R01 NS40117.
↵2 Address reprint requests to Daniel B. Vigneron, Magnetic Resonance Science Center, Department of Radiology, Box 1290, University of California, San Francisco, CA 94143.
References
- Received October 5, 2000.
- Accepted after revision March 17, 2001.
- Copyright © American Society of Neuroradiology
In this issue


Jump to section
Related Articles
Cited By...
- Magnetic resonance spectroscopy in preterm infants: association with neurodevelopmental outcomes
- Comparison of Spin-Echo T1- and T2-Weighted and Gradient-Echo T1-Weighted Images at 3T in Evaluating Very Preterm Neonates at Term-Equivalent Age
- Magnetic Resonance Imaging in Congenital Heart Disease: What to Do With What We See and Don't See?
- Temporal and Anatomic Risk Profile of Brain Injury With Neonatal Repair of Congenital Heart Defects
- Practice parameter: Neuroimaging of the neonate: Report of the Quality Standards Subcommittee of the American Academy of Neurology and the Practice Committee of the Child Neurology Society