
Abstract
BACKGROUND AND PURPOSE: A technique of segmenting total gray matter (GM) and total white matter (WM) in human brain is now available. We investigated the effects of age and sex on total fractional GM (%GM) and total fractional WM (%WM) volumes by using volumetric MR imaging in healthy adults.
METHODS: Fifty-four healthy volunteers (22 men, 32 women) aged 20–86 years underwent dual-echo fast spin-echo MR imaging. Total GM, total WM, and intracranial space volumes were segmented by using MR image-based computerized semiautomated software. Volumes were normalized as a percentage of intracranial volume (%GM and %WM) to adjust for variations in head size. Age and sex effects were then assessed.
RESULTS: Both %GM and %WM in the intracranial space were significantly less in older subjects (≥50 years) than in younger subjects (<50 years) (P < .0001 and P = .02, respectively). Consistently, %GM decreased linearly with age, beginning in the youngest subjects. %WM decreased in a quadratic fashion, with a greater rate beginning only in adult midlife. Although larger GM volumes were observed in men before adjustments for cranium size, no significant differences in %GM or %WM were observed between the sexes.
CONCLUSION: GM volume loss appears to be a constant, linear function of age throughout adult life, whereas WM volume loss seems to be delayed until middle adult life. Both appear to be independent of sex. Quantitative analysis of %GM and %WM volumes can improve our understanding of brain atrophy due to normal aging; this knowledge may be valuable in distinguishing atrophy of disease patterns from characteristics of the normal aging process.
The quantitative assessment of brain atrophy is becoming an important consideration in monitoring the clinical outcome and treatment effects in many diseases, such as Alzheimer disease, multiple sclerosis, schizophrenia, alcoholism, and AIDS-related dementia. The reason is because recent considerable advances in MR imaging and computer technology have allowed the study of brain morphometrics in vivo, which could provide an accurate, reproducible, and quantitative measure for assessing brain atrophy. Age-associated changes in brain tissue measurements in healthy adults have also been the subject of great interest in recent years, because the determination of normal age-specific values in brain have a role in the evaluation of both clinical-pathologic conditions and normal aging processes. Many investigators examine the age effects on the basis of specific brain regions, such as the corpus callosum (1), hippocampus (2), frontal and temporal lobes (3, 4), and cerebellum (5). The quantitative information from the analyses has shown that age-related brain tissue loss may vary greatly among different brain regions (6) and between the hemispheres (7). These volume measurements in brain tissue appear to vary with sex as well (8, 9); this observation indicates that the use of fractional measures to correct for population- and sex-related differences in head size is essential.
However, because brain parenchyma is generally composed of gray matter (GM) and white matter (WM), the quantitative analysis of brain atrophy underlying separate GM and WM may have implications for our understanding and monitoring of the aging process in the brain. Previous groups have examined age-related changes in GM and WM volume by using either a regional analysis of a specific brain lobe or by using a few sections of the brain. Several methods have been used with variable results (10–18). The brain must be assessed as a whole to provide a reliable indication of how total GM and WM volumes change with age on the basis of a normalized and standard measure. Furthermore, because aging seems likely to affect the entire brain during the aging process (6), global volume measures represent the cumulative effect of all physiologic changes that occur in the entire brain. Compared with other measures, these may be more accurate and important to correlate with the clinical outcome. GM and WM differ both anatomically and functionally, and they have different patterns in brain development (19); thus, findings in GM and WM are not necessarily coincident with each other in terms of the timing and extent of tissue loss in brain aging. The purpose of this study was to investigate our hypothesis that GM and WM volumes have different patterns of change that may contribute in different ways to brain atrophy in the normal aging process. To our knowledge, information specifically related to when and how the normalized brain tissue volumes change during aging, which is critical to our understanding of general brain atrophy in elderly people, has not been well addressed (20).
This present study was designed to investigate the effects of age and sex by using fractional measures of total GM and WM volume based on a thin-section (3-mm) standard MR imaging protocol performed in adults with no evidence of neurologic disease.
Methods
Subjects
Fifty-four healthy volunteers (32 women, 22 men; age range, 20–86 years; mean age, 46.8 years ± 19.3) were examined by using our imaging protocols. The mean age of the female subjects (48.3 years ± 19.1) was not significantly different (P = .82) from the mean age of the male subjects (44.7 years ± 19.9). An experienced neurologist (D.L.K.) examined the subjects by using a structured clinical interview to exclude any present or past neuropsychiatric illnesses and abuse of alcohol or illicit drugs. Additionally, a negative history of psychiatric disease in first-degree relatives was required. Physical examination showed normal findings in all participants, and no patient reported a history of any serious medical condition. The numbers of subjects in each decade were as follows: 13 in the 20–29-year-old group, 10 in the 30–39-year-old group, nine in the 40–49-year-old group, six in the 50–59-year-old group, seven in the 60–69-year-old group, five in the 70–79-year-old group, and four in the 80–89-year-old group. Informed consent was obtained from all volunteers, and the local ethics committee approved the protocol.
MR Imaging
All subjects underwent imaging with a 1.5-T MR unit (Signa; GE Medical Systems, Milwaukee, WI) with a quadrature transmit-receive head coil. Whole-brain axial dual-echo fast spin-echo (FSE) images were acquired with a TR/TE1 and TE2/NEX of 2500/18 and 90/1, a 3-mm section thickness, a 22-cm field of view, and a 192 × 256 matrix. The echo train length was eight, and the pixel size was 0.86 mm. More than 50 sections were obtained in each subject to cover the whole brain. To minimize variations in the volume calculations in the whole-brain parenchyma among subjects, we included only certain sections from the MR image sets: those starting from the section just before the image that showed the cerebellum at the bottom and ending with the last section that showed brain at the top.
Image Processing and Analysis
The first (proton density-weighted) and second (T2-weighted) echoes of the FSE sequence in each study were transferred directly to a Sparc workstation (Sun Microsystems, Mountain View, CA) via the picture archiving and communications system in our department. GM, WM, and CSF were segmented with the 3DVIEWNIX software system (21) by analyzing both proton density- and T2-weighted images. The process began with segmentation of the intracranial brain (GM, WM, and CSF) by using the theory of fuzzy connectedness (22). All segmented brain volume images (more than 50 sections in each subject’s brain) were individually reviewed, and an experienced neuroradiologist (Y.G.) excluded any residual extracranial components, if needed. GM, WM, and CSF were each identified as individual three-dimensional fuzzy connected objects (Fig 1) according to their “affinity,” “fuzzy adjacency,” and “hanging togetherness” (22). This technique created a volume image by using thin-section dual-echo proton density- and T2-weighted images for GM, WM, and CSF from all sections that covered the whole brain. In repeated studies, the coefficient of variation was shown to be 2.1% for the GM volume, 1.9% for the WM volume, and 1.5% for the CSF volume (23). To normalize for head size variability, the %GM volume and %WM volume were computed as the percentage of the intracranial volume; that is, %GM = (GM/intracranial volume) × 100%.

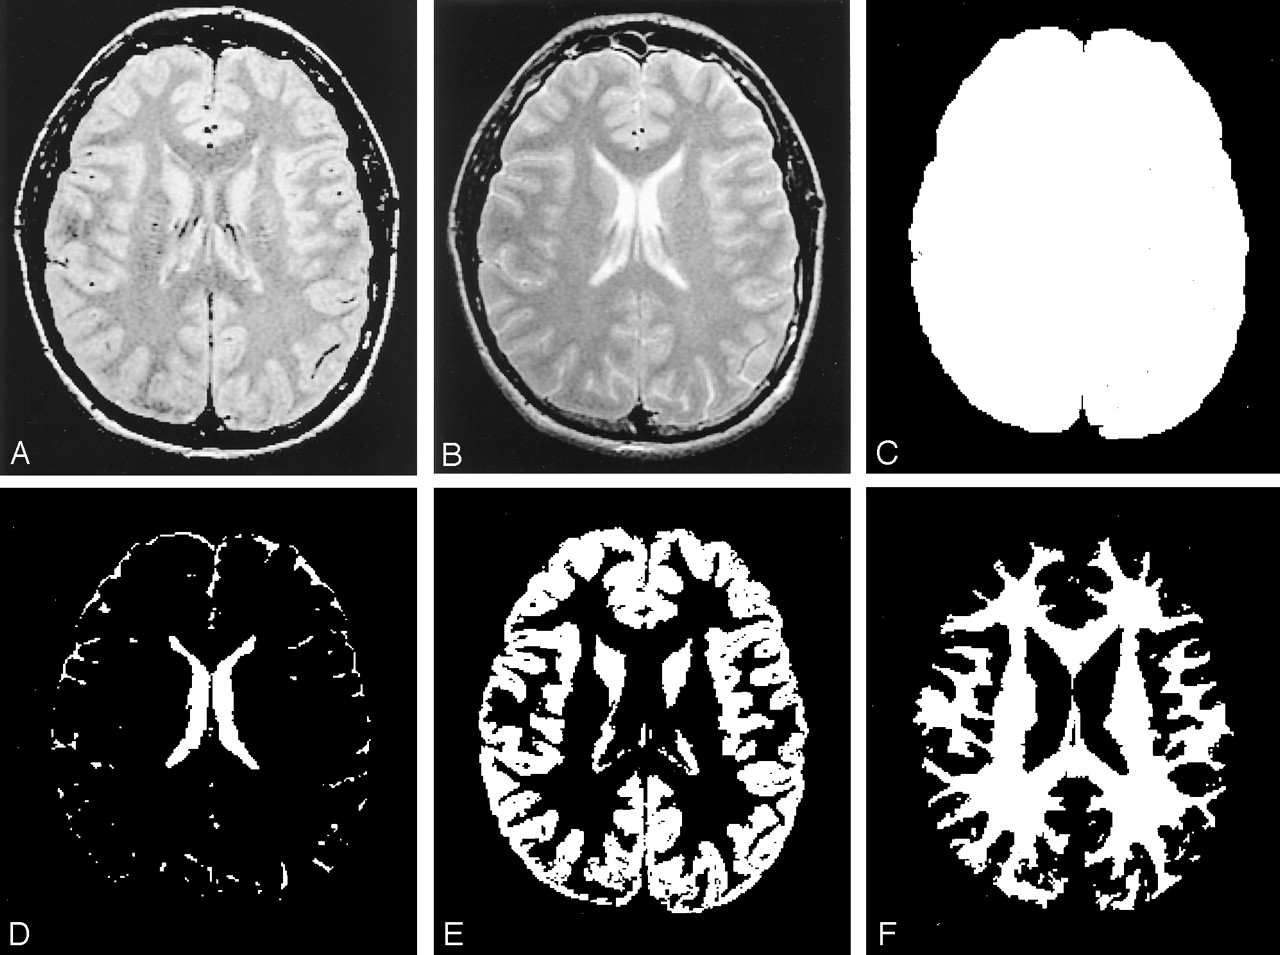
Segmented images from one section based on various MR images. The normalized volume measure is tissue volume (E or F) relative to the total intracranial volume (C).
A, Original dual-echo FSE proton density-weighted image.
B, T2-weighted MR image.
C, Total intracranial volume image.
D, CSF volume image.
E, GM volume image.
F, WM volume image.
Statistical Methods
Descriptive statistics, including the mean and standard deviations of the MR imaging volumetric measures, were calculated and compared in different age and sex groups. Age- and sex-related effects were evaluated with t tests by using a Satterthwaite correction for unequal variances. Relationships between age and %GM, as well as age and %WM, were assessed with Pearson product-moment correlations. To determine whether the rate of change in each variable was the same at all ages, least-squares regression was implemented to assess the utility of a prediction model that was a quadratic function of age. If the quadratic term is significant, the rate of change first accelerates and then decelerates over time, or vice versa.
Results
Effects of Age on MR Imaging Volumes
To assess the effects of normal aging on MR imaging volume data, we assigned subjects into two age groups: 20–49 years (n = 32; mean, 33.0 years ± 8.9) and 50–86 years (n = 22; mean, 67.0 years ± 10.4). The mean, median, and standard deviation for volume measures in each age group are shown in Table 1. No significant difference was observed in the total intracranial volumes of these two age groups; this finding indicated that they were comparable with respect to head size. We noted a 91.7-mL, or 4.9%, difference in absolute GM and %GM between the older group and the younger group (P ≤ .001), as well as a 54.6 mL, or 2.6%, difference in absolute WM and %WM between the two groups (P ≤ .02). No significant difference in the GM/WM ratio was found between the older and younger subject groups.
Comparisons of MR imaging volume data in different age groups
The Pearson product-moment correlation was used to identify age-predictive effects on MR imaging volume measurements, as shown in Table 2. Regardless of sex, the %GM was significantly associated with age (r = −0.57, P < .0001), as was %WM (r = −0.35, P = .009), although the correlation between age and %WM was not as strong as that between age and %GM.
Pearson product-moment correlations between age and MR imaging volume data
Least-squares regression was implemented to assess the utility of a model in predicting %WM and %GM as quadratic functions of age. The pattern of changes differed for the two tissues (Fig 2A and B). Specifically, %GM displayed a decline beginning with the youngest subjects, and this change was constant and linear across the span of early to late adulthood. We found that the rate of decline in %GM was not significantly different (P = .45) among younger subjects (20–49 years) compared with older subjects (aged 50 years and older). However, %WM demonstrated a quadratic pattern of change, increasing slightly in subjects until the age of approximately 40 years, and it decreased thereafter. The rate of change in %WM was significantly different in subjects younger than 50 years compared with those aged 50 years or older (P = .038). Once %WM began to decline, its rate of decrease was faster (−0.2%) than that of %GM (−0.09%). The rate of change was not significantly different for either total intracranial volume or the GM/WM ratio (Fig 2C) between the two age groups.
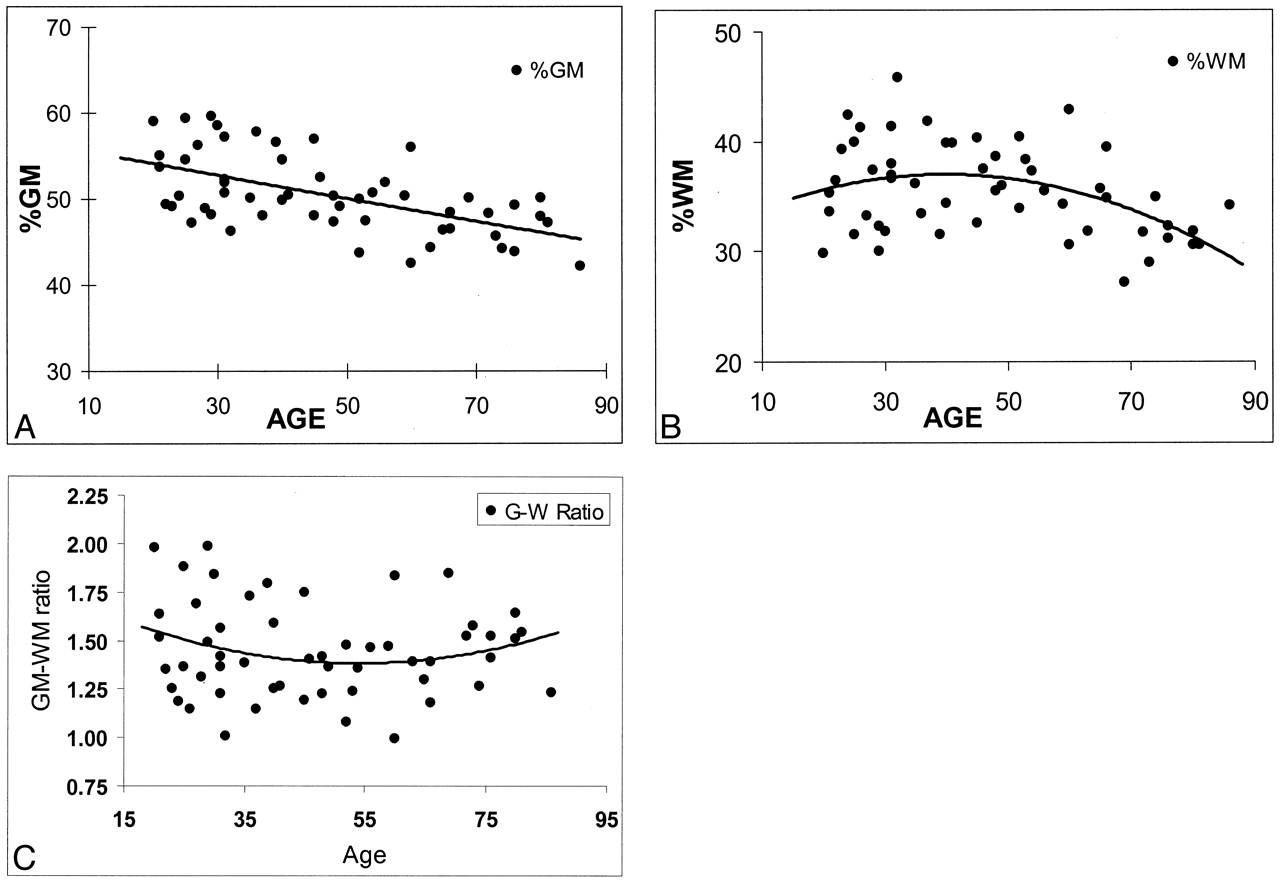
Regression analysis of fractional brain tissue volume estimates on age in 54 healthy adult subjects. Linear and weighted constrained quadratic models are presented; these indicate the age-related volume estimates throughout adulthood in normal brains.
A, %GM.
B, %WM.
C, GM/WM ratio.
Effects of Sex on MR Imaging Volumes
Sex-related differences in MR imaging volume measurements are shown in Table 3. Significant differences were observed in total absolute intracranial volume and absolute GM volume (P ≤ .003) between female subjects (1291.5 mL ± 134.9 and 645.9 mL ± 89.6, respectively) and male subjects (1425.1 mL ± 138.3 and 730.6 mL ± 99.3, respectively); differences in absolute WM volume were not significant. However, no significant difference was noted in either %GM or %WM between female and male subjects after the values were normalized for head size, although a trend toward slightly higher %WM in female subjects (P = .085) was present. To determine whether the sexes differed in terms of the rate of change in %GM and %WM with age, results of a separate analysis of variance was plotted (Fig 3). Although %GM decreased with age slightly faster in male subjects than in female subjects, the difference in the rate of change was not statistically significant for either %GM or %WM.
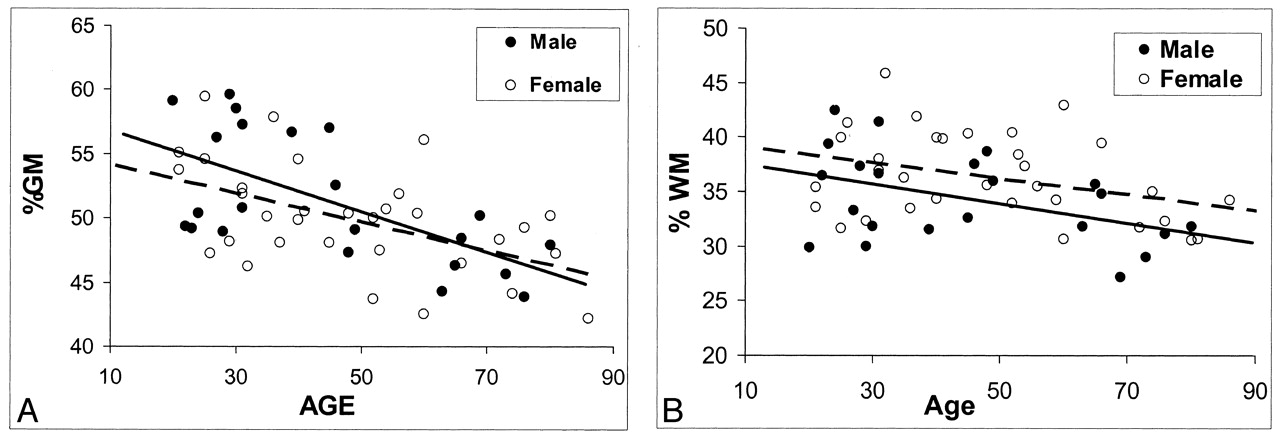
Regression analysis of fractional volume estimates on age in the brain tissues of healthy male and female subjects. Despite the lack of statistical power, some trends seem to be present.
A, Faster decrease in %GM in male subjects with aging (solid predicted line).
B, Generally higher %WM volume in female subjects (dotted predicted line).
Comparisons of MR imaging volume data in female and male adults
Discussion
In this study, we measured both absolute and fractional %GM and %WM volumes in healthy adults aged 20–86 years and evaluated the data by age and sex. The results showed the patterns of age-associated change in GM and WM volumes at a global level. The decline in %GM appears to occur by a relatively young age (age 20 years in our study), and the decrease is constant and linear. The %WM, in contrast, shows a quadratic pattern of change, slightly increasing until an age of approximately 40 years, then decreasing quickly thereafter. These combined changes might explain why cerebral volume remains relatively stable up to the age of 40–50 years (24), when brain atrophy starts, although GM loss occurs much earlier. The effects of sex were not significant in terms of %GM and %WM, although female subjects tended to have slightly higher %WMs, compared with male subjects. The rates of change in %GM and %WM were not statistically different between male and female subjects.
In the present study, we observed no difference in the total intracranial volume between the younger and older groups. This finding indicates that age-dependent changes in cranium size do not occur in healthy adults and that a comparison of the absolute (and fractional) segmented volumes in each tissue subtype in the two age groups is reasonable. In contrast, we found a significant difference in cranial sizes and GM volumes between the male subjects and female subjects at every age. Apparently, absolute volumes should not be used; instead, fractional controlling volume measures should be used to assess the effects of sex. The difference between male subjects and female subjects was not statistically significant after we controlled for head size by using the %GM.
We found a 4.9% difference in %GM between the younger group and the older groups; this observation indicated that a significant age-related GM loss occurs with advancing age. Our finding of a linear decline in %GM (Fig 2A) that started from the youngest subject age (age 20 years) indicates that the GM degeneration process could begin in the early stage of adult life. This idea was also proved in another study by Pfefferbaum et al (24), which was based on seven sections of the brain. Similarly, a recent study by Courchesne et al (20), which involved volumetric MR imaging, revealed that the absolute GM volume increased from early childhood (19–33 months) to later childhood (6–9 years) and decreased thereafter. They limited their study to an analysis of the absolute tissue volumes rather than the controlled measures for head size. Furthermore, they focused on brain development and offered few data on the normal aging process. However, the phenomenon of an early decline in GM volume in the healthy aging process is still not well known; this decline may be due to the neuronal and synaptic pruning in the human cortex reorganization period (25) after the neural maturation (ie, neurulation, proliferation, migration). This early regression event may be a normal process that may not reflect degeneration, but rather, the elimination of redundant neurons and synaptic connections in early adult life. Our study demonstrated that this decrease in GM volume is linear (as reflected by a global normalized measure) throughout adult life, with no difference in the rates of GM decline. This result is consistent with that of a longitudinal study (26) in which certain regions of brain GM were measured. However, findings from postmortem studies in middle and late adult life (27–29) have suggested that the GM loss (shrinkage) might be correlated with a decrease in the size of large neurons rather than a notable decrease in the number of neurons.
Although age-related brain tissue loss has often been described as GM loss or cortical atrophy (30), WM loss was also found in normal aging (13, 14). We found that the %WM volume change that occurred with advancing age in adults was not linear but quadratic. It showed a slight increase between the ages of 20 and 40 years, and then it decreased until later life (Fig 2B). This finding agrees with the results from other volumetric studies (20, 24, 31) that suggested the WM maturation may continue into the midlife after a large increase from early childhood to adolescence. However, the measures of WM volume in those studies were based on regional or non-normalized analyses. The incidence of similar findings with the uses of different methods suggests that, relative to the early decrease in GM, WM volume loss occurs relatively late in adulthood in healthy individuals. Compared with these other studies (20, 24, 31), our study was more focused on adult brains and involved a normalized global measure that was designed to quantify the total tissue loss and avoid the difficulty in regional brain segmentation. However, because of this pattern of change in WM in the present study, the rates of change in %WM (Fig 2B) were significantly different between young subjects (who had a slow increase) and older subjects (who had a fast decrease).
Once the %WM decreases in late life, the rate of decrease seemed to be consistent and fast in comparison with that of %GM. This finding was also suggested in other studies (13, 15, 24) in which age-related atrophy was greater in WM than in GM, although the time when this volume loss started was not investigated. All of these results imply that both GM and WM volume changes contribute to brain atrophy. WM loss occurs later in life and may be more apparent, whereas GM loss is constant and starts from late childhood. Although the biologic mechanism of brain maturation in WM expansion to midlife is not fully understood, it is likely associated with continued myelination and axonal growth (25). However, in the elderly, the periventricular hyperintensities in WM have been shown to be unrelated to the total WM volume loss (32). Additional data from diffusion-weighted and magnetization transfer (MT) imaging studies (33, 34) reveal that fractional anisotropy and the MT ratio (measures of the integrity of the microstructure) in WM significantly decrease with age. This decrease suggests that WM volume loss may result from these microscopic structural changes, which include myelin and axonal destruction (17, 35, 36), dilatation of perivascular spaces (37, 38), and gliosis (39, 40).
Regarding sex-related differences, despite no difference in the rate of %WM change across ages in male subjects and female subjects, female subjects generally had a higher %WM at every age (Fig 3B); however, this tendency was not statistically significant (P = .085). Further, a consensus exists regarding a significant sex-related difference in intracranial space and GM volume (8, 41), as determined with absolute size measurements. No sex difference in %GM was observed once GM volume was adjusted for head size. This observation indicates that differences in brain sizes between men and women are primarily attributable to the differences of total GM volume. We also observed a trend toward greater %GM loss in male subjects (Fig 3A) although the difference was not statistically significant, and it was not as large as that of other groups, which showed that the loss of brain tissue in men was greater than that of women (9, 42–45). However, our results were based on the total intracranial %GM and %WM volumes, which may have diluted the sex effects, whereas others’ results were based on absolute values in the whole brain or subregional areas of different lobes.
In our study, the GM/WM ratio changed only slightly within the age range of 20–86 years. No significant effects of either age or sex on the GM/WM ratio were found. This ratio shows that at no period was the volume of WM greater than that of GM. As shown in Figure 2C, the ratio of GM to WM slowly decreased until the age of approximately 50 years and increased slightly thereafter. In the present study, given the combined changes in GM and WM with age, one could expect that no substantial, detectable brain atrophy occurs until midlife, although a constant change occurs in both brain tissues during the adult life span. However, the time when these changes in GM and WM become clinically apparent, and the mechanisms by which they occur in late life are still not entirely resolved. If the GM loss starts earlier and the WM loss starts late but with a faster rate in normal aging (as we found in this study), the cognitive decline in abnormal aging (ie, Alzheimer disease) is probably not exclusively due to GM loss or cortical atrophy. WM loss attributable to axonal loss could also be involved (46). Furthermore, the findings of this volumetric study of GM and WM suggest that the normal aging process may start with WM loss, which begins at midlife and becomes more profound in later life, as compared with the GM loss.
Several limitations should be noted in the present study. First, this was a cross-sectional study without a direct comparison within subjects. Ideally, a longitudinal study over several decades should be performed. Second, we excluded subjects with past or present neurologic symptoms but not subjects with some periventricular WM hyperintensities on MR images, a feature common in older adults (47). Thus, this approach may have made the comparison of images in younger subjects and those in older subjects more difficult. However, Guttmann et al (13) demonstrated that no correlation existed between high-signal-intensity foci in WM on MR images and brain volume in healthy adults. Further, these hyperintense spots in the periventricular regions do not distinguish patients with Alzheimer disease from healthy elderly adults; thus, these spots are more likely to be associated with the normal aging process rather than with notable diseased patterns (48). Third, although a quantitative estimation of brain tissue loss in aging can be performed in healthy, living subjects to avoid the fixation artifacts of postmortem study, the accuracy of computer-generated segmentation of young and older brains may not be the same. This issue needs to be further evaluated.
Conclusion
This quantitative volumetric study demonstrated possible normal patterns of global GM and WM volume across adult life, from 20–86 years, in healthy individuals. The volume changes in %GM and %WM indicate that GM loss occurs in a linear pattern starting from early adult age, whereas WM change occurs in a quadratic pattern, with a volume increase in early adulthood and with an accelerated rate of decrease beginning in middle adulthood. These changes illustrate both processes of brain maturation and aging that represent different zones of the continuum during the adult life, and they may be taken as benchmarks in assessing pathologic conditions when they reach a critical threshold of impaired function in each decade. Differences in the brain sizes between male and female subjects may be primarily attributable to the differences of total volume of GM.
Footnotes
Supported in part by grant NS29029 from the National Institutes of Health.
References
- Received October 2, 2001.
- Accepted after revision April 18, 2002.
- Copyright © American Society of Neuroradiology
In this issue


Jump to section
Related Articles
Cited By...
- Meditation Experience is Associated with Increased Structural Integrity of the Pineal Gland and greater total Grey Matter maintenance
- Network Occlusion Sensitivity Analysis Identifies Regional Contributions to Brain Age Prediction
- Resilience and resistance to Alzheimers disease-associated neuropathological substrates in centenarians: an age-continuous perspective
- A fuzzy membership based comparison of the grey matter (GM) in cognitively normal (CN), mild cognitive impairment (MCI), and Alzheimers disease (AD) using brain images
- Age-related differences in GABA: Impact of analysis technique
- White matter brain age as a biomarker of cerebrovascular burden in the ageing brain
- Age- and sex-related differences in baboon (Papio anubis) gray matter covariation
- The Macromolecular MR Spectrum in Healthy Aging
- Multimodal multilayer network centrality relates to executive functioning
- Attentional bias to threat and gray mater volume morphology in high anxious individuals
- Cross-sectional volumes and trajectories of the human brain, gray matter, white matter and cerebrospinal fluid in 9,473 typically aging adults
- Functional connectivity within and between n-back modulated regions: An adult lifespan PPI investigation
- Blood Pressure Variation and Subclinical Brain Disease
- Aging and the Brain: A Quantitative Study of Clinical CT Images
- Lobule-specific dosage considerations for cerebellar transcranial direct current stimulation during healthy aging - a computational modeling study using age-specific MRI templates
- Brain-predicted age difference score is related to specific cognitive functions: A multi-site replication analysis
- eQTL of KCNK2 regionally influences the brain sulcal widening: evidence from 15,597 UK Biobank participants with neuroimaging data
- Assessing distinct patterns of cognitive aging using tissue-specific brain age prediction based on diffusion tensor imaging and brain morphometry
- Effects of Aging on Cortical Neural Dynamics and Local Sleep Homeostasis in Mice
- Accelerated aging of the putamen in patients with major depressive disorder
- Incidental findings on brain MRI of cognitively normal first-degree descendants of patients with Alzheimer's disease: a cross-sectional analysis from the ALFA (Alzheimer and Families) project
- Cognitive Efficiency in Alzheimers Disease is Associated with Increased Occipital Connectivity
- Three-decade neurological and neurocognitive follow-up of HIV-1-infected patients on best-available antiretroviral therapy in Finland
- Frontotemporal Connections in Episodic Memory and Aging: A Diffusion MRI Tractography Study
- Normal Aging in the Basal Ganglia Evaluated by Eigenvalues of Diffusion Tensor Imaging
- Minute Effects of Sex on the Aging Brain: A Multisample Magnetic Resonance Imaging Study of Healthy Aging and Alzheimer's Disease
- Evolution of different MRI measures in patients with active relapsing-remitting multiple sclerosis over 2 and 5 years: a case-control study
- Can imaging techniques measure neuroprotection and remyelination in multiple sclerosis?
- Proton MR Spectroscopy and MRI-Volumetry in Mild Traumatic Brain Injury
- Voxel-based detection of white matter abnormalities in mild Alzheimer disease
- Influence of aging on brain gray and white matter changes assessed by conventional, MT, and DT MRI
- Normative estimates of cross-sectional and longitudinal brain volume decline in aging and AD
- Frontal Lobe Volume, Function, and {beta}-Amyloid Pathology in a Canine Model of Aging
- Neuroimaging tools to rate regional atrophy, subcortical cerebrovascular disease, and regional cerebral blood flow and metabolism: consensus paper of the EADC