
Abstract
BACKGROUND AND PURPOSE: Corpus callosal cross-sectional area (CCA) may be a clinical indicator of disease progression, but factors influencing callosal morphology in healthy subjects must be determined before comparisons can be made in patients. We sought to define a reliable and easily repeatable method for CCA measurement and to examine the effects of sex, age, handedness, and cerebral volume.
METHODS: Neurologically healthy volunteers (age range, 14–68 years; mean age, 32.6 years ± 12.3 [SD]; 44 men, 56 women; 87 right handed) underwent conventional MR imaging. Data were reoriented in the image space to account for intersubject variations in head position before the midsagittal plane was defined by using midpoints of the anterior commissure (AC), posterior commissure (PC), and interhemispheric fissure (IF). Midsagittal CCA and total cerebral volume were measured and correlated with sex, age, and handedness.
RESULTS: The mean CCA was 6.27 cm2 ± 0.90. Women had a larger CCA proportional to cerebral volume (6.16 × 10⁻³ cm−1 vs 5.78 × 10⁻³ cm−1 in men; P = .02). The percentage difference for the CCA-cerebral volume from the group mean was +2.6% in women and −3.6% in men. Only a small linear relationship of CCA with cerebral volume was noted (r2 = 0.15), and CCA was not significantly correlated with age or handedness.
CONCLUSION: To our knowledge, this is the largest study of callosal area in a community-based sample of control subjects; such subjects provide controls for future studies. Our findings provide anatomic evidence of sex differences in interhemispheric connectivity. Much CCA variability is independent of cerebral volume.
The corpus callosum is the major anatomic and functional interhemispheric commissure in the human brain. Much of the information about its function has been gained from clinical studies of patients after surgical resection of the callosum for intractable epilepsy (1–5). Postmortem studies of the corpus callosum (6–8) have yielded information about the number, size, and type of fibers that traverse the commissure, as well as estimates of the midsagittal cross-sectional area of the corpus callosum (CCA) correlated with the number of callosal fibers (9). Conflicting evidence for sexual dimorphism of the corpus callosum from postmortem material in a limited number of subjects has also been presented (10, 11).
MR imaging enables the in vivo study of cerebral structure and function. Several neuroimaging studies have used the midsagittal area of the corpus callosum to show differences in morphology related to sex (12, 13), handedness (14), aging (15, 16), and pathologic states (17). The corpus callosum has been shown to be altered in conditions such as schizophrenia (18) and dyslexia (19), even when visual assessment of the MR images reveals normal findings. In pathologic states such as multiple sclerosis (20–22) and Alzheimer disease (23, 24), quantitative measures of the corpus callosum have been proposed as useful indicators of disease progression.
The results of most of these MR imaging studies remain conflicting and controversial. In many, not enough attention was paid to methodologic issues, resulting in unreliable results, while the rest have differing methods that make comparisons between studies difficult. These limitations have contributed to the lack of agreement between studies. Though many have developed complex postprocessing methods to examine callosal morphology, all use a “midsagittal” image, but they often do not provide information about the two aspects that affect the definition of this initial image: brain orientation within the imaging unit and the anatomic landmarks used to define this midsagittal plane. Without explicit measures to account for or to describe these features, all subsequent processing is prone to error in examining for intersubject differences. Coffman et al (25) and Rauch and Jinkins (26) have both reported significant variability in midsagittal measurements of cerebral structures (including the corpus callosum) that are dependent on subject orientation within the magnet. Some have attempted to overcome this variability by using extracranial markers to align subjects within the imaging unit (15, 16). The use of extracranial landmarks assumes a constant relationship between extracranial and intracerebral structures across subjects. The validity of this assumption has not been proved. Others have acquired data in a sagittal plane optimized to image the chosen plane (27–29), or they have obtained pilot orientation images before data acquisition (12). However, subject movement can still occur between the acquisitions of the pilot images and the subsequent data; this could invalidate the attempt to standardize subject position within the machine. Some have had to discard data that are not in an optimal orientation (16).
The use of thick sections (5–10 mm) with intersection gaps (15–17) reduces the ability to acquire images as close as possible to the midsagittal plane or to interpolate data into a suitable orientation from which to reformat the midsagittal image. Furthermore, the course of callosal fibers and callosal morphology is likely to vary between individuals. To minimize variability in the structure measured across subjects, a consistent definition of the midsagittal plane must be used to provide an in vivo estimate of the midsagittal CCA. Many groups have measured the midsagittal CCA without stating the landmarks that they used to define the midsagittal plane (13, 14, 19). Some studies use a hierarchical system (23), such as that proposed by Coffman (25), based on the visualization of the corpus callosum in the midline. However, if this is the structure being examined for expected differences between groups, using it to define the midsagittal plane may add bias. Another limitation of this type of criterion is that they use the sagittal plane closest to the midsagittal plane in each dataset rather than define the plane itself. This will result in measurements being made on an inconsistent plane across subjects.
A further difficulty in the interpretation of previous work is the lack of repeatability studies, without which it is difficult to assess the true differences between subject groups. There is a need to devise a reliable and repeatable method and assess its limitations. Only then can conclusions on morphologic aspects of interhemispheric connectivity and the role of the corpus callosum in the disease state be drawn.
In this study, we propose a standardized MR imaging protocol for measuring the midsagittal CCA, defining the midsagittal plane, and accounting for intersubject differences in head position. We give examples of its use in overcoming some of the methodologic issues just discussed and present results of intra- and interrater repeatability. Our method was applied to 100 healthy adults drawn from a community population to determine the effects of sex, age, and handedness on CCA and to assess the relationship between callosal area and cerebral volume.
Methods
Subjects
A total of 100 neurologically healthy subjects, 44 men (mean age, 31.2 years, 36 right handed) and 56 women (mean age, 33.8 years, 51 right handed) were imaged (age range for the group, 14–68 years; mean, 32.6 years ± 12.3). Handedness was determined on 13 measures previously validated by Chapman and Chapman (30). The subjects were divided into two groups: right-handed (right handed on the questionnaire), and non-right-handed (left handed or ambidextrous on the questionnaire). The volunteers were drawn from a community population within a 15-mile radius of the study center (31). They underwent a medical interview and examination to exclude notable neurologic illness. Ethical approval was granted by the relevant authorities, and informed consent was obtained from each subject.
Image Acquisition
All images were acquired on the same 1.5-T GE Signa MR imaging unit (GE Medical Systems, Milwaukee, WI). A three-dimensional, coronal, inversion-recovery, prepared fast spoiled gradient-echo sequence was used for image analysis (TE/TR/TI/NEX, 4.2/15/450/1; flip angle, 20°; acquisition matrix, 256 × 128; field of view, 24 cm; 124 contiguous 1.5-mm-thick sections). Voxel size was 0.938 × 0.938 × 1.5 mm. No abnormalities were found in any case upon visual inspection by two experienced neuroradiologists. Image acquisition time is 6 minutes 52 seconds. This T1-weighted sequence is part of our standard clinical protocol for qualitative and quantitative analysis of the whole brain in patients with epilepsy, which is most of our clinical workload.
Corpus Callosum Measurements
Publicly available software (MRreg, available at www.erg.ion.ucl.ac.uk/MRreg.html) (32) was used on a UNIX workstation (Sun Microsystems, Palo Alto, CA) to define the midsagittal plane, to reorient the data, and to measure the CCA. MRreg can be used to display coronal volumetric data and reformatted images in the axial and sagittal planes. It allows points to be chosen in the coronal plane and simultaneously displays the same points in the axial and sagittal planes. It can reorient the dataset by means of rotation about the chosen points. MRreg can be used to measure regions of interest on both the original images and the reformatted images (33).
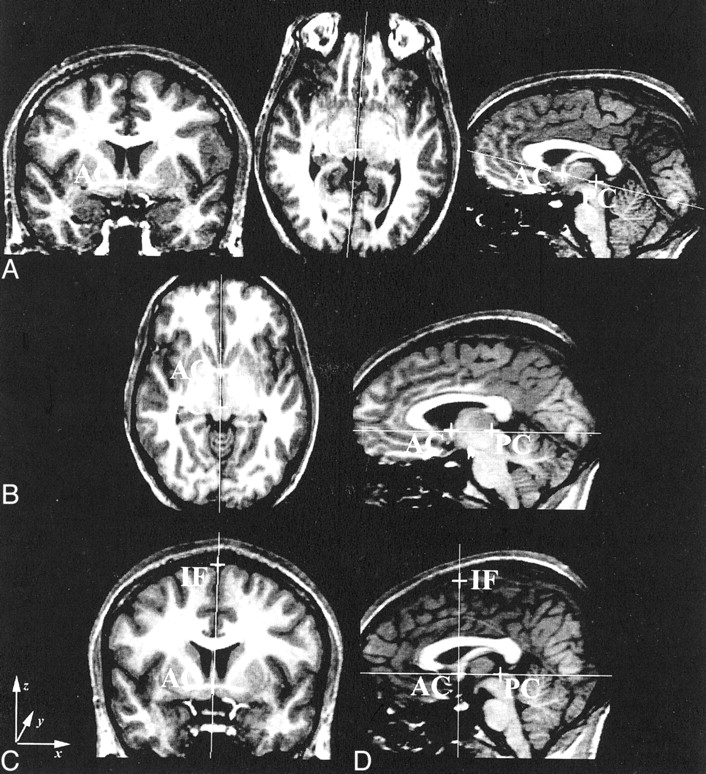
The brain data were reoriented in the image space (a cuboid) to account for variability in rotation, head tilt, and roll. The anterior commissure (AC) and posterior commissure (PC) were defined (with the aid of coronal and axial images) on the most anterior and superior images that contained their midline fibers (Fig 1A). The data were rotated about the PC until the AC-PC line was orthogonal to the faces of the image cuboid (Fig 1B), and resectioned by means of tri-linear interpolation but with no changes in scaling. (Tri-linear is the default; nearest-neighbor and sinc interpolations are also available.) The same AC was again chosen on the reformatted data. (MRreg displays the position of the original AC and PC interpolated onto the new dataset.) The interhemispheric fissure (IF) was defined on the same coronal image as the AC just below the superior sagittal sinus (Fig 1C). The data were rotated about the AC bringing the AC-IF line orthogonal to the faces of the image cuboid. The final reformatted image had the AC, PC, and IF in the midsagittal plane of the data cube (Fig 1D). We defined the midsagittal plane of the brain by using midpoints on the AC, PC, and IF. The CCA was then measured by means of manual tracing on the reconstructed image through this midsagittal plane.

Definition of the midsagittal plane. For the coronal images: x indicates left to right; y, posterior to anterior; and z, inferior to superior.
A, Coronal image through the AC (left), axial image through the PC (middle), and sagittal image of the AC-PC line before the first rotation (right).
B, AC-PC line orthogonal to the image cuboid.
C, Coronal image demonstrating the AC-IF line.
D, Sagittal image through the midsagittal plane after the final rotation.
Total cerebral volume was calculated from the sum of the gray matter and white matter, obtained by means of automated extraction (34) and segmentation of the brain by using SPM99 (35). Independent t tests were used for statistical analysis of sex and handedness differences, and regression analysis was used for correlations of CCA with cerebral volume and age-related differences in CCAs and cerebral volumes.
Measures of Intra- and Interrater Reliability
In 25 randomly chosen subjects, the AC, PC, and IF were chosen, the dataset reoriented, and the CCA measured as CCA1). This procedure was repeated for CCA2. The CCA was also measured again, as CCA3, on the same reconstructed midsagittal image as CCA2 to assess the intrarater reliability of manual tracing. The mean, SD, and coefficient of reliability (CR, 2 × SD) of the signed differences of the repeated measures were calculated. The method was accepted as having good intrarater reliability if 95% of the differences between measures were within 2 SD of the mean difference (36). In 10 subjects, differences in CCA1 measures between two raters were analyzed, as for intrarater calculations. To assess the interrater differences in the choice of landmark position, the mean of the distance (in voxels) between points in each axis was calculated.
We quantified the repeatability of our method by using the CR. Many authors use correlation analysis to examine repeatability. Bland and Altman (36) argue that correlation does not necessarily imply agreement. Repeated measures of the same structure are likely to be highly correlated. It is the variability in the difference between repeated measures that gives a truer assessment of the reliability of a method. The CR is a 95% confidence interval of the difference between two repeated measures, and it may be considered the maximal measurement error with 95% probability.
Results
The mean CCA in this group of 100 subjects from a community population was 6.27 cm2 ± 0.90. The mean CCA was 6.55 cm2 ± 0.98 in men and 6.06 cm2 ± 0.79 in women, with a significant sex difference (P < .01). Men had a greater cerebral volume than women (P < .001) (Table). Regression analysis of CCA and cerebral volume revealed a significant, though small positive linear correlation, r2 = 0.15 (Fig 2A). Because of the confounding effect of sex differences on cerebral volume, the analysis was repeated with callosal area corrected for cerebral volume (CCA-cerebral volume ratio). The sex difference persisted but was reversed with women having a proportionately larger callosal area, P = .02 (Table). The mean percentage difference for CCA was +4.4% in men and −3.4% in women (P < .01). For the CCA-cerebral volume ratio, −3.6% in men and +2.6% in women (P = .02), as compared with the group mean (men and women combined) for each measure.

Scatterplots.
A, Distribution of CCA and cerebral volume (solid squares indicate men, open circles indicate women). Regression analyses results: men, R2 = 0.10 and P = .004; women, R2 = 0.14 and P = .039.
B, Lack of correlation of the CCA-cerebral volume ratio with age (solid squares indicate men, open circles indicate women)
Mean CCA, cerebral volume and CCA:cerebral volume ratio for men and women
There were no significant differences in the age and handedness distributions between the 44 men (mean age, 31.2 years, 36 right handed) and the 56 women (mean age, 33.8 years, 51 right handed). Linear regression of age on the CCA or CCA-cerebral volume ratio did not reveal a significant correlation (Fig 2B); a small negative linear correlation of cerebral volume with increasing age was noted (men, adjusted r2 = 0.12, P = .022; women, adjusted r2 = 0.13, P = .008). No significant correlations were noted between handedness and CCA, cerebral volume, or the CCA-cerebral volume ratio for the whole group or within each sex.
Intra- and Interrater Reliability
It was possible to easily identify the AC, PC, and IF and to perform the procedure in all subjects. The mean intrarater difference in repeat measures (CCA2 –CCA1 and CCA3 –CCA2) tended toward 0. This allowed the use of the CR as a measurement of method repeatability, as suggested by Bland and Altman (36). The CR was 0.55 cm2 for CCA2 –CCA1 (reorientation and manual tracing) and 0.50 cm2 for CCA3 –CCA2 (manual tracing only). All differences between the repeat measures (CCA2 –CCA1, CCA3 –CCA2) were within 2 SD of the mean difference of repeat measures. The CR for the intrarater repeat measures suggested that the method of manual tracing had a greater influence on the variability in the measured CCA than did the reorientation process.
Interrater differences in CCA1 had a CR of 0.57 cm2. All differences in measures between the raters were within 2 SD of the mean difference. For both intra- and interrater measurements, the difference in repeat measures was not related to the CCA (regression analyses, P > .05). Comparison of the coordinates of the landmarks between raters revealed a mean difference of less than 1 voxel in all planes for the AC and PC. The greatest difference between raters was for the IF, with a mean difference of less than 2 voxels in the x plane and less than 3 voxels in the z plane. The y coordinate, being defined by the location of AC (IF and AC were defined on the same coronal image), which had good interrater agreement, differed by less than 1 voxel (Fig 1).
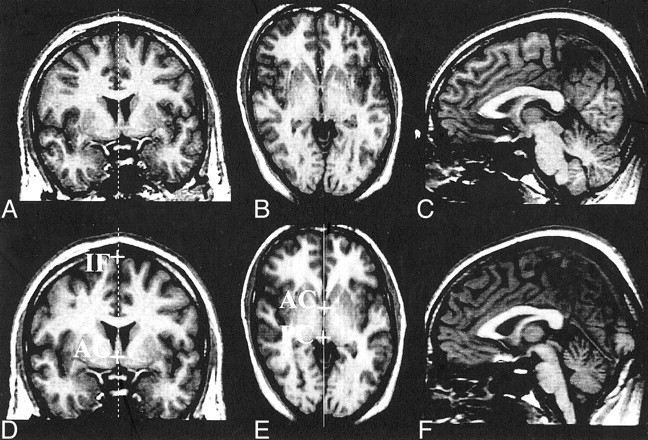
In Figures 3 and 4, we illustrate some of the methodologic issues discussed and demonstrate the advantages of our method. Figure 3 demonstrates the use of our method in a subject with minimal head tilt and rotation within the imaging unit; this result was compared with the CCA obtained by using the criteria of Coffman et al (25). The difference in CCA was 1.39 cm2, even with this minimal difference in orientation. Figure 4 illustrates images in a subject; on visual inspection, alone, these appear to be in an optimal orientation. Although a visual comparison gave the impression that both midsagittal images appeared similar, the difference in the CCA between the two methods was 0.92 cm2. This was greater than the intrarater CR (0.55 cm2) and therefore could not be attributed solely to the measurement error due to manual tracing. Nine of the 25 subjects included in the reliability studies had a difference in CCA that was greater than the intrarater CR when we compared measurements by using the criteria of Coffman et al and our protocol (range, 0.05–1.40 cm2). This observation demonstrated the influence of the position of the midsagittal section on the variability of callosal measurements, and it illustrated the importance of applying a consistent, repeatable method to define the midsagittal plane in all subjects.

Application of the method to subject data with minimal head tilt and rotation within the unit.
A and B, Coronal and axial images through the AC. The midsagittal plane used to reformat the midsagittal image by using the criteria of Coffman (25) is seen in A.
C, Midsagittal plane, reformatted image. CCA is 5.53 cm2.
D and E, AC, PC, and IF after reorientation by using protocol described in Methods. Coronal (D) and axial (E) images.
F, Midsagittal reformatted image after reorientation. CCA = 6 .93 cm2.

Application of the method to the data; on visual inspection, they appear to be in an optimal orientation.
A–C, Original data. Coronal (A) and axial (B) images through the AC and midsagittal image (C) reformatted by using the criteria of Coffman et al (25). CCA = 5 .65 cm2
D–F, Coronal (D), axial (E), and midsagittal (F) images after reorientation and subsequent reformatting of the midsagittal plane by using our method. CCA = 6 .57 cm2.
Discussion
We have demonstrated a reliable method for in vivo measurement of the midsagittal CCA and applied it to 100 control subjects. This sample provides useful normative data about the corpus callosum in a community-based sample, the largest in the literature. Many studies have used control subjects from a selected, highly educated population (12, 13, 37). A community sample of control subjects is more closely matched to patients when comparisons are made between disease states and the normal state. The mean CCA and cerebral volume in our subjects is comparable with measurements obtained from postmortem results (10, 38) and previous MR imaging studies (39–41) when the different subject groups and methodologies are taken into consideration.
With this method, we have demonstrated sexual dimorphism of the corpus callosum. We have found a larger absolute callosal area in men but a greater callosal-cerebral volume ratio in women. Previous MR imaging studies have shown mixed results for sex differences in the callosal area. Several have failed to find statistically significant sex differences in measuring the total CCA (42–44), whereas others have found regional differences only upon the subdivision of the corpus callosum into an arbitrary numbers of segments (45, 46). The results of a study by Jäncke et al (46) dispute callosal sex differences; they argue that smaller brains have a larger callosal area, independent of sex. They did not find sex differences in the absolute callosal area; however, like us, they did find a significantly larger callosum-to-forebrain volume ratio (CC ratio) in women. Possible linear, quadratic, and logarithmic relationships between the absolute callosal area, CC ratio, and cerebral volume were examined. They found significant correlations (r2 = 0.10–0.30) with a sex difference in the slope of the regression lines in the logarithmic equations. However, they concluded that there was no principal sex effect on callosal area; the differences found were attributed to the differences in cerebral volume between the groups. Their attempts to compare the absolute callosal area and the CC ratio in men and women with similar brain sizes are hampered by a proportionately greater number of subjects of one sex in each group for which this was examined. This factor limits interpretation of the lack of sex effect in similarly sized brains in their study. It is well established that, as a group, men have a greater cerebral volume than women (47, 48). The literature contains evidence for differences in cerebral structure (49–51) and function (13, 52, 53) between the sexes, after investigators account for differences in brain size. Investigators also question the validity of comparing women having a larger cerebral volume with men having a smaller cerebral volume, as these variances may represent different subpopulations within their group. This concern led us not to perform a similar statistical analysis, although, in our study, men with larger brains do not consistently have a smaller callosal area; conversely, women with smaller brains did not have a larger callosal area (Fig 2A). The study by Jäncke et al differs from ours on two important methodologic points: First, their study population was recruited from a medical school rather than from the general population. Second, their method of image analysis was not based on a consistently defined midsagittal image of the corpus callosum. This may explain the lack of a significant sex difference in the absolute callosal area in their data. Comparison of our data with theirs reveals a different distribution of callosal area across subjects, with a similar range of brain sizes. In addition, although the range and mean cerebral volumes in the two studies are comparable, a greater overlap in cerebral volumes was observed between the sexes in their study than in our study. This finding may again reflect differences in the study populations. We also differ in interpreting the strength of the correlation between callosal area and cerebral volume, and we would not regard their data as showing a “strong” relationship (r2 = 0.18) between the two. In our sample, only a small proportion (men, r2 = 0.10; women, r2 = 0.14) of the variance in CCA can be attributed to cerebral volume. The same authors have also suggested that the relationship between callosal CCA and cerebral volume is better described by a non-isometric relationship. This is derived from the geometric relationship between the surface area and the volume of a sphere, where surface area is proportional to volume raised to the power 2/3. The data of Jäncke et al did not reveal a significant quadratic relationship between the absolute callosal area and the CC ratio with forebrain volume. Further analysis of our data also did not a reveal stronger correlation of the CCA with cerebral volume2/3 (r2 = 0.16, P < .001). This finding suggests that, in fact, most (>80%) of the variability in callosal area is determined by other factors. Sex differences in our subjects persisted after we corrected for cerebral volume, although we acknowledge that callosal area-to-cerebral volume ratios only correct for linear effects of cerebral volume on callosal area.
The region-of-interest-based methods used in the studies just mentioned have been criticized for being biased by local variability in shape of the callosum. Davatzikos and Resnick (40) have reported a new method for the regional morphologic analysis of the corpus callosum, comparing sex differences in shape by using point-wise deformation functions across the whole of the midsagittal callosal area. Unfortunately, they do not provide detailed information on the anatomic definition of their midsagittal image, although a correction was attempted for brain orientation. Their results support our finding of a larger callosal area in men, with a reversal of sex differences when they are normalized for the effect of brain volume. Their results indicated a larger, more bulbous anterior splenium in females. However, they acknowledge the older age distribution of their sample and the need to replicate their results in a younger sample. Our subject group is substantially younger than that examined by Davatzikos and Resnick. Our results confirm that the sex differences in callosal area appear to be present throughout adult life and that they are not a possible consequence of differential aging processes between men and women.
A more recent study involving the use of a probabilistic map of the corpus callosum (54) has also confirmed larger total callosal, anterior midbody, and splenial areas in women relative to brain size. The subjects were young and all right handed, though no further information is provided about the method of recruitment. The images were registered into Talairach-like stereotaxic space by using linear transformations to normalize for the effects of brain volume between sexes; the need to use area-volume ratios was thus avoided. To compare their results with those of previous reports, absolute callosal area and brain volumes were calculated by reversing the dimensions of scaling used for the transformation process, and their ratios were also examined. The results were concordant with the stereotaxic method: Men had a larger absolute total callosal area, and women larger callosal-brain volume ratios. These authors have also suggested that normalization for differences in brain volume should use a corrected brain volume raised to the power 2/3; however, like us, they did not find a linear correlation of CCA to brain volume raised to the power 2/3 stronger than that of CCA to brain volume. Despite the geometric rule for the area-volume relationship of a sphere, we have not found evidence to suggest that this is a better model for the relationship between the CCA and brain volume. Bermudez and Zatorre’s method provides an alternative normalization process to overcome intersubject differences in brain size. One disadvantage of this method is that it performs a global fit for the whole brain into stereotaxic space. When used for intersubject registration, nonlinear anatomic differences introduce nonequivalent stereotaxic locations for homologous landmarks from different brains (55). Although it is possible to define a consistent midsagittal plane in stereotaxic space, this may not be the same anatomic plane in all subjects. Our method defines the midsagittal plane by using midline landmarks and reorients the data to make this plane orthogonal to the image cuboid. There are no changes in scaling thus maintaining homology between brains.
We did not find a correlation between CCA or the CCA-cerebral volume ratio with handedness. Our group of subjects contained a relatively small number of people who were not right handed; the number may not have been sufficient to investigate this relationship. Those studies that have found a strong negative correlation of CCA with age included older subjects. The influence of age-related loss of brain volume could have a greater role in the loss of interhemispheric fibers and, hence, callosal area.
Our method uses thin 1.5-mm contiguous sections to interpolate all data into the same orientation, enabling a consistent definition of the midsagittal plane and consistent measurement of the CCA of the corpus callosum. The optimum landmarks need to be easily and reliably identified. Arndt et al (56) have demonstrated that the AC and PC can be reliably located. Our results confirm these findings. In addition, we have presented interrater repeatability data on our third chosen landmark, the IF. A point on the IF chosen as the fissure was one of the most easily identifiable landmarks in the midsagittal plane. The IF had the greatest interrater variability of all the landmarks. Despite these differences, the intra- and interrater comparisons of CCA demonstrate that reliability in the choice of all landmarks by this method is robust both within and between raters, with variability in CCA being more dependent on manual tracing than the choice of landmark. Reformatting by using nonwarping rotational transformations maintains the area and volume relationships, permitting inferences to be made by means of comparisons between subjects. Lack of reliance on optimal subject orientation within the imaging unit maximizes the use of all acquired data. Of the 25 subjects in our repeatability study, six could not have been studied without reformatting; the rest all differed in their orientation, to a lesser degree.
The reproducibility and consistency of measurements in our method has highlighted sex differences not apparent in other region-of-interest MR imaging studies. However, it is concordant with morphologic studies using deformation functions and probabilistic maps of the corpus callosum. Investigators interested in examining interhemispheric connectivity in healthy subjects or in disease states have been drawn to the callosal midsagittal CCA due to the ease by which the contours of the corpus callosum can be visualized in this plane. From the many published reports, great variability clearly exists in this measure in healthy subjects. Contributing to the discrepant results are the different methodologic approaches. Before any further research is undertaken, consensus on these issues—a standard protocol for image acquisition, correction for orientation and an anatomic definition of the midsagittal plane used for measurement—is needed because these factors affect all further extraction of quantitative information. We propose our protocol as a simple method, one easily applicable by using publicly available software.
Correction for intersubject variation in brain size is more complex. We and others (37, 54) have shown that variability in callosal area attributable to brain volume is not largely explained by a linear or even non-isometric model. A sex difference also exists in this relationship. A linear relationship would suggest that a larger cerebral volume contains more cortical neurons, with increased numbers of laminae II and III neurons contributing to a greater number of interhemispheric fibers. However, not all cortical regions extend interhemispheric fibers (57), which perhaps explains the lack of the strength of this relationship. Stereotaxic methods are an alternative to using ratios, but they cannot ensure homology between subjects in defining an anatomic plane. Both the stereotaxic and deformation-based methods are useful in overcoming the difficulties encountered with arbitrary subdivision of the corpus callosum in attempting to regionalize differences in morphology; however, both use the midsagittal image of the corpus callosum for further postprocessing.
To define the midsagittal plane, we made the assumption that a constant relationship exists between the cerebral hemispheres, AC, PC and the corpus callosum. This limitation occurs in almost all quantitative imaging studies involving a method is based on normal anatomy. Though this assumption may hold true in healthy subjects and in those with acquired pathologic states, it may not be true in subjects with abnormal cerebral development. The altered anatomy of the cerebral hemispheres may also make identifying the landmarks difficult. The reports on abnormal morphology of the corpus callosum in these subjects are many (58–60), but few describe quantitative measurements of the corpus callosum in malformations of cortical development (61). Studies on the AC or PC in these individuals are few (58), though the literature contains case reports of a small number of subjects with a hypoplastic AC (62, 63) and with an absent PC (59) in combination with callosal dysgenesis and other cerebral malformations. Animal studies have shown altered callosal connections in models of microgyria (64). Further MR imaging studies in these subjects have the potential to reveal information about cerebral connectivity in vivo, and perhaps about the topography of callosal connections, by correlating regional CCA with focal areas of abnormal cortical organization. They may also yield possible candidate genes involved in commissural development.
Some evidence supports a biologic cause of sex. Sex hormones (65, 66) and X-linked genes such as filamin (67) and doublecortin (68) are known to affect cerebral development. The functional significance of the sex difference in interhemispheric connectivity is still under investigation and was not explored in this study. An increase in callosal area has been found to be correlated with an increase in axon number (9), which could facilitate interhemispheric transfer of information. Hypotheses based on neuropsychological measures relate an increase in callosal size to improved performance on tasks that require bilateral cognitive processing (13).
The wide variation in the shape and size of the corpus callosum in healthy subjects remains largely unexplained. Sex is only one of many possible factors that could influence interhemispheric connectivity. Other possible effects include developmental and educational processes and other genes involved in cerebral organization.
Conclusion
We present a reliable method that can be applied in a consistent manner to estimate the midsagittal CCA. The application of this method to a large group of community volunteers has revealed significant callosal sex differences. The use of a uniform method in future studies may yield more consistent results, revealing the biologic and functional importance of interhemispheric differences in normal and abnormal brain development. These may serve as clinical measures of disease progression in subjects with pathologic states such as multiple sclerosis and Alzheimer disease.
Acknowledgments
We are grateful to Drs. Brian Kendall and John Stevens for their radiologic expertise.
Footnotes
Supported by an MRC (UK) Cooperative Group Component Grant (T.N.M., S.L.F., S.M.S., S.D.S.) and the Institut fuer Diagnostik der Epilepsien (M.M.).
References
- Received April 9, 2002.
- Accepted after revision September 5, 2002.
- Copyright © American Society of Neuroradiology
In this issue


Jump to section
Related Articles
Cited By...
- Hand preference and the corpus callosum: Is there really no association?
- Handedness and midsagittal corpus callosum morphology: A systematic meta-analytic evaluation
- Handedness switching as a presenting sign for pediatric low-grade gliomas: An insight into brain plasticity from a short case series
- Regional White Matter Atrophy-Based Classification of Multiple Sclerosis in Cross-Sectional and Longitudinal Data
- Progression of non-age-related callosal brain atrophy in multiple sclerosis: a 9-year longitudinal MRI study representing four decades of disease development