
Article Figures & Data
Figures
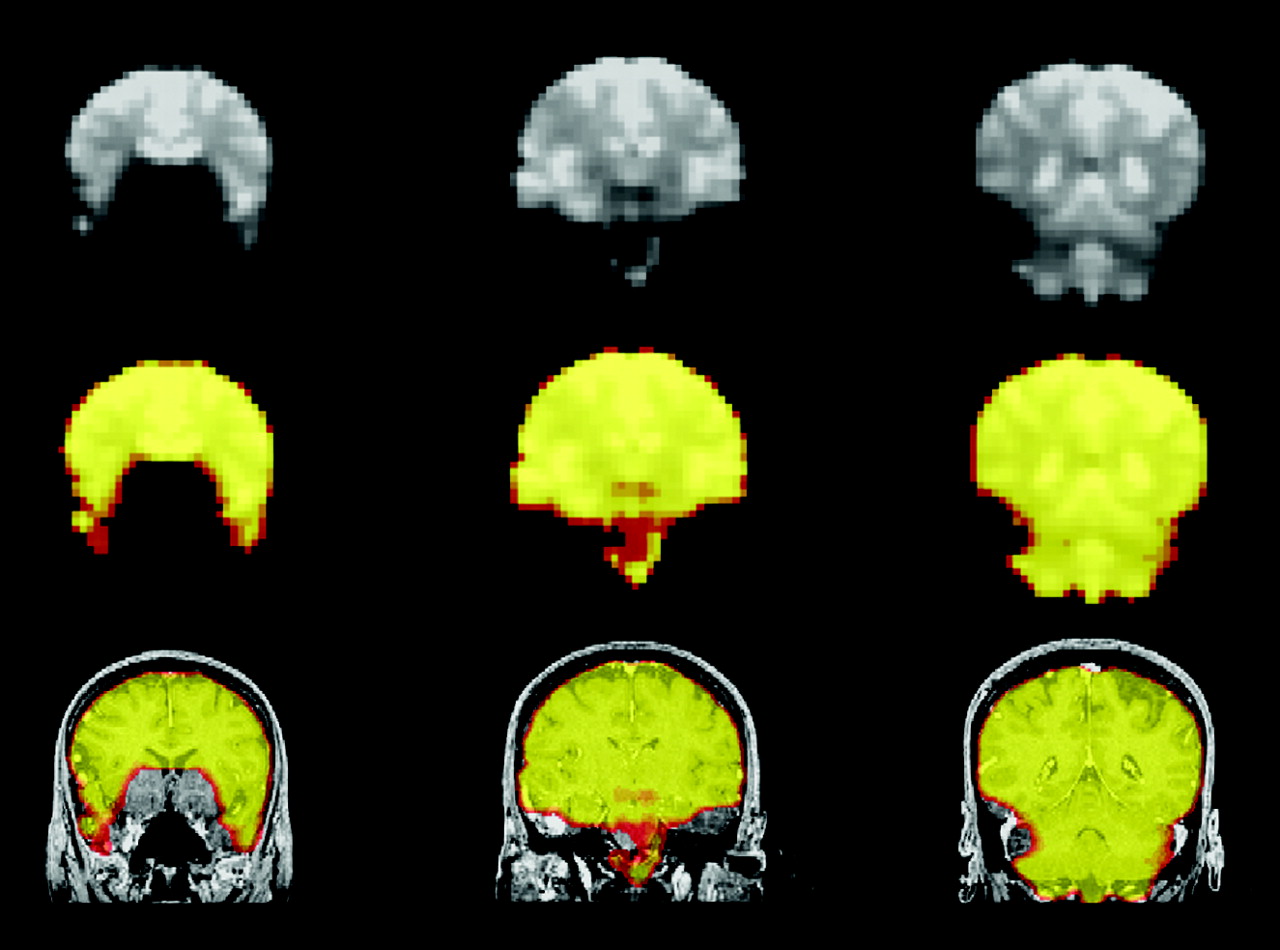
- Fig 1.
Illustration of SIM map processing. Top row, three noncontiguous coronal EPIs from an fMRI patient dataset show diminished signal intensity from the medial-inferior frontal lobes. Middle row, same sections converted to semitransparent colored masks, which can be superimposed on anatomic images. Bottom row, spatially smoothed version of the masks overlaid on coregistered high-resolution anatomic T1-weighted images. Colorization in the SIM demonstrates regions of adequate EPI signal intensity for detection of the BOLD effect.
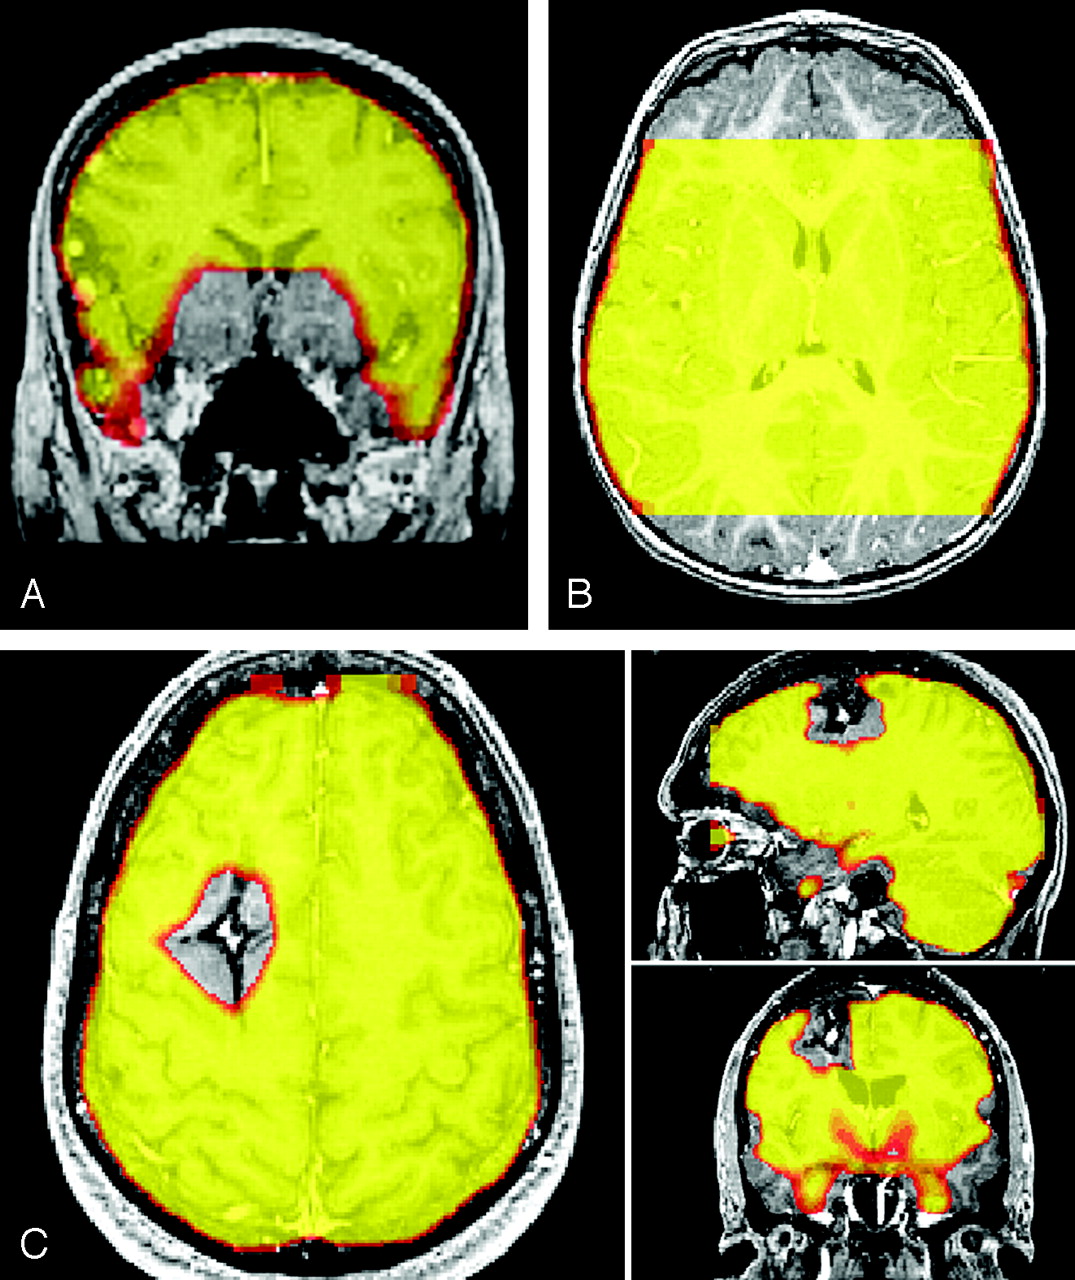
- Fig 2.
Types of susceptibility artifact.
A, Type I signal intensity loss in the regions of the sinuses or skull base.
B, Type II signal intensity loss due to incomplete coverage of the brain with the EPI.
C, Type III signal intensity absence in a region of brain distant from the sinuses or skull base. In this case, a cavernous hemangioma with blood products produces the susceptibility effect.
- Fig 3.
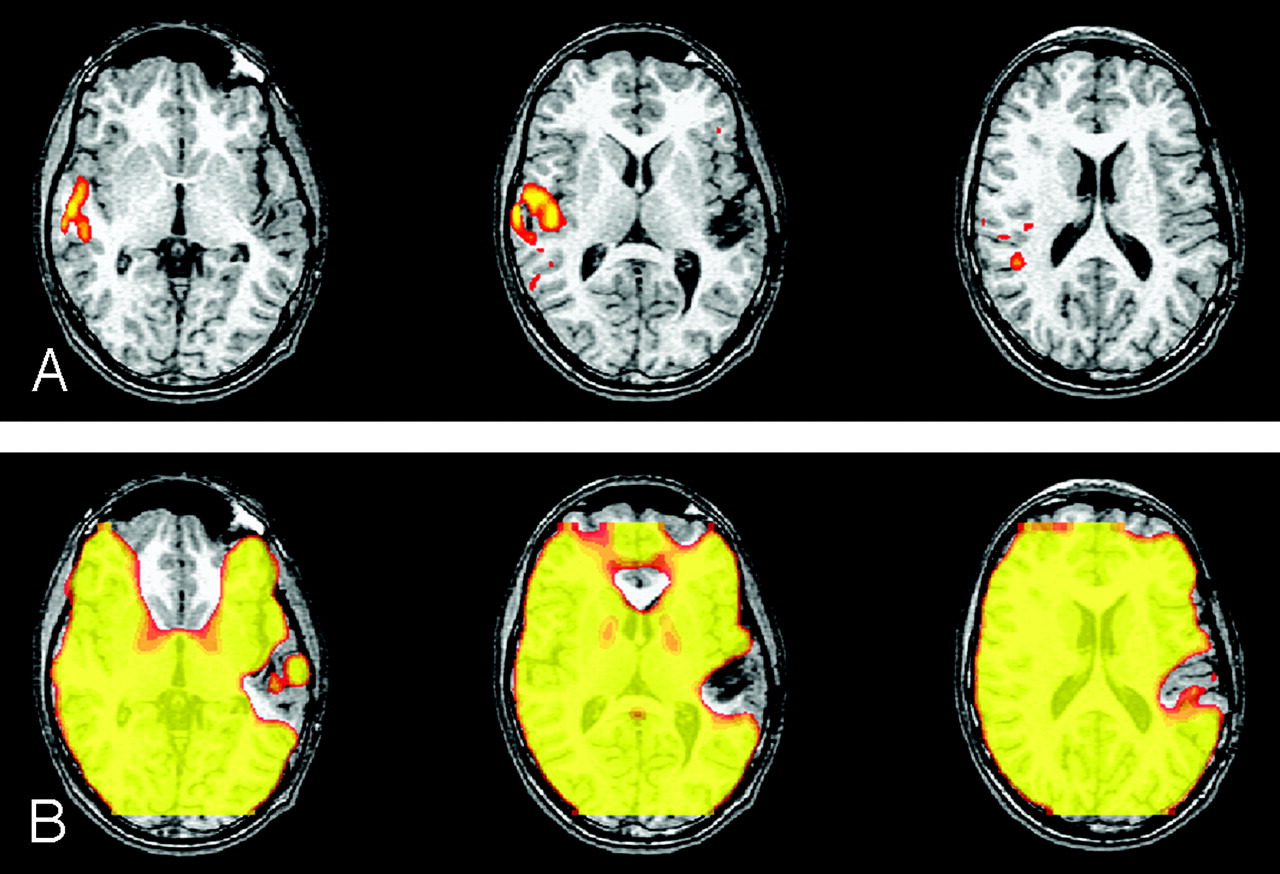
fMRIs in which three readers changed their answer when the SIM was available. (Paradigm was listening to narrated text.)
A, Readers were asked if the left auditory cortex was intact. Three responded “no,” and one responded “indeterminate.”
B, On viewing the SIM, which shows a large area of signal loss in the left temporal lobe, all four readers answered “indeterminate.” Signal intensity dropout was due to hemosiderin from an AVM.
- Fig 4.
fMRI study of language. (Paradigm was antonym word generation from visual cues).
A and B, Patient had a large susceptibility artifact, as evident on the SIM in B, due to dental braces. On the basis of the images in A, three readers considered frontal language dominance indeterminate and one fellow reader considered it right. Two staff readers considered posterior language dominance indeterminate, one fellow reader considered it right, and one fellow considered it mixed. After viewing the mask SIM, all four readers considered both frontal and posterior language dominance indeterminate.
C, Prior fMRIs obtained before the placement of dental braces clearly demonstrate left dominance for language.


Tables
Category and Question Answer Language Frontal hemispheric dominance for language? L, R, mixed, indeterminate Posterior hemispheric dominance for language? L, R, mixed, indeterminate Sensorimotor R sensory cortex location? Normal, abnormal, indeterminate L sensory cortex location? Normal, abnormal, indeterminate L motor cortex location? Normal, abnormal, indeterminate L sensorimotor cortex location? Normal, abnormal, indeterminate R sensorimotor cortex location? Normal, abnormal, indeterminate R sensorimotor cortex location (L foot)? Normal, abnormal, indeterminate L sensorimotor cortex location (R foot)? Normal, abnormal, indeterminate R sensorimotor cortex location (L hand)? Normal, abnormal, indeterminate L motor cortex location (R foot)? Normal, abnormal, indeterminate Auditory R auditory cortex intact? Yes, no, indeterminate L auditory cortex intact? Yes, no, indeterminate Primary Diagnosis Artifacts Tumor (n = 95) 38 (40) Vascular (n = 42) 27 (64) Trauma (n = 2) 2 (100) Other (n = 13) 0 (0) Note.—Data in parentheses are percentages.
Cause Cases Blood products 38 (25) Surgical site 30 (20) Calcium 12 (8) Embolization materials 2 (1) Dental devices 2 (1) Air 2 (1) Basal ganglia mineralization 1 (1) Intracranial pressure monitor 1 (1) Note.—Data in parentheses are the percentage based on 152 patients.
Fellow and Question Initial Answer Answer with SIM Fellow 3 Frontal hemispheric dominance for language? L Indeterminate L Indeterminate L Indeterminate Posterior hemispheric dominance for language? R Indeterminate R auditory cortex intact? No Indeterminate No Indeterminate L auditory cortex intact? No Indeterminate No Indeterminate R foot sensorimotor cortex location? Abnormal Indeterminate R sensorimotor cortex location? Abnormal Indeterminate L motor cortex location? Abnormal Indeterminate L foot motor cortex location? Abnormal Indeterminate Fellow 4 Frontal hemispheric dominance for language? R Indeterminate R Indeterminate L Mixed L Mixed L Mixed Posterior hemispheric dominance for language? L Indeterminate L Mixed L Mixed Mixed Indeterminate R auditory cortex intact? No Indeterminate L auditory cortex intact? No Indeterminate No Indeterminate R hand sensorimotor cortex location? Abnormal Indeterminate R sensorimotor cortex location? Abnormal Indeterminate L motor cortex location? Abnormal Indeterminate
In this issue


Jump to section
Related Articles
Cited By...
- No citing articles found.