
Abstract
BACKGROUND AND PURPOSE: The role of advanced MR imaging techniques in demonstrating the microarchitectural changes in osteoporosis has been recently investigated. Our aim was to determine the role of quantitative and diffusion MR imaging in the diagnosis of osteoporosis compared with dual-energy x-ray absorptiometry (DEXA).
MATERIALS AND METHODS: Fifty-one subjects underwent both DEXA and conventional MR imaging with diffusion and apparent diffusion coefficient (ADC) mapping. T1, T2, diffusion signal intensity, and ADC values were calculated and compared with bone mineral attenuation (BMD). Results were obtained from L1 to L4 of each patient with a total of 204 lumbar vertebrae.
RESULTS: Both T1 and T2 signal intensities tended to increase when both diffusion and ADC values decreased with reducing BMD.
CONCLUSIONS: An inverse relationship between BMD and T1 and T2 signal intensities and a direct relationship between diffusion and ADC values were present in this pilot group. The T1/diffusion signal-intensity ratio could be a reliable diagnostic indicator of osteoporosis.
Osteoporosis is a metabolic disease of bone tissue. There is not only a decrease in bone mass but also microarchitectural deterioration as well.1 Osteoporosis occurs in approximately 44 million American men and women, accounting for 55% of the population aged 50 years and older.2 As a result of osteoporosis, bone weakness, which might lead to fracture, develops. Osteoporotic fractures are fairly common; almost half of white women will develop osteoporotic fractures during their lifetimes.3 If not treated aggressively, the mortality and morbidity are high. The World Health Organization uses dual-energy x-ray absorptiometry (DEXA) to quantify osteoporosis.4 Bone densitometry is currently the single best predictor of osteoporotic fracture risk.5,6 It is used to follow therapeutic interventions.5,7
The MR imaging techniques developed for better understanding of osteoporosis are MR relaxometry, high-resolution MR imaging, MR spectroscopy, diffusion MR imaging, and MR perfusion. MR relaxometry and high-resolution MR imaging are based on the study of trabecular bone. Maeda et al8 pointed to the presence of fat in osteoporotic marrow, which modulates MR relaxation times by increasing T2, T2*, and T2′ and by decreasing T1. Recent studies of high-resolution MR imaging with 3T revealed microarchitecture of bone tissue much better than 1.5T MR imaging systems.9 MR perfusion studies showed a substantial decrease in vertebral marrow perfusion in osteoporotic and osteopenic subjects compared with normal groups in both genders.10,11 This might suggest the vascular component in the pathogenesis of osteoporosis. The atherosclerosis of small vessels was hypothesized as a major factor in the reduced perfusion of vertebrae of patients with osteoporosis.11 Griffith et al10 were able to demonstrate the decrease in vertebral perfusion and increase in the fatty marrow in the same study group, with reduced bone mineral attenuation (BMD) measured by DEXA. The reduced perfusion might be a contributing factor in the diffusion restriction of osteoporotic vertebrae. MR spectroscopy studies demonstrated the fatty marrow increase as a marker of bone weakness.12,13 Diffusion MR imaging studies are relatively new.14,15
Our purpose in this study was to determine the accuracy of diffusion as well as T1 and T2 signal intensity on MR imaging compared with DEXA. We compared T1, T2, diffusion signal intensity, and apparent diffusion coefficient (ADC) values of each vertebra with BMD calculated by DEXA.
Methods
A total of 88 subjects were consecutively enrolled during a 2-month period (from May to June 2006). Subjects with a known pre-existing bone disease such as tumor, metastasis, or metabolic disorder were excluded from the study. The subjects on drug therapy that may affect BMD were not included to the study. If the subjects fit the criteria, they were invited to participate in the research project. Informed consent was obtained from all subjects, according to institutionally approved procedures, regulations, and forms. All examinations were performed on a 1.5T whole body MR imaging system (Excite; GE Healthcare, Milwaukee, Wis) with a 3-mT/m maximum gradient capacity. Diffusion-weighted images (DWI) were acquired by using a spin-echo single-shot echo-planar imaging sequence (TR, 10,000 ms; TE, 68 ms; section thickness, 5 mm; FOV, 28 mm; matrix, 128 × 128; NEX, 2). The diffusion sensitivity parameters (b-values) were altered by varying the gradient amplitude while keeping the gradient duration and separation time constant. Two DWIs were obtained with b-values of 0 and 600 s/mm2 in 3 planes (x, y, z). ADC values were calculated automatically. T1-weighted images were acquired by using a fast spin-echo sequence (TR, 700 msec; TE, minimum full; section thickness, 4 mm; FOV, 30 mm; matrix, 352 × 192; NEX, 2). T2-weighted images were obtained by using a fast spin-echo sequence (TR, 3275 ms; TE, 88 ms; section thickness, 4 mm; FOV, 30 mm; matrix, 352 × 192; NEX, 2). The mean and SD of the signal intensity values were measured from operator-defined regions of interest on T1, T2, DWIs, and ADC maps. The region of interest area was 242 mm2. This measurement was chosen because it was possible to cover a great proportion of the vertebral body in all cases. For each vertebral body, the region of interest was drawn manually on the images by 1 investigator (A.S.). The investigator was blinded to the DEXA results. The results were double-checked, first during the examination and second after all subjects' procedures were completed before the statistical analysis.
BMD data were obtained on a DEXA scanner (Discovery; Hologic, Bedford, Mass). The L1 through L4 vertebrae were scanned and measured in the anteroposterior direction. Subjects were positioned supine with the lower part of the legs elevated to reduce lordosis of the lumbar region. After completion of DEXA scanning, BMD (grams per square centimeter) as well as t and z-scores for individual lumbar vertebrae (L1–L4) were calculated by using on-line software. These measurements were fed into the data comparison pool. The World Health Organization considers a T score of less than −2.5 as indicative of osteoporosis. Osteopenia denotes bone loss in the range of −1 to −2.5. Subjects with an average T score above −1 are considered healthy.
The statistical analyses presented demographic, physical, and laboratory examination findings by using mean, median if needed, SD for numeric variables, and percentage distributions for the categoric ones.
The analyses used to compare normally distributed independent variables groups were the 1-way ANOVA test and the Kruskal-Wallis test for non-normally distributed independent variables groups. Post hoc analyses were performed with the Mann-Whitney U test and the Tukey Honestly Significant Differences test. The correlations between variables were analyzed with the Pearson or Spearman correlation tests. Values of P < .05 were considered statistically significant. Analyses were performed with SPSS Version 12.0 program (SPSS, Chicago, Ill).
Results
A total of 51 subjects (F/M:41/10; mean age, 52; age range, 20–86) underwent both DEXA and conventional MR imaging with DWI and ADC mapping. Sixteen subjects were not recruited into this study due to refusal. Twenty-one subjects were excluded from further analysis due to known pre-existing bone disease and drug therapy. Results were obtained from L1 to L4 of each subject, with a total of 204 lumbar vertebrae. T1, T2, diffusion signal intensity, and ADC of each vertebra were calculated and compared with BMD and t-score values.
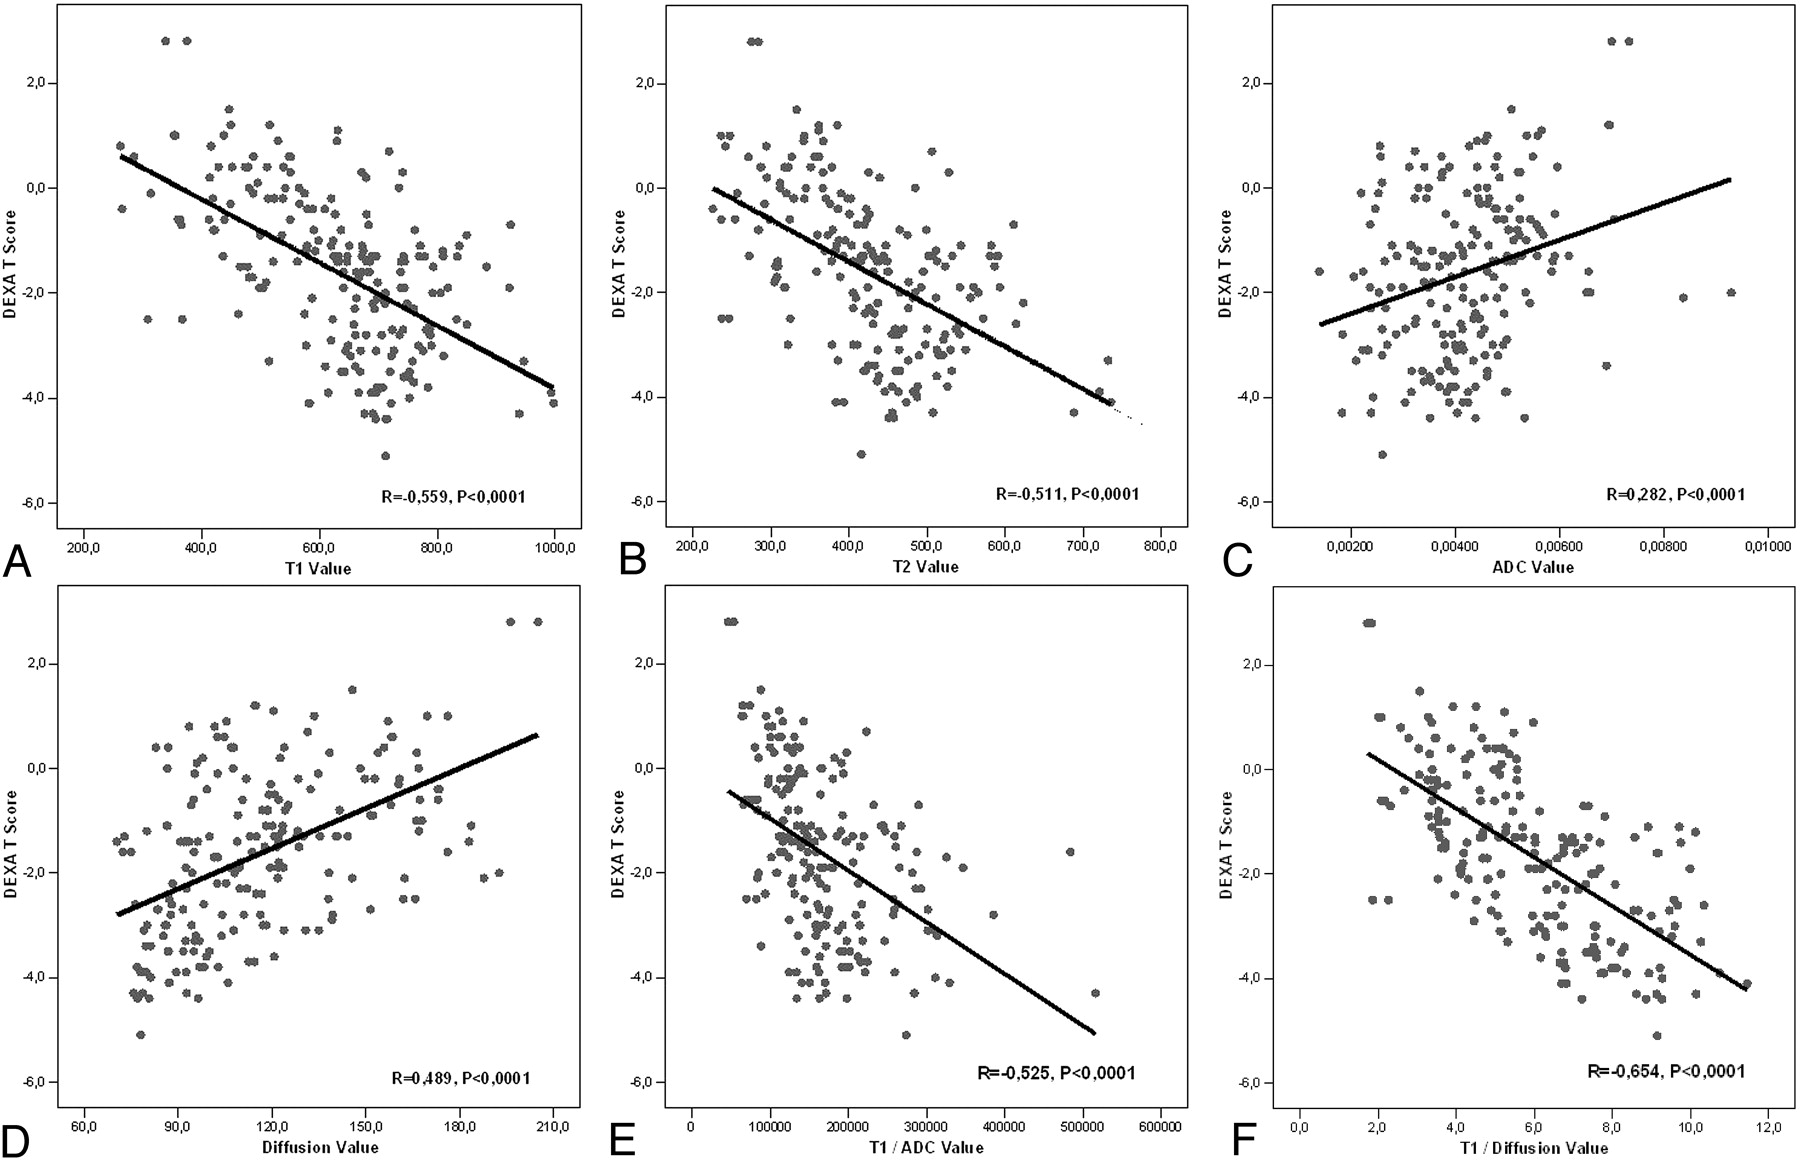
A total of 204 vertebrae were placed into 3 groups according to t-score values: 68 (normal), 70 (osteopenia), and 66 (osteoporosis). The difference between ADC and diffusion signa-intensity values of normal, osteopenic, and osteoporotic vertebrae were statistically significant (Fig 1). ADC and diffusion values tended to decrease with reducing t-score values. The decrease was statistically significant. T1 and T2 signal-intensity values tended to increase with reducing t-score values. The increase was statistically significant. There was a statistically significant reverse correlation between t-score and T1/diffusion and T1/ADC signal-intensity values. Figure 2 demonstrates these findings in detail. Analysis of BMD values provided results similar to those of t-scores.

A, Graph of ADC values for normal, osteopenic, and osteoporotic subjects. The differences between groups are significant (P < .0001, Kruskal-Wallis Test). Normal versus osteopenia, P = .026; normal versus osteoporosis, P < .0001; osteopenia versus osteoporosis, P = .077 (Mann-Whitney U test). B, Graph of diffusion signal-intensity values for normal, osteopenic, and osteoporotic subjects. The differences between groups are significant (P < .0001, Kruskal-Wallis test). Normal versus osteopenia, P = .004; normal versus osteoporosis, P < .0001; osteopenia versus osteoporosis, P < .0001 (Mann-Whitney U test).
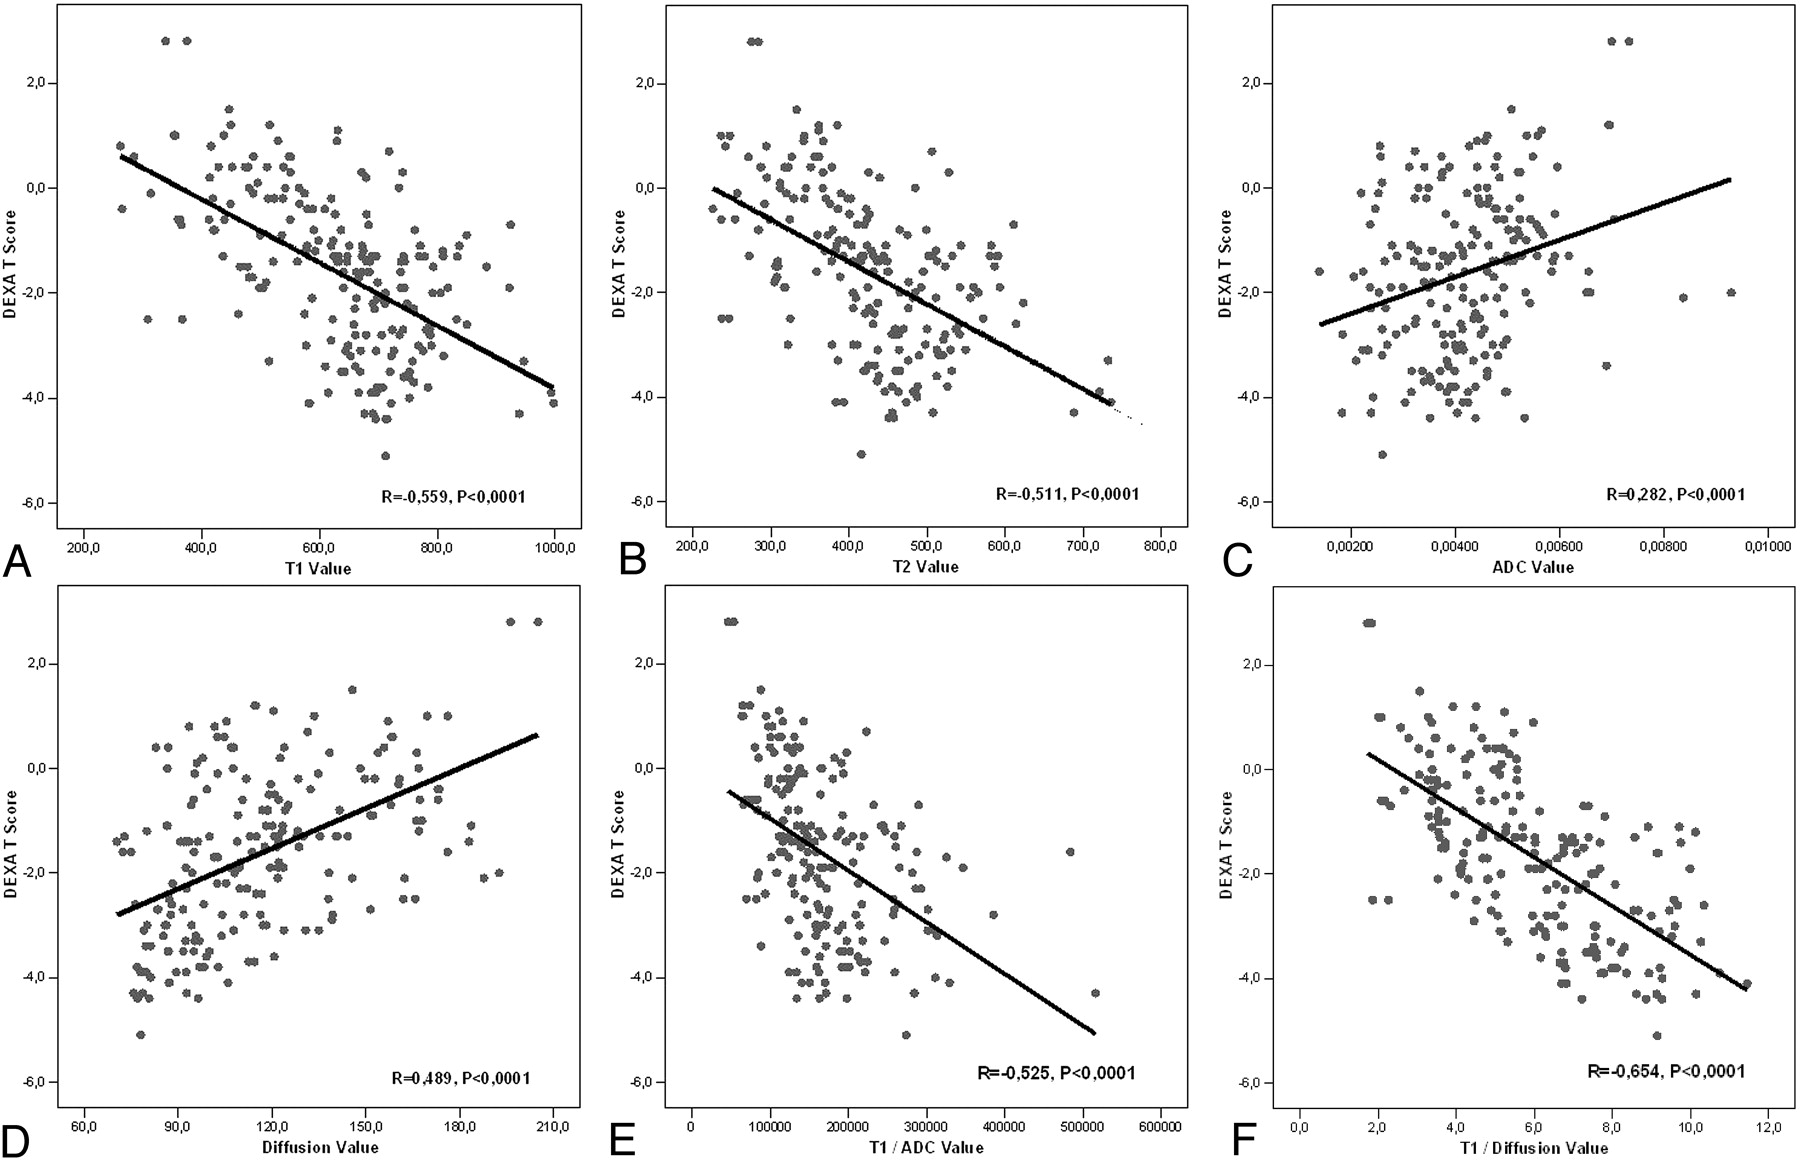
A, The correlations graphics of DEXA t-scores and T1 signal-intensity values (R = −0.559, P < .0001). B, The correlations graphics of DEXA t-scores and T2 signal intensity values (R = −0.511, P < .0001). C, The correlations graphics of DEXA t-scores and ADC values (R = 0.282, P < .0001). D, The correlations graphics of DEXA t-scores and diffusion signal-intensity values (R = 0.489, P < .0001). E, The correlations graphics of DEXA t-scores and T1/ADC values (R = −0.525, P < .0001). F, The correlations graphics of DEXA t-scores and T1/diffusion values (R = −0.654, P < .0001).
Discussion
BMD loss is well recognized in osteoporosis. DEXA is the most commonly used method of BMD evaluation.1–6 Quantitative CT is more sensitive to detect BMD in cortical and subcortical regions, but the excessive amount of radiation exposure limits the usage as a screening method.5 DEXA is a readily available and cheaper technique with low exposure of radiation. Although low bone mass is the major factor in osteoporotic fractures, there may also be qualitative and architectural changes in bone with aging that lead to increased fragility. It has been speculated that the unfilled portions of the vertebrae with decreased BMD are filled with fatty bone marrow.12,13 Histologic studies found similar results.16 With aging, the composition of bone marrow shifts to favor the presence of adipocytes, osteoclast activity increases, and osteoblast function declines, resulting in osteoporosis. Several studies with MR spectroscopy were able to show the increase in fatty bone marrow in patients with osteoporosis.10,12,13,17 It was shown that saturated lipids increase preferentially to unsaturated lipids in fatty bone marrow.17 Schellinger et al12 remarked that bone marrow fat, as a new measure to diagnose reduced bone strength, worked nearly as well as BMD. Our study demonstrated a significant reduction of extracellular diffusion in the osteoporotic group. The decrease in the ADC and diffusion signal-intensity values in the osteopenic and osteoporotic groups might be explained by the reduction of extracellular diffusion as a result of increase in the fatty marrow.14,15 The empty spaces are filled with fatty bone marrow after the architectural deterioration secondary to bone attenuation loss in osteoporosis.
Ward et al18 and Nonomura et al19 were in agreement that ADC values of presumed red (cellular) marrow were higher than those of yellow (fatty) marrow in their studies. Nonomura et al19 further indicated that there was a positive correlation between ADC values and the cellularity of bone marrow. One possible explanation is the perfusion effect. More blood supply and microcirculation are likely when active hemapoietic cells are abundant in the marrow. Therefore, hematopoietically active marrow (cellular marrow) has more intracellular water and adjacent free water than less-active marrow. The conversion of hematopoietic to fatty marrow is known to correlate with a physiologic decrease in intramedullary blood flow.20 Yeung et al14 demonstrated diffusion restriction in patients with osteoporosis, but their study was limited secondary to the small number of subjects. A recent study by Griffith et al10 did not find a significant difference of diffusion restriction among the osteoporotic, osteopenic, and normal bone attenuation groups, but they found a mild positive correlation between vertebral marrow fat content and ADC. They interpreted these findings as an explanation for the decrease in marrow diffusion when marrow fat increase is present.
Several studies demonstrated ADC values from MR diffusion imaging in the differentiation of benign and malignant acute vertebral body compression fractures.8,21–23 It was first described by Baur et al in 1998.24 Thereafter, there were controversies.25 In those studies, the ADC of normal vertebrae was also quite variable. The mean ADC values in normal vertebrae were 1.6622, 0.18,8 0.23,21 and 0.3–0.37.23 One possible explanation of these variable and lower values could be the underlying pathology (malignancy) in normal-appearing neighboring vertebrae. The mean ADC value in our study group was 0.47, and was 0.43 and 0.49 in Yeung et al14 and 0.47 in Ballon et al,26 for healthy subjects. The lower mean ADC values (0.40) in our study for subjects with reduced BMD was in concordance with those in the study of Yeung et al (0.41).14 The difference between ADC and diffusion signal-intensity values of normal, osteopenic, and osteoporotic vertebrae was statistically significant in our study. ADC and diffusion signal-intensity values tended to decrease with reduced BMD. A stronger correlation between diffusion signal-intensity values compared with ADC existed in each group. In our study, there was also a statistically significant relationship between the T1 and T2 signal-intensity values of the normal, osteopenic, and osteoporotic groups. This might be as a result of the increased signal intensity of fatty bone marrow on T1- and T2-weighted images. We believe this is the first report on the quantitative assessment of osteoporosis based on T1, T2, and diffusion signal-intensity values.
Our study was limited due to several factors: The BMD calculated by DEXA might not reflect the real BMD status. DEXA is known to be less sensitive to measure BMD. The study group consisted of both male and female subjects. In 1 study, increased fatty marrow content in male subjects was demonstrated.12 On the contrary, Griffith et al15 showed increased fatty marrow content in women compared with male subjects. Another limiting factor is that we did not standardize the groups according to their body weight and body fat status. This might bring controversies when assessing the T1, T2, and diffusion signal intensities. Instead of measuring T1 and T2 relaxation times, we preferred to use the signal intensities on T1- and T2-weighted images. That is why we were not able to adjust for differences in signal intensity due to differences in the distance of anatomic structures relative to surface coils and shading artifacts. This was one of the major limiting factors of this study. We did not perform patient-level analysis. The BMD of 4 lumbar vertebrae in a given subject would likely be highly correlated. This might be another limitation of our study.
All those ongoing investigations with newly developed technologies clearly demonstrate the multifactorial etiology of osteoporosis. The better understanding of this disease could open up new advances in the treatment modalities, which are currently limited to restoring the bony architecture by calcium supplements and also drugs. Not only treatment but preventive issues might come into consideration. Bone marrow evaluation by quantitative and diffusion MR imaging might be used for better understanding of myeloproliferative disorders of the bone. This might open up a new era in the follow-up of drug therapies and in detecting the disease-free intervals.
Conclusion
As a conclusion, water marrow diffusion is restricted secondary to accumulation of fatty marrow as a result of reduction in bone attenuation. T1 signal intensity increase is well correlated with BMD reduction. T1/diffusion signal-intensity value might be a reliable indicator of osteoporosis. Adding DWI and ADC mapping to a routine lumbar spine work-up could be beneficial. These new MR imaging techniques might have a role in the evaluation of bone marrow changes associated with osteoporosis.
References
- Received February 26, 2007.
- Accepted after revision April 16, 2007.
- Copyright © American Society of Neuroradiology
In this issue


Jump to section
Related Articles
Cited By...
- No citing articles found.