
Abstract
BACKGROUND AND PURPOSE: Hemodynamics is thought to play an important role in the mechanisms of cerebral aneurysm initiation, progression, and rupture. The purpose of this study was to present a hemodynamic study of a cerebral aneurysm immediately before its rupture to assess whether previously identified hemodynamic characteristics would classify this aneurysm in the high-risk category.
MATERIALS AND METHODS: A patient-specific computational fluid dynamics model was constructed from 3D rotational angiographic images acquired just hours before the aneurysm had ruptured. A pulsatile flow simulation was carried out, and the hemodynamics characterized by the concentration of the inflow jet, the size of the flow impingement region, and the complexity and stability of the flow pattern.
RESULTS: We found that the aneurysm had a concentrated inflow jet that impacted onto a small region of the dome of the aneurysm and created a complex, unstable flow pattern.
CONCLUSIONS: This study supports the proposition that hemodynamic characteristics derived from image-based computational models can be used to identify cerebral aneurysms at high risk for rupture.
The mechanisms responsible for the initiation, progression, and rupture of intracranial aneurysms are not well understood. Because current treatment risks can exceed the natural risk for rupture, a better understanding of these processes is required to select only those patients at higher risk.1–3 Although this is a complex, multifactorial problem, hemodynamics is thought to play an important role in these processes.4–6 Previous studies on the basis of patient-specific in vitro and computational models have identified possible associations between different hemodynamic characteristics and the rupture of cerebral aneurysms.7–10 In particular, a previous study by Cebral et al8 showed that unruptured aneurysms tend to have diffuse inflow jets, large areas of flow impaction, and simple stable flow patterns. In contrast, ruptured aneurysms tend to have concentrated inflow jets; small flow impingement regions; and complex, unstable flow patterns. This study, as most previous studies, was performed with the assumption that the hemodynamic characteristics derived from images obtained after aneurysmal rupture are representative of the flow dynamics before the rupture (ie, that the rupture event does not substantially affect the geometric or hemodynamic characteristics used to compare the ruptured and unruptured groups). This study presents a hemodynamic analysis of a cerebral aneurysm from a 3D rotational angiography image obtained just hours before the rupture of the aneurysm and before the patient could be treated. The goal was to assess whether the flow characteristics derived from an image-based computational fluid dynamics model would place this particular aneurysm into the high-risk category for rupture.
Materials and Methods
Imaging
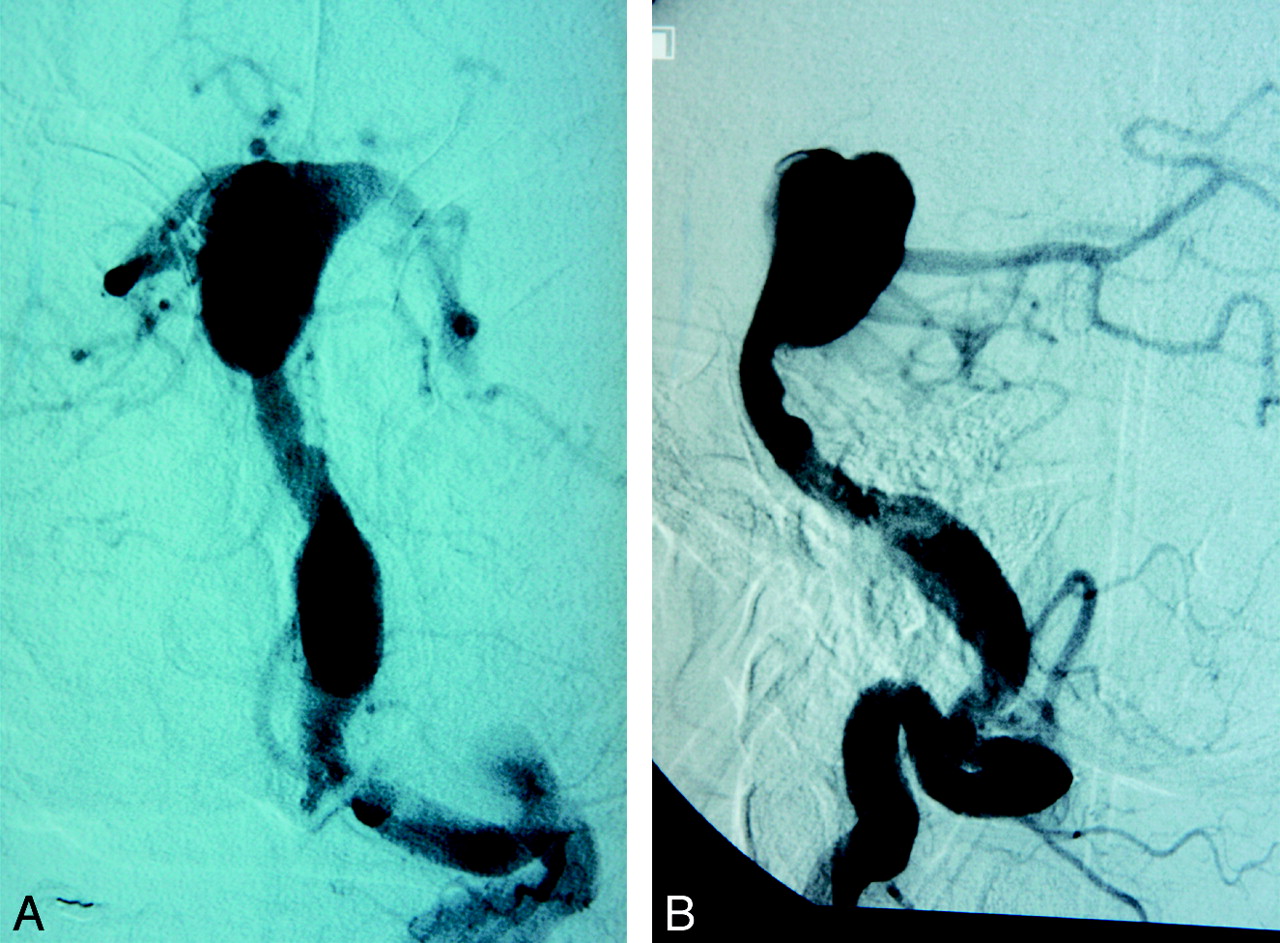
A 40-year-old man with Down syndrome presented with severe headaches. CT imaging showed no evidence of hemorrhage but an enlargement of the basilar artery. The patient had mild hypertension (blood pressure of 140/90 mm Hg). A 21-mm intracranial aneurysm of the basilar artery was imaged with 3D rotational angiography approximately 2 hours before it ruptured. The catheter angiograms were performed by standard transfemoral catheterization of the cerebral vessels and digital subtraction imaging done on an Integris Biplane Unit (Philips Medical Systems, Best, the Netherlands). These images were obtained during a 6-second injection of a contrast agent and a 180° rotation with imaging at 15 frames per second for a total of 8 seconds. The corresponding 120 projection images were reconstructed on a dedicated Phillips workstation into a 3D dataset of 128 × 128 × 128 isotropic voxels covering a field of view of 54.02 mm in all 3 directions. The voxel data were exported into a personal computer for mathematic vascular and hemodynamics modeling. Anteroposterior and lateral digital subtraction angiographies of the aneurysm are shown in Fig 1.

Digital subtraction angiographies of the basilar artery aneurysm before its rupture: anteroposterior (left) and lateral (right) views.
Modeling
We constructed a patient-specific model of the aneurysm from the 3D rotational angiographic image using image-based computational fluid dynamics techniques.11 In brief, the image was smoothed by use of sharpening and blurring operations, then segmented by use of a seeded region–growing algorithm followed by an isosurface deformable model.12 This technique places the vascular model at the vessel boundaries detected in the images, thus achieving subvoxel accuracy, which translates into a geometric error of, at most, 0.422 mm. We then smoothed the anatomic model using a nonshrinking algorithm,13 and vessels were truncated perpendicularly to their axes. An advancing front method was used to generate a finite element mesh composed of tetrahedral elements.14 The generated mesh had a resolution of 0.02 cm and a total of approximately 3 million elements. We modeled the blood flow using the 3D Navier-Stokes equations for an incompressible Newtonian fluid with attenuation ρ = 1.0 g/cm3 and viscosity μ = 0.04 Poise. At the model inlet (basilar artery), pulsatile flow conditions were imposed. Because patient-specific flow conditions were not available, the flow waveform was derived from phase-contrast MR measurements obtained on healthy subjects. This waveform was scaled with the basilar artery cross-sectional area to obtain a mean wall shear stress of 10 dyne/cm2 at the inlet.15 Previous sensitivity analyses showed that although the magnitudes of hemodynamic variables are affected by the inflow rates, the main flow characteristics such as the concentration of the inflow jet, the size and location of the impingement regions, and flow pattern complexity were not fundamentally changed by increasing or decreasing the mean inflow rate.11 Traction-free boundary conditions were prescribed at the outlets. The vessel walls were assumed to be rigid, and no-slip boundary conditions were applied at the walls. We solved the governing equations numerically using an implicit finite element solver.11 We then simulated 2 cardiac cycles using 100 time-steps per cycle and created visualizations of the blood-flow pattern and wall shear stress distribution from the results of the second cycle.
Simulations were constructed to visualize distribution of wall shear stress magnitude, flow streamlines, and velocity magnitudes at peak systole from 3 viewpoints. These visualizations were reviewed and the patterns analyzed to determine zones of flow impaction, size of the associate zone of elevated wall shear stress, and flow pattern according to previously described methods.8
Results
The results of the computational fluid dynamics simulation are presented in Fig 2. This figure shows the 3D rotational angiographic image of the basilar artery aneurysm (top left) and the reconstructed vascular model from 3 different viewpoints (left column). Visualizations of the wall shear stress magnitude, flow streamlines, and velocity magnitudes are shown at peak systole from each of the 3 viewpoints. A mild stenosis (of approximately 50%) can be observed in the basilar artery just proximal to the aneurysm inlet. This stenosis results in acceleration of the blood flow and creates a relatively concentrated inflow jet that impacts on a small region of the body of the aneurysm near the tip of the basilar artery. This jet produces a complex, unstable intra-aneurysmal flow pattern containing several vortical structures that move within the aneurysmal dome during the cardiac cycle. Regions of elevated wall shear stress are observed at the stenosis just proximal of the aneurysmal neck as well as at the flow impingement zone in the aneurysmal dome. The rest of the aneurysmal sac is subject to low wall shear stress forces. It is interesting to note that a small bleb or secondary lobulation can be observed at the high wall shear stress region associated with the impaction of the inflow jet.

Image-based computational fluid dynamics model of a basilar artery aneurysm. Top row: 3D rotational angiographic image, wall shear stress and velocity color-maps, and time instant during the cardiac cycle at which hemodynamic visualizations are presented. Visualizations of the wall shear stress magnitude distribution, intra-aneurysmal flow velocity pattern, and distribution are shown from 3 different viewpoints.
Discussion
Previous studies have identified a few hemodynamic characteristics that are different in ruptured and unruptured aneurysmal groups.8 These include the concentration and stability of the inflow jet, the relative size of the flow impingement region, and the complexity and stability of the intra-aneurysmal flow pattern. This research, along with studies aiming at identifying anatomic characteristics such as aneurysmal size, aspect ratio, or other geometric descriptors as risk factors,16–18 have compared data from unruptured and ruptured aneurysms. Implicit to these studies is the assumption that the shape, size, or hemodynamics are not substantially altered by the rupture event (ie, that the shape, size, or hemodynamic descriptors obtained from image data acquired after the rupture can be used to estimate the aneurysmal characteristics just before its rupture and therefore can be used to assess its rupture risk). This limitation is common to most studies of aneurysmal rupture because unruptured aneurysms are typically treated before they rupture. Thus, it is very difficult to connect the proposed risk indices or characteristics to the eventual rupture of an aneurysm in individual cases. In this study, a rare case of an aneurysm imaged right before its rupture was analyzed to assess whether previously proposed hemodynamic characteristics would place this aneurysm into the high-risk category.
The computational hemodynamic modeling of this aneurysm a few hours before rupture showed a concentrated inflow jet with a small impaction zone and complex, unstable flow pattern. This combination has been found to be most common among previously ruptured aneurysms in a population-based study of patient-specific hemodynamics. The patient's clinical course was consistent with the analysis of the hemodynamic simulations, which assign a high risk for rupture to conditions in which there is a concentrated impaction zone.
The computational simulation also shows the difficulty by use of these simulations to distinguish between mechanisms of aneurysmal rupture. Although we have chosen to focus on the flow structures involving the inflow jet, most of the aneurysm wall is actually under low wall shear. Determining which of these 2 flow environments is ultimately responsible for the aneurysmal rupture does not seem possible without the knowledge of the ultimate site of wall failure. It is unfortunate that no pathologic information was available from this case to help clarify this issue. However, the observation of the daughter lobulation and its relationship to the inflow jet yields an interesting point. Daughter lobulations are thought to be the consequence of a focal weakening of the aneurysmal wall and the resulting remodeling under the influence of hemodynamic and structural forces. Its location adjacent to the relatively high flow and high wall shear environment within this aneurysm suggest that, in this case, the focused flow effects from the proximal stenosis may be responsible for some structural damage to this aneurysm. Of course, care must exercised in drawing conclusions from a single case.
The current simulations suffered several limitations that should be considered when the data are evaluated. As with all simulations of this type, assumptions are used that may not fully represent the patient's native hemodynamics. The geometry is approximated from the 3D rotational data obtained at angiography. The flow conditions in this case were not available and had to be estimated on the basis of healthy subjects and scaled to the patient's specific anatomy. The walls were considered rigid, outflow conditions were approximated, and non-Newtonian effects were not considered. The effects of the perianeurysmal environment and fluid structural interactions were not simulated.
Conclusions
This case study of an intracranial aneurysm imaged just before its rupture is consistent with previous studies linking concentrated inflow jets that impact onto a small region of the aneurysm and produce complex, unstable intra-aneurysmal flow patterns with increased risk for rupture. This study also highlights the possibility of image-based, patient-specific computational models being used for risk assessment of aneurysms.
Footnotes
The authors thank Philips Medical Systems for financial support. S.H. was supported by the National Science Foundation Computational Science for Undergraduates in the Mathematical Sciences Program.
References
- Received June 3, 2008.
- Accepted after revision July 28, 2008.
- Copyright © American Society of Neuroradiology
In this issue


Jump to section
Related Articles
Cited By...
- Hemodynamic characteristics of large unruptured internal carotid artery aneurysms prior to rupture: a case control study
- Quantitative comparison of hemodynamic parameters from steady and transient CFD simulations in cerebral aneurysms with focus on the aneurysm ostium
- Computational fluid dynamics simulation of an anterior communicating artery ruptured during angiography
- Analysis of Morphologic and Hemodynamic Parameters for Unruptured Posterior Communicating Artery Aneurysms with Oculomotor Nerve Palsy
- Quantification of speed-up and accuracy of multi-CPU computational flow dynamics simulations of hemodynamics in a posterior communicating artery aneurysm of complex geometry
- Computational fluid dynamics simulation of an anterior communicating artery ruptured during angiography
- Patient-Specific Computational Hemodynamics of Intracranial Aneurysms from 3D Rotational Angiography and CT Angiography: An In Vivo Reproducibility Study
- Association of Hemodynamic Characteristics and Cerebral Aneurysm Rupture
- Blood-Flow Characteristics in a Terminal Basilar Tip Aneurysm Prior to Its Fatal Rupture
- An objective approach to digital removal of saccular aneurysms: technique and applications