
Abstract
BACKGROUND AND PURPOSE: Significant extracranial stenosis of the ICA is a known risk factor for future stroke and it has been shown that revascularization reduces the risk of future stroke. We applied BOLD fMRI in patients with carotid artery stenosis before and after CEA. Our purpose was to determine whether fMRI is able to demonstrate impaired CVR and to identify patient parameters that are associated with postoperative changes of cerebral hemodynamics.
MATERIALS AND METHODS: Nineteen consecutive patients with symptomatic (n = 13) and asymptomatic (n = 6) stenosis of the ICA were prospectively recruited (male/female ratio = 16:3; age, 69 ± 8,1 years). fMRI using a simple bilateral motor task was performed immediately before and after CEA.
RESULTS: Mean BOLD MSC was significantly increased postoperatively (MSC, 0.13 ± 0.66; P = 0.0002). Patients with a stenosis of <80% demonstrated an increase in MSC (MSC, 0.32 ± 0.59; P ≤ .0001). Patients with previous ischemic stroke showed a larger MSC than patients with TIAs (stroke: MSC, 0.55 ± 0.65; P ≤ .0001; TIA: MSC, 0.05 ± 0.26; P = 0.054). Patients older than 70 years had a significantly larger MSC following surgery (≤70 years: MSC, −0.01 ± 0.39; P = .429; >70 years: MSC, 0.29 ± 0.48; P ≤ .0001).
CONCLUSIONS: BOLD fMRI can demonstrate changes in cerebral hemodynamics before and after CEA, indicative of an ameliorated CVR. This response is dependent on the age of the patient, the degree of preoperative stenosis, and the patient's symptoms.
Abbreviations
- AF
- amaurosis fugax
- asymp
- asymptomatic
- BOLD
- blood oxygen level–dependent
- CBF
- cerebral blood flow
- CBV
- cerebral blood volume
- CEA
- carotid endarterectomy
- CO2
- carbon dioxide
- CPP
- cerebral perfusion pressure
- CVR
- cerebrovascular reactivity
- DWI
- diffusion-weighed imaging
- FLAIR
- fluid-attenuated inversion recovery
- fMRI
- functional MR imaging
- ICA
- internal carotid artery
- MRI
- MR imaging
- MSC
- mean SC
- N/A
- not applicable
- Pre
- before
- Post
- after
- SC
- signal-intensity change
- symp
- symptomatic
- T2WI
- T2-weighted imaging
- TIA
- transient ischemic attack
Severe stenosis of the ICA is a known risk factor for future ipsilateral stroke, TIAs or amaurosis fugax due to embolic events, and, less likely, a reduction in CBF,1 which may go along with a reduction in CPP. This CPP reduction, in turn, leads to different autoregulatory compensation mechanisms to avoid cerebral ischemia, such as changes in CBV, mean vascular transit time, CBF, oxygen extraction fraction, and cerebral rate for oxygen metabolism. Due to these mechanisms, the CVR may be impaired in patients with ICA stenosis.2 Most important for the degree of CVR impairment in patients with steno-occlusive ICA disease is the degree of stenosis and recent stroke events.3,4 Both conditions lead to a reduction in oxygen supply of circumscribed brain tissue with a concomitant initial increase in CO2, acid metabolites, and nitric oxide.5 The resulting vasodilation and the changes in CBF and CBV can be attributed to autoregulatory compensation mechanisms.6
These autoregulation mechanisms can, at least in part, be assessed by fMRI techniques by using the BOLD effect because these techniques detect the physiologic regulation of the cerebral microvasculature during brain activation.7,8 By augmenting CBF and CBV, oxygen supply increases over its initial value and the amount of CO2 decreases. This phenomenon can be detected indirectly by BOLD fMRI, which uses changes in the hemoglobin to deoxyhemoglobin concentrations in the blood is a physiologic contrast agent.9
However, this physiologic regulatory mechanism during brain activation may be impaired in patients with ICA stenosis due to the pre-existing changes in microvasculature described above, resulting in diminished or even a negative BOLD SC in fMRI.10 In proximal high-grade stenoses, intracranial arteries may already be maximally dilated to compensate for the decreased inflow. Further dilation of these vessels during increased oxygen demands may not be possible; therefore, BOLD changes may be reduced in patients with severe extracranial stenoses.
It has been shown that CEA is beneficial for patients with ICA stenosis or occlusion: The removal of the atheromatous plaque not only reduces the risk for embolic events but also ameliorates cerebral hemodynamics and CVR.11–13
The aim of this study was to determine whether BOLD fMRI can demonstrate impaired CVR during a bimanual motor task and detect postoperative improvement or restoration of an impaired BOLD response. Using subgroup analyses, we tried to elucidate whether factors such as symptoms of the ICA stenosis, age, or degree of stenosis modulate the degree of postoperative BOLD MR imaging response by using the hemisphere supplied by the ICA that did not undergo surgery as a control.
Materials and Methods
Patients
Between May 2007 and April 2008, 21 consecutive patients (4 women, 17 men; median age, 69 ± 8.1 years) with stenosis of an ICA were prospectively included in this study and examined by using fMRI. The study was approved by the local ethics committee. All patients gave their written informed consent. Two patients were excluded due to poor image quality resulting from severe and incorrectible motion artifacts. The degree of stenosis was assessed according to the North American Symptomatic Carotid Endarterectomy Trial criteria14,15 and was determined by contrast-enhanced MR angiography in all patients. Clinically, 13 of 19 patients presented with symptomatic ICA stenosis. Symptoms preceded the test by 5–28 days (mean, 12 days). For further demographic data, see Table 1.
Patient demographic data and BOLD signal gain and change for percentage ICA stenosis
MR Imaging Protocol
MR imaging was performed 1 or 2 days before and 2–3 days after CEA on a 3T scanner (Intera; Philips Healthcare, Best, the Netherlands) by using an 8-channel combined head-neck coil. BOLD images were acquired with a single-shot echo-planar imaging sequence.16 Thirty-one sections were acquired in the transversal plane oriented to the anterior/posterior commissure line. TR was 2800 ms; TE, 30 ms; flip angle, 90°; matrix size, 64 × 64; FOV, 240 × 240 mm; section thickness, 3.5 mm; gap, 0.5 mm; and voxel size, 3.75 × 3.75 × 3.5 mm. A total of 88 dynamics were acquired. For anatomic reference, a sagittal T1-weighted sequence encompassing 180 sections was obtained with an FOV of 256 × 256 mm, TR of 9.9 ms, TE of 4.6 ms, and voxel size of 1 × 1 × 1 mm.
To assess structural brain tissue changes, we obtained standard axial T2 FLAIR and DWI scans. To assess the degree of stenosis and to exclude other vascular pathologies, we performed a 3D contrast-enhanced MR angiography preoperatively. Following surgery, duplex sonography was performed 1–3 days after CEA.
fMRI Paradigm
Patients were asked to perform a simple bimanual finger-tapping exercise in a block design with 4 blocks of activation preceded by 4 resting states. Each activation block lasted for a period of 11 dynamics. The start and stop signal intensity was given via headphones. The time between motor performances was set as a resting condition and, therefore, as the baseline. This paradigm was accomplished before and after surgery (CEA). Patients were briefed to perform the exercise both times with the same intensity, frequency, and amplitude and were tested outside the scanner during which the frequency was recorded by the examiner. The examination was always run with the same protocol on the same scanner.
Data Analysis and Preprocessing
Data were preprocessed with Brain Voyager QX, Version 1.8 (Brain Innovation, Maastricht, the Netherlands) using mean-intensity adjustment, section scanning-time correction (sinc interpolation), 3D motion correction (trilinear interpolation), and temporal filtering (high-pass filter). Anatomic T1-weighted data were transformed into Talairach coordinates.17 Functional data were coregistered to each individual's T1-weighted 3D MR image volume.
Task-activated voxels for each individual voxel were identified by constructing a general linear model with 1 regressor for the task (finger tapping) and an implicit baseline. The activation period was compared with the baseline by using event-related averaging. The mean MR imaging signal intensity of the preceding resting state was calculated, and the percentage deviation of each fMRI volume during activation from this resting state value was calculated and averaged for the 4 subsequent activation blocks. The first 2 dynamic scans of the resting period after each activation period were not included in the baseline value to allow the BOLD MR imaging signal intensity to reach its baseline. The MSC between the presurgical and the postsurgical scans was calculated as the numeric differences between the thus-established pre- and postsurgical BOLD MR imaging SCs. One region of interest each was defined for the left and right motor cortex, representing the hand area by using individual anatomic landmarks to determine the central sulcus with its putative hand and finger motor representation (defined as the Ω-shaped knob of the central sulcus18) for each patient individually. The activation pattern (BOLD time-series) of these 2 regions of interest was analyzed for each patient separately. Regions of interest during the pre- and postsurgical investigation were identical for each patient. Cluster threshold was set to 50 voxels, and a threshold value of P < .005.
Data acquired in Brain Voyager were exported to the Statistical Package for the Social Sciences, Version 15.0 (SPSS, Chicago, Illinois) for paired t test statistics.
Patients were divided in subgroups according to degree of stenosis, age, and symptoms (symptomatic-versus-asymptomatic patients).
In addition, a subanalysis of the BOLD signal-intensity time course was made for these 3 groups separately to define whether significant differences of the pre- and postoperative scans were present after the initial rise in MR imaging signal intensity (ie, within the period of sustained activity).
To determine whether the investigated variables were dependent on each other, we performed a multiple linear regression analysis to examine whether age, degree of stenosis, and the presenting clinical symptoms were correlated with each other.
Pre- and postoperative anatomic data from the T2 FLAIR and DWI sequences were evaluated by an experienced neuroradiologist (T.K.).
Results
Postoperatively, no new ischemic lesions were detected on DWI. In no patient did postsurgical Doppler and duplex sonography of the ICA having undergone surgery reveal a postoperative stenosis.
A significant increase in BOLD SC in the primary motor cortex of the hemisphere supplied by the ICA that underwent surgery was noted in the group of 19 patients as a whole (MSC, 0.13% ± 0.66, P = .0002) (Fig 1), while there was no significant change noted in the contralateral hemisphere. The following subset analyses of the dependency of the postoperative increase in MR imaging SC were performed to further evaluate which factors were related to the degree of MR imaging signal-intensity increase: 1) degree of stenosis, 2) age, and 3) symptomatic-versus-asymptomatic patients (Table 2).
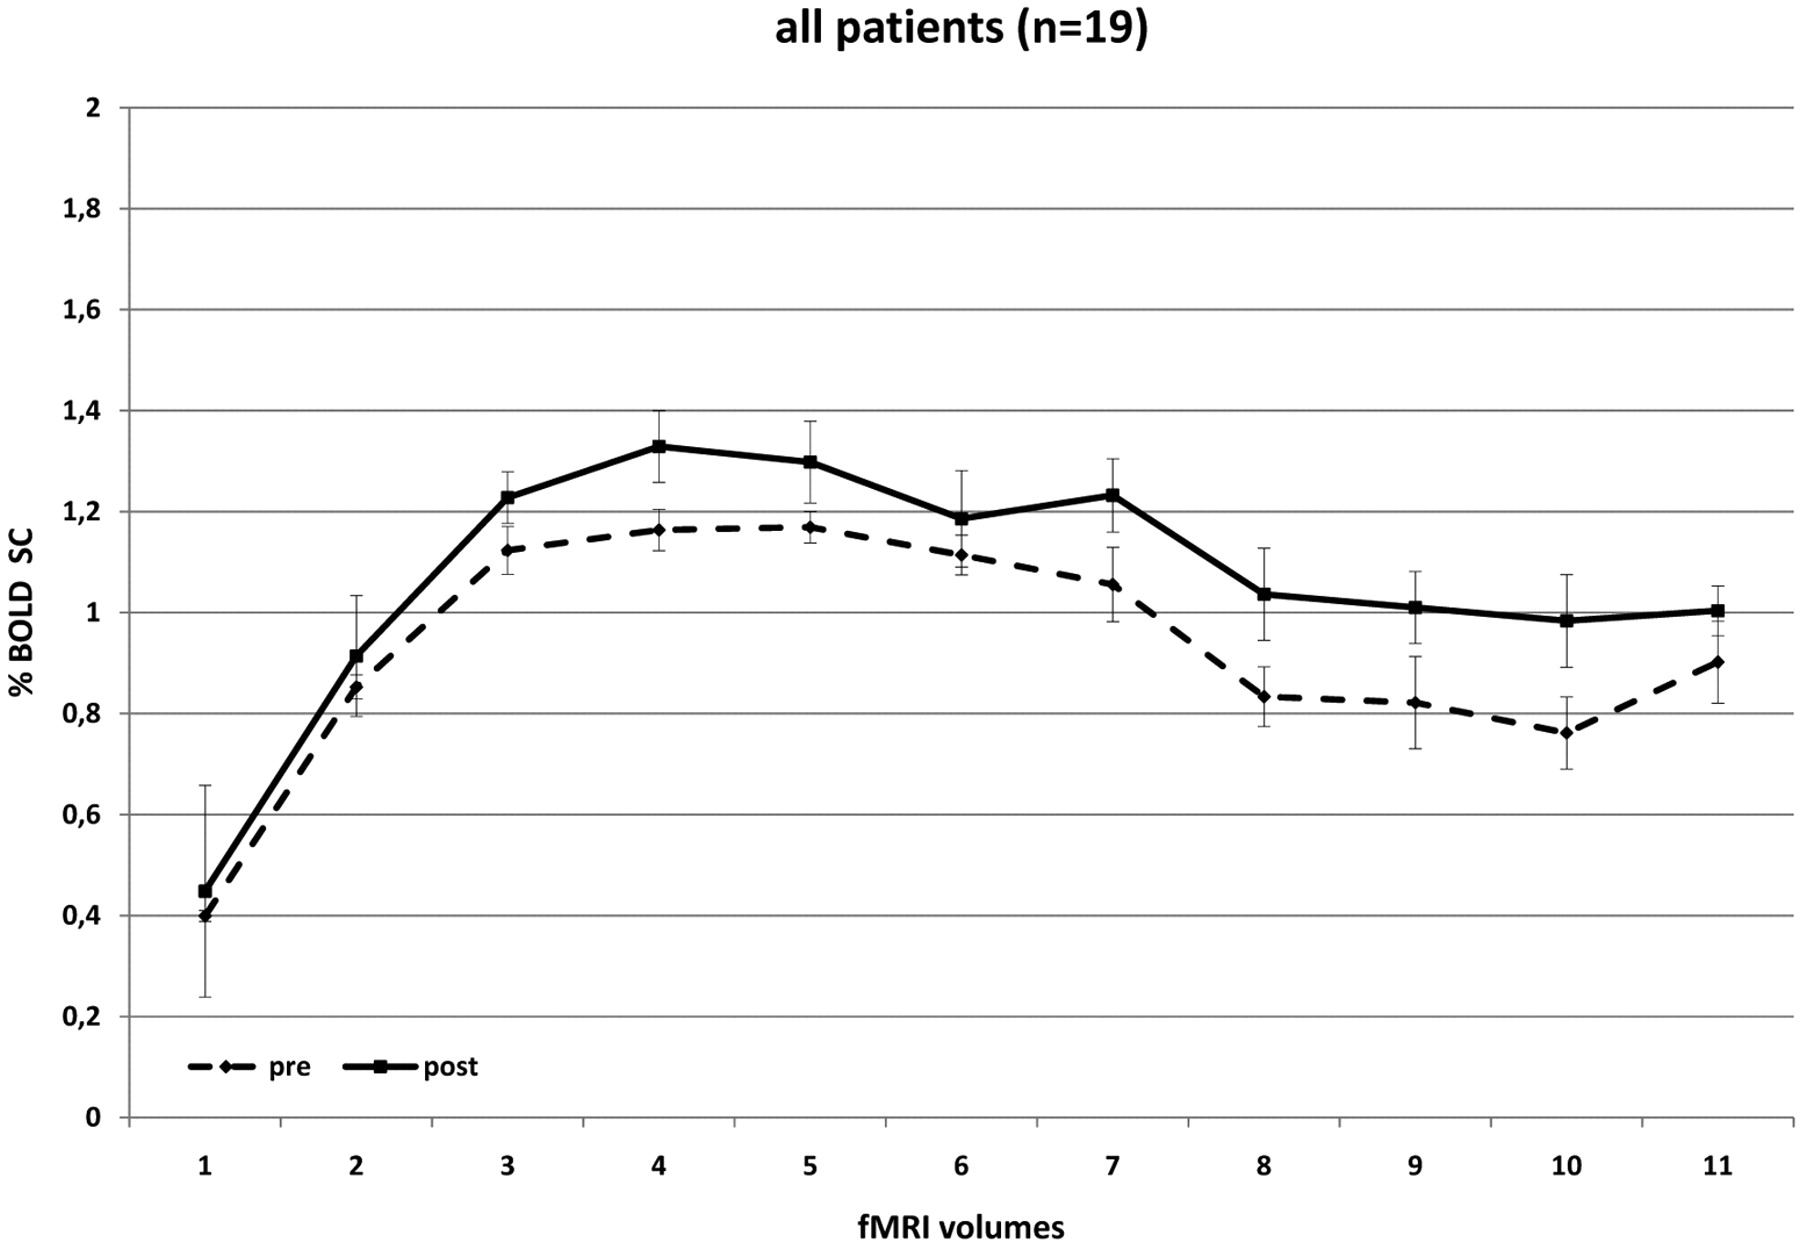
BOLD SCs in all patients before and after CEA. There is a significant increase in BOLD SC after revascularization, testifying to an ameliorated cerebrovascular reactivity.
Mean BOLD SCs in all patient groups
Degree of Stenosis
Patients were separated into 4 subgroups according to their degree of stenosis (≤70%, n=5; ≤80%, n=4; ≤90%, n=7; ≤99%, n=3). Patients with a stenosis of ≤70% presented with a significant total increase of BOLD signal intensity after CEA (MSC, 0.31 ± 0.66; P=.001). Likewise, patients with a degree of stenosis of 70%–80% presented with a significant increase in BOLD SC after surgery (MSC, 0.34 ± 0.50; P ≤ .0001). However, we could not find a significant increase in postoperative BOLD signal intensity in patients with a degree of stenosis >80%: The subgroup of patients with a stenosis of 80%–90% presented with a BOLD SC of −0.01 ± 0.39, which was not significant, and patients with a stenosis ranging from 90% to 100% were found to have an even more pronounced signal-intensity decrease after CEA (−0.11 ± 0.50) (Fig 2). When comparing the BOLD signal-intensity decline during the sustained activity of 31 seconds, we noted similar slopes both pre- and postoperatively and no effect of the degree of stenosis concerning a persisting increase of MR imaging BOLD signal intensity during the observed time period.

Pre- and postoperative BOLD signal-intensity curves of patients with ICA stenosis of ≤70% (A); ≤80% (B), ≤90% (C), and ≤99% (D). Dashed lines demonstrate the preoperative and solid lines, the postoperative data. There are significant differences in pre- and postoperative curves in A and B (low-grade stenoses), and no significant increase in BOLD SC in C and D (high-grade stenoses).
Symptomatic versus Asymptomatic Patients
Preoperatively, asymptomatic patients (n = 6) presented with a larger BOLD SC than symptomatic patients (n = 13) (MSC, 0.12 ± 0.43; P ≤ .0001). Postoperatively, we saw a reverse effect. Symptomatic patients presented with a larger increase in BOLD SC than asymptomatic patients (MSC, 0.35 ± 0.55; P ≤ .0001) (Fig 3).

BOLD signal-intensity curves of symptomatic (solid line) and asymptomatic (dashed line) patients demonstrates that symptomatic patients have a lower degree of activation than asymptomatic patients preoperatively. Postoperatively, their BOLD signal-intensity curve exceeds that of asymptomatic patients.
When further subdividing the group of symptomatic patients into those who had a recent stroke (n = 7) and those who presented with TIA only (n = 6), we found the following: Patients who had a recent stroke presented with a highly significant postoperative increase in BOLD SC (MSC, 0.55 ± 0.65; P ≤ .0001), whereas patients with TIA demonstrated an MSC of only 0.05 ± 0.26 (P = .054). Patients who were asymptomatic had a postsurgical decrease in their MSC of −0.19 ± 0.35, which was significant with P ≤ .0001 (Figs 3 and 4). Slopes of signal intensity that rise and decline with time (sustained BOLD increase for 31 seconds) were similar pre- and postoperatively in the 3 groups.

BOLD signal-intensity curves of patients with minor (A) and severe (B) symptoms of ICA stenosis. Preoperative BOLD SCs are similar in both patient groups. Postoperative changes in BOLD signal intensity are stronger in patients with previous stroke compared with patients with previous TIA.
Age
The BOLD signal-intensity-curve changes of patients younger than 70 years (n = 10) were compared with those in patients who were older than 70 years (n = 9). Younger patients presented with no significant changes in BOLD signal intensity postoperatively compared with preoperatively (MSC, −0.01 ± 0.56; P = .429). However, we could find a significant increase in BOLD SC in patients older than 70 years (MSC, 0.29 ± 0.48; P ≤ .0001) (Fig 5). In this subanalysis, there was a nonsignificant (P = .09) trend toward a longer sustained activation following revascularization; while the signal-intensity rise in the first 15 seconds following activation was similar before and after surgery, time points during the second half of activation demonstrated a higher mean SC (0.27 ± 0.5 versus 0.41 ± 0.45) following surgery, indicating that, postoperatively, the increase in BOLD MR imaging signal intensity could be sustained for a longer time.

Comparison of BOLD signal-intensity curves in patients who are younger (A) and older (B) than 70 years. In contrast to younger patients, older patients present with a significant benefit of CEA and the degree of signal-intensity drop following sustained activity is less pronounced.
For the multiple linear regression analysis, we used a stepwise analysis strategy. The presenting clinical symptoms were the single best predictor (correlation with percentage SC, R = 0.590, P = .008). The adjusted R2 = 0.310 and the predictor accounted for an adjusted coefficient of determination of R2adj = 0.590. When we included all 3 predictor variables in the multiple regression, there was no substantial increase in R = 0.609 (R2adj = 0.371).
Discussion
fMRI with BOLD contrast was used to assess hemodynamic changes following revascularization in patients with extracranial carotid artery stenosis. We could demonstrate a significant overall increase in BOLD SC in the whole group when comparing pre- and postoperative fMRI mean SCs indicating amelioration of CVR following revascularization. These findings correspond to a recent fMRI study in 24 patients with symptomatic high-grade ICA stenosis in whom either a stent-placement procedure or surgery was performed to revascularize the dependent territory.19 These authors were able to show that a reduced cerebrovascular reserve capacity (as indirectly measured by CO2 BOLD fMRI) was present before revascularization and that following the procedure, initial reductions in CVR normalized. Similar findings have been reported by Jensen et al,20 who showed that in patients with unilateral ICA stenosis, BOLD signal-intensity differences between both hemispheres ameliorate after recanalization. Moreover, they compared patients with hemodynamic significant and nonsignificant stenoses. The latter presented with significantly lower BOLD signal-intensity differences between both cerebral hemispheres. In addition, Wilkinson et al21 found, by using first-pass gadolinium-enhanced perfusion MR imaging, that there is an increase in the perfusion of the revascularized hemisphere. They found that directly following the intervention, the formerly prolonged transit time remained slightly prolonged; however, the interhemispheric asymmetry had declined significantly. Most interesting, the CBV was not affected as much as the CBF, indicating that revascularization affects the blood volume less than the flow. Prabhakaran et al22 saw a diminished BOLD effect in those cortical regions that were hypoperfused when correlating perfusion data with BOLD imaging, despite the persistence of regional function. These authors concluded that vascular reactivity was impaired in hypoperfused brain regions.
Although the possibility that hypoperfusion may lead to the redistribution of cortical networks cannot be ruled out,23 the demonstration of the reversible nature of the activation pattern following elimination of the hemodynamic compromise24,25 suggests that restoration of the cerebrovascular reactivity is a cause of postsurgical increased BOLD activation. Carusone et al26 validated these assumptions by using transcranial Doppler sonography to demonstrate that a diminished vascular reserve was related to an alteration in the BOLD hemodynamic response. Our findings of a significant overall increase in BOLD MR imaging signal intensity following revascularization confirm these studies; however, in the aforementioned articles, further subset analyses of dependency of the BOLD MR imaging SC were not made. We were also able to show that changes in postoperative BOLD signal-intensity increase are modulated by the degree of preoperative stenosis, the appearance of symptoms related to ICA stenosis, and the patient's age.
Degree of Stenosis
In our patient group, those with a stenosis of <80% presented with a significant increase in MSC following surgery compared with patients with a higher degree of stenosis. Although it has been demonstrated that CBF increases during brain activation and even exceeds the values achieved before CEA in patients with ICA steno-occlusive disease,3,27 this effect could not be found in patients with a stenosis level of ≥90%. This seemingly paradoxic result may be due to patients with high-grade ICA stenosis (≥90%) having a reduced CPP, which stimulates cerebral autoregulation and leads to a vasodilation with concomitant CBF increase under the resting state. Under these circumstances, brain activation cannot provoke further changes in vessel diameter or CBF. Cerebral perfusion adjusts to the new hemodynamic conditions postoperatively only in a delayed fashion. Therefore, the BOLD signal-intensity-curve progression and the maximum BOLD signal-intensity values do not alter significantly within the rather short observational period 2 days following surgery.28 Furthermore, patients with a higher degree of stenosis have a more severe atherosclerosis that is not only macroangiopathic but may also be microangiopathic in nature. This small-vessel disease may then additionally reduce the capability of an adequate hemodynamic response to brain activation.29
A third potential explanation may be derived from the study of Ko et al, 30 who demonstrated that the increase in relative CBF after revascularization does not correlate with the degree of ipsilateral stenosis. These authors argued that the degree of stenosis may not be the main and, thereby, most adequate indicator of CBF impairment but that other factors like collateral flow patterns, hypertension, stroke, degree of contralateral and vertebral artery stenosis, and clotting abnormalities also have a high influence on CBF changes. We presume that BOLD SCs are highly dependent on the local regional blood distribution pattern and that, therefore, factors such as microangiopathy and collateral flow (which, in fact, may be better developed in high-grade stenoses) play the major role in the BOLD MR imaging SCs.
Symptomatic versus Asymptomatic Patients
Our data indicate that the presenting clinical symptom was the single best predictor for the subsequent changes in BOLD MR imaging SC following surgery: Symptomatic patients with ICA stenoses present with a higher compromise in cerebral hemodynamics than asymptomatic patients because the former have a higher percentage MR imaging SC following CEA. Furthermore, we could show that patients who had recent stroke presented with a larger effect on BOLD signal intensity following CEA compared with patients who had a TIA.
This finding may be explained by the pathophysiologic processes following ischemic stroke.
Oxygen depletion induces anaerobic glycolysis, with concomitant vasodilation as described above, leading to depletion of cellular adenosine triphosphate, intracellular acidification, and generation of reactive oxygen species.6 These metabolites are mainly responsible for cell damage and cell necrosis,31 which influences cerebral hemodynamics and BOLD SCs. Poststenotic brain regions are likely to present with altered blood-flow characteristics and, therefore, a reduced vascular reactivity due to poststenotic compensatory vasodilation.8 After CEA, CBF and oxygen supply increase to normal values, which leads to an amelioration of the metabolic surroundings13,32 and an almost adequate cerebral autoregulation and brain activation. Therefore, BOLD SCs following surgery are more intense in patients with stroke compared with patients with TIA, in whom the cerebral autoregulation is not maximized before the surgery, indicating a reduced capability of graded autoregulatory response to brain activation.
A remarkable finding is the decrease in BOLD SCs in asymptomatic patients after CEA. A decrease in BOLD MR imaging signal intensity is present if oxygen delivery is reduced compared with oxygen consumption or if blood flow to the brain is decreased. Because oxygen consumption has to be considered constant and the flow to the hemisphere has been increased, a potential explanation for this finding is a decrease in the local blood flow compared with the global blood flow. An alternative explanation is that asymptomatic patients present with an adequate BOLD signal-intensity response before surgery due to well-developed compensatory mechanisms. Because, after CEA, the CBV may be higher, the CBF may be downregulated, leading to less intense CBF-related BOLD MR imaging SCs. A maladaptive regional adjustment to the comparatively higher amount of blood supplying the brain may also result in a lower increase in BOLD SC.
Age
Our results suggest that patients older than 70 years present with a stronger BOLD SC after CEA than younger patients. We assume that older patients may have a more extended microangiopathy, which affects cerebral hemodynamic autoregulation. Hesselmann et al33 showed that BOLD SCs during a motor-stimulation task decrease with age in healthy volunteers. By increasing the diameter of the ICA, the blood flow, therefore, increases. Due to the reduced autoregulatory capacity, BOLD SCs are, therefore, more pronounced in older than in younger patients because flow increases the BOLD MR imaging signal intensity. This assumption is further underlined by our observation that elderly patients have a nonsignificant trend toward a more prolonged MR imaging signal-intensity increase following revascularization, which indicates an ameliorated flow with a decreased autoregulatory capacity.
Limitations
The BOLD signal intensity is dependent on a wide variety of physiologic and pathologic conditions, which are not fully understood. In addition, the blood flow and volume are complex entities that are influenced by the status of the asymptomatic ICA, the vascular connectivity in the circle of Willis, the degree of microangiopathic changes, the extent of previous embolic or hypoperfusion events, and the individual time needed for normalization of regional CBF, all of which are factors that we were unable to control in this study. Furthermore, there are controversial results in the literature concerning the time for normalization of ipsilateral CBF after revascularization. Some authors report its achievement after 3 hours,21 others report 2–6 months.3,34 These multiple influencing factors and the relatively small sample size, especially in the subgroup analyses, as well as subtle differences in performance pre- and postsurgically, may also explain the relatively high SDs in our patient group. A more direct way to measure CVR is via breathing an enriched CO2 gas, which will allow a more controlled and standardized measurement of the CVR in patients irrespective of their task performance.35 Additionally, because we have not used a CBF-based fMRI like arterial spin-labeling, we can only indirectly quantify the results concerning blood flow. Perfusion-weighted MR imaging in conjunction with the described method would be an interesting tool to further evaluate the complex hemodynamic changes following revascularization.
Footnotes
-
Indicates Editor's Choices selection
-


References
- Received March 10, 2010.
- Accepted after revision May 24, 2010.
- Copyright © American Society of Neuroradiology


