
Abstract
BACKGROUND AND PURPOSE: Calcium can potentially shorten T1, generating high signal intensity in GREs. Because IPH appears as high signal intensity in MRIPH and the surface effects of calcium can potentially shorten T1 of surrounding water protons, the purpose of this study was to evaluate whether the high signal intensity seen on MRIPH could be attributed solely to IPH and not calcification.
MATERIALS AND METHODS: Eleven patients undergoing carotid endarterectomy were imaged by using MRIPH. Calcification was assessed by scanning respective endarterectomy specimens with a tabletop MicroCT. MRIPH/MicroCT correlation used an 8-segment template. Two readers evaluated images from both modalities. Agreement between MRIPH/MicroCT was measured by calculating Cohen κ.
RESULTS: High signal intensity was seen in 58.8% and 68.9% (readers 1 and 2, respectively) of MRIPH segments, whereas calcification was seen in 44.7% and 32.1% (readers 1 and 2, respectively) of MicroCT segments. High signal intensity seen by MRIPH showed very good but inverse agreement to calcification (κ = −0.90; P < .0001, 95% CI, −0.93 to −0.86, reader 1; and κ = −0.74; P < .0001; 95% CI, −0.81 to −0.69, reader 2). Most interesting, high signal intensity demonstrated excellent agreement with lack of calcification on MicroCT (κ = 0.92; P < .0001; 95% CI, 0.89–0.94, reader 1; and κ = 0.97; P < .0001; 95% CI, 0.96–0.99, reader 2). In a very small number of segments, high signal intensity was seen in MRIPH, and calcification was seen on MicroCT; however, these represented a very small proportion of segments with high signal intensity (5.9% and 1.6%, readers 1 and 2, respectively).
CONCLUSIONS: High signal intensity, therefore, reliably identified IPH, known to describe complicated plaque, rather than calcification, which is increasingly recognized as identifying more stable vascular disease.
Abbreviations
- AHA
- American Heart Association
- CI
- confidence interval
- FSE
- fast spin-echo
- GRE
- gradient-recalled echo
- IPH
- intraplaque hemorrhage
- MRIPH
- MR imaging of intraplaque hemorrhage
Recent advances in MR imaging have made it an emerging technique for atherosclerotic plaques.1–4 With the advent of high-resolution MR imaging, the characterization of carotid plaques is possible, allowing the imaging of individual plaque components, including fibrous tissues, lipids, hemorrhage, and calcification.5–9
According to the AHA histologic classification of atherosclerotic plaques, a plaque with evidence of surface erosion, hemorrhage, and/or thrombosis is type VI, the so-called complicated plaque.10,11 For decades, IPH has been thought to play a role in the progression of atherosclerosis.12–15 However, recent studies have clarified its importance.16 The rapid and excessive accumulation of red blood cells in the plaque promotes lipid deposition and enlargement of the necrotic core, which is believed to be a pro-atherogenic stimulus.16 In coronary plaques, Kolodgie et al16 demonstrated that hemorrhage is a critical step in promoting instability of advanced coronary lesions.
The risk of rupture of carotid plaques appears to be dependent on the degree of calcification. As calcifications coalesce, the risk of rupture decreases.17 Therefore, while IPH has been shown to increase risk,10,11 a high degree of calcification in the plaque promotes stability.17,18 For this reason, distinction between these 2 components is crucial.
By its lack of water protons, calcified tissue normally does not produce MR imaging signal intensity.19 A few studies have reported calcium compounds shortening T1 times under specific MR imaging parameters, resulting in high signal intensity in T1-weighted spin-echo20,21 and gradient-echo sequences.20–23 Henkelman et al20 and Henkelman and Kucharczyk22 optimized spin-echo and GRE sequences to detect calcium (hydroxyapatite samples, normally found in vascular calcifications). They found that 3 factors affected the signal intensity of calcium in T1-weighted imaging: decreased proton attenuation and T2 shortening (both resulting in decreased signal intensity) and T1 shortening (resulting in increased signal intensity). High signal intensity was only seen if the T1 shortening effects overcame the proton attenuation/T2 shortening effects. Also, T1 shortening was found to be dependent on hydroxyapatite concentration, with the signal intensity decreasing as hydroxyapatite concentration increased beyond 30%–40% of the weight of the tissue (because the proton attenuation/T2 effects dominate the T1 shortening effects).
Cappendjik et al24 compared 3D high-resolution GRE and 3D high-resolution FSE sequences for imaging intraplaque hemorrhage. They found that calcification produced some false-positives (high signal intensity) in a very few cases, however, these were seen in FSE and not GRE sequences.
MRIPH is a high-resolution technique that visualizes hemorrhage in complicated atherosclerotic plaques as high signal intensity by exploiting the T1 shortening effects of methemoglobin.5 Because IPH appears as high signal intensity in GRE-based sequences and calcium also has the potential to appear bright, the purpose of this study was to evaluate whether the high signal intensity seen on MRIPH is attributable to calcification.
Materials and Methods
This study received approval by the institutional research ethics board of the hospital. Informed consent was obtained from the patients for this prospective study.
Patient Population
Patients undergoing carotid endarterectomy for symptomatic (transient ischemic attacks, amaurosis fugax, cerebral infarction) or asymptomatic carotid artery stenosis were included in this study.
MR Imaging of IPH Sequences
Patients were scanned as previously described.5 Briefly, MRIPH used a 3D T1-weighted fat-suppressed spoiled gradient-echo sequence, by using a 1.5T MR imaging scanner (TwinSpeed Excite; GE Healthcare, Milwaukee, Wisconsin) and a 6-channel carotid phased-array coil (ScanMed, Middle Grove, New York). The scanning parameters were the following: TR, 11.2 ms; TE, 3.3 ms; flip angle, 15°; 1-mm thickness; FOV, 80 × 80 mm; matrix size, 160 × 160; effective voxel size, 500 μm × 500 μm × 1 mm (interpolated to 500 μm in the z-axis); NEX, 2; receiver bandwidth, 31.2 kHz. The coverage of the carotid artery was, therefore, 80 mm. The 3D volume was acquired in the sagittal plane, and 26 sections were obtained. No-phase wrap was used to overcome image wraparound. Fat suppression was achieved by using Spectral Inversion at Lipids, a proprietary technique (GE Healthcare). Because of the small voxel size, 10 separate sequences were performed. After the data from each acquisition were obtained, images were registered to each other and added by using a technique previously described,25 giving a final NEX of 20. Scanning time was 18 minutes.
Endarterectomy Specimens and MicroCT Technique
Endarterectomy specimens were fixed with 10% formaldehyde as soon as they were removed from the patient. Because endarterectomy specimens need to be decalcified for histology processing, calcification was assessed by using tabletop MicroCT imaging with eXplore Locus SP (GE Healthcare). This served as the criterion standard for the identification of calcification.26 Scanning parameters were amperage, 80 μA; voltage, 80 mV. A 3D volume was acquired. Images were reconstructed at an in-plane resolution of 35 × 35 μm, with a thickness of 35 μm. Therefore, voxel size was 35 μm3.
MR Imaging and MicroCT Matching
Matching of MR imaging and MicroCT sections used the distance from the bifurcation and the morphology of the plaque and vessel wall. An 8-segment template was used for MR imaging/MicroCT correlation (Fig 1), and the location of either component was manually drawn in a scoring grid.
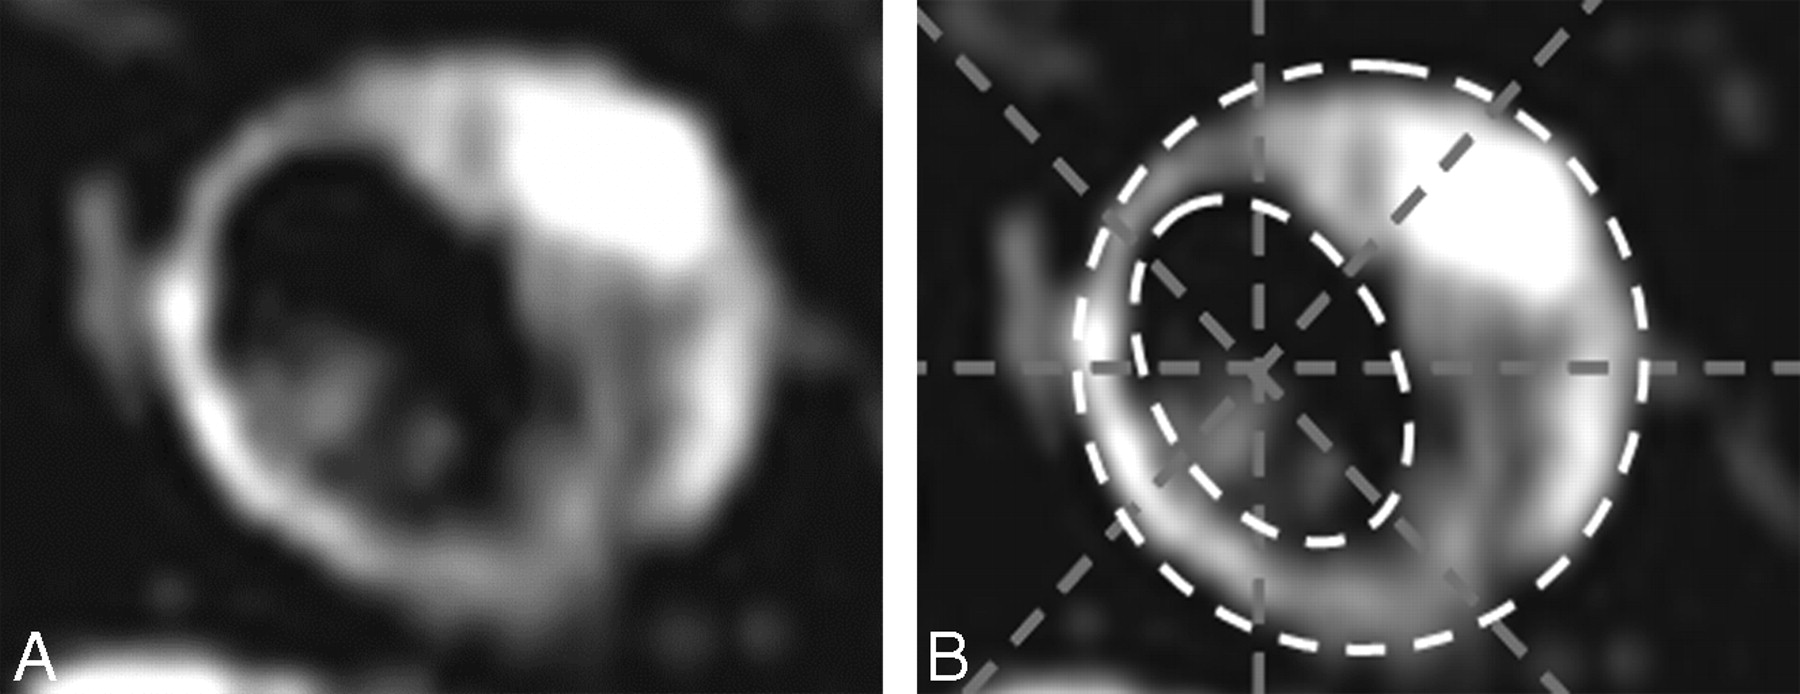
Example of an 8-segment grid placement. A, Image without grid. B, Image with grid.
MR Imaging/MicroCT Analysis
Images were reviewed by 2 radiologists, 1 with a specific interest in vascular MR imaging, the other a neuroradiologist. Each segment was analyzed for either the presence of high signal intensity within the atherosclerotic plaque (defined as at least 2 times the signal intensity of the adjacent muscle27 in MRIPH) or calcification (regions of calcium attenuation in the MicroCT images). If a segment had high signal intensity on MRIPH and no calcification on MicroCT, it was scored as “high signal intensity” on MRIPH and “no calcium” on MicroCT and vice versa.
When 1 segment exhibited both high signal intensity in MRIPH and calcification in MicroCT, a different scoring system was used. For this, both the location of the component and the segment involvement were evaluated. We used 3 scores:
When 1 component involved >50% of a particular segment and the other <50% (eg, high signal intensity occupied 75% of a segment on MRIPH and calcium occupied 10% of the corresponding segment on MicroCT), the segments were called “positive” for the component that had a level of involvement ≥50% (eg, in this case, the segment was called “positive for high signal intensity, negative for calcium”).
When both components involved the segment by <50%, the location of each component was evaluated, and the following 2 scores were used.
If the components did not overlap (eg, they were reciprocal to each other, Fig 2 A, -B), the segment was counted as double (ie, “positive for high-signal intensity, negative for calcium” and “positive for calcium, negative for high-signal intensity”).
If the components overlapped (therefore, the high signal intensity seen on MRIPH could be attributed to calcium), then the segment was counted only once as positive for both (ie, “positive for high-signal intensity, positive for calcium”).

Complicated carotid atherosclerotic plaque. A, MRIPH. B, Matching MicroCT image. Note how the high signal intensity seen in A (arrows) does not correspond to calcification in the MicroCT image (arrows).
Both reviewers used the 8-segment grid to record the presence or absence of high signal intensity/calcium and were blinded to the results of the other technique at the time of review.
Statistical Analysis
Agreement between MR imaging and MicroCT was measured by calculating the Cohen κ by using the Statistical Package for the Social Sciences statistical software, Version 12 for Windows (SPSS, Chicago, Illinois). A value of κ ≥ 0.7 was used as a measure of a high level of agreement.
Results
Patient Demographics
The study population comprised 11 patients (10 men and 1 woman) with a mean age of 74.6 ± 3.6 years (range, 69–81 years).
Comparison of MRIPH and MicroCT
A total of 225 axial images were reviewed for each technique, yielding 1800 segments for analysis. Only segments in which high signal intensity and/or calcification were present were included in the final analysis (1186 and 1107 segments, readers 1 and 2, respectively). High signal intensity was seen in 697 of 1186 segments (58.8%, reader 1) and 763 of 1107 segments (68.9%, reader 2) of MRIPH images (Table). Calcification, on the other hand, was seen in 530 of 1186 segments (44.7%, reader 1) and 356 of 1107 segments (32.1%, reader 2) of MicroCT images (Table).
Agreement between high signal detected with MRIPH and calcification in MicroCT
High Signal Intensity (MRIPH) and Calcification (MicroCT) Agreement
High signal intensity seen by MRIPH showed very good, albeit inverse, agreement with calcification seen in MicroCT (κ = −0.90; P < .0001; 95% CI, −0.93 to −0.86, reader 1; and κ = −0.74; P < .0001; 95% CI, −0.81 to −0.69, reader 2) (Figs 2 and 3). On the other hand, high signal intensity demonstrated excellent agreement with lack of calcification seen on MicroCT (κ = 0.92; P < .0001; 95% CI, 0.89–0.94, reader 1; and κ = 0.97; P < .0001; 95% CI, 0.96–0.99, reader 2).
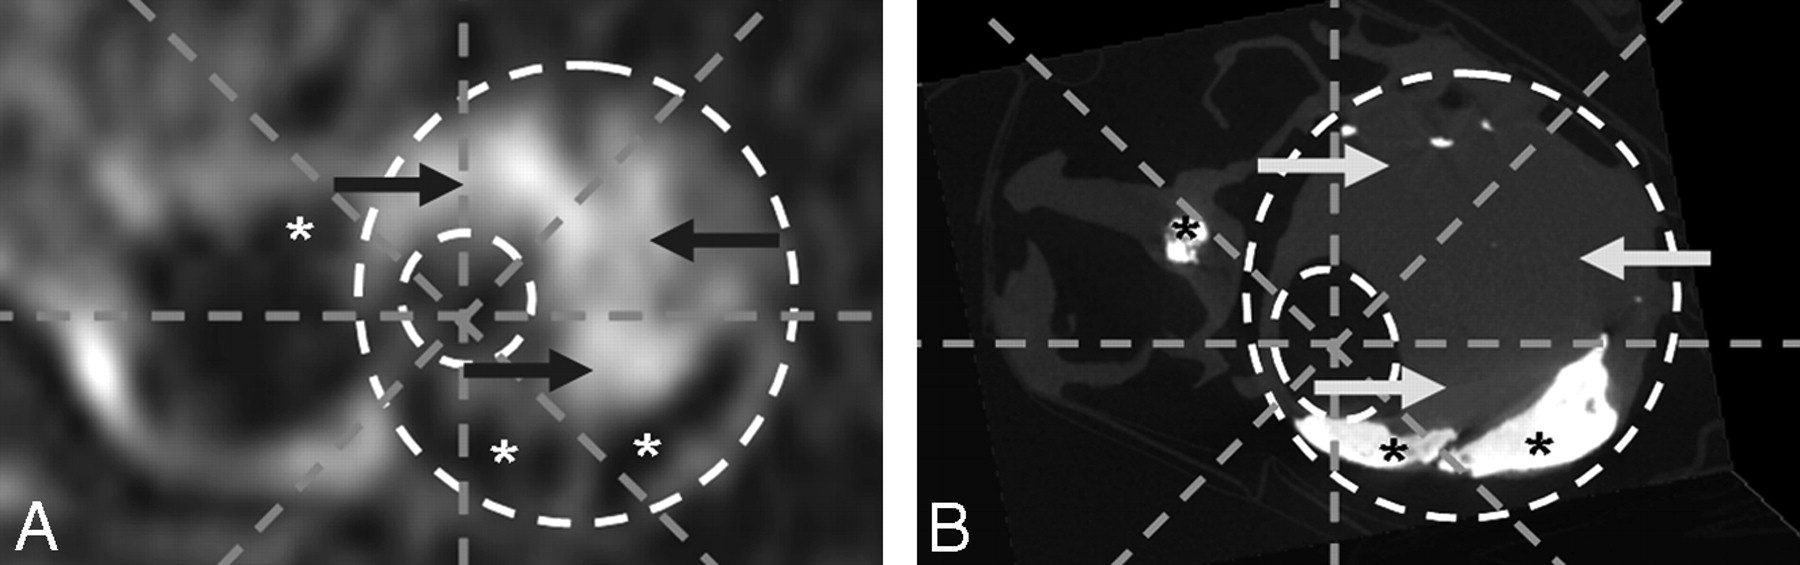
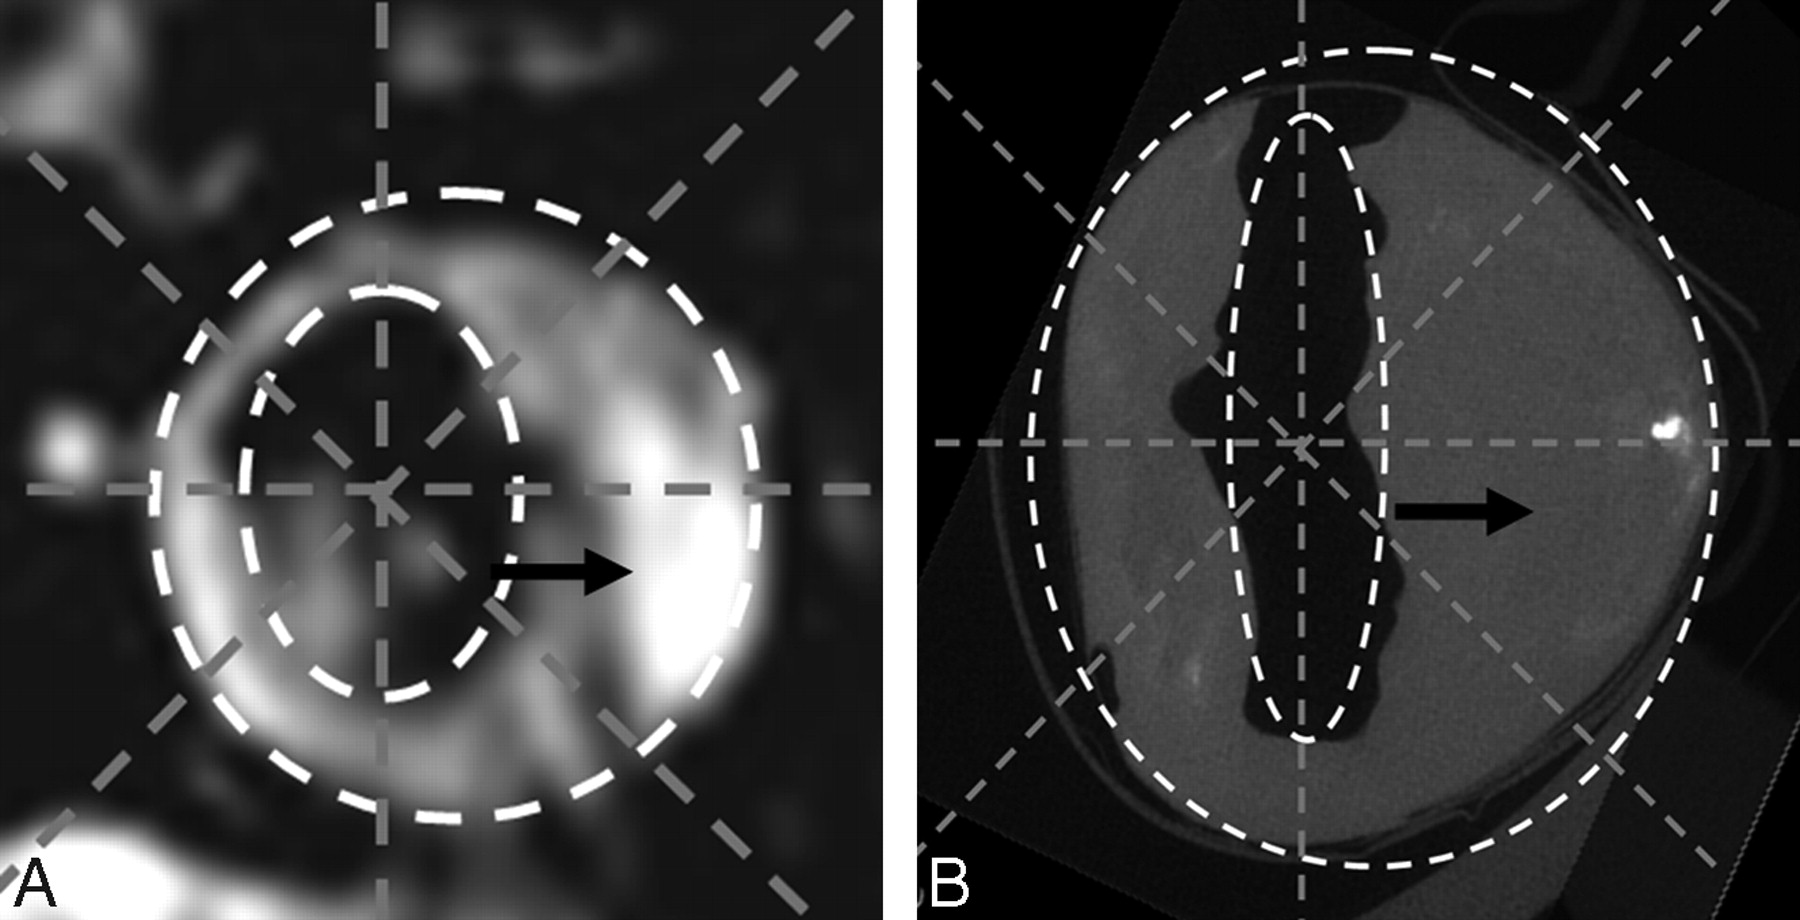
A, MRIPH. B, Matching MicroCT image. Note how the high signal intensity seen in A (arrow) does not correspond to calcification in the MicroCT image (B, arrow), and the regions of no signal intensity (asterisk) correspond to the regions of calcification in the MicroCT.
In a small number of segments (41 for reader 1 and 12 for reader 2), high signal intensity was seen in MRIPH and calcification was seen on MicroCT; however, these represented a very small proportion of the segments with high signal intensity (5.9% and 1.6% of segments, readers 1 and 2, respectively) (Table).
Discussion
We have demonstrated that the high signal intensity seen in MRIPH, a gradient-echo−based sequence, is almost exclusively due to hemorrhage and not calcification, by directly comparing in vivo high signal intensity seen in MRIPH with calcification in ex vivo specimens imaged with MicroCT.
Complicated plaques containing hemorrhage can also develop calcifications,10,11 making it possible to have both hemorrhage and calcification present in the same plaque. The development of vascular calcification is thought to be the result of chronic inflammation (as seen in atherosclerotic plaques).17 Calcifications appear to reduce the risk of rupture (by stabilizing the plaque), counteracting the instability provided by intraplaque hemorrhage. While the presence of both calcification and hemorrhage presents a challenge, the excellent agreement between high signal intensity in MRIPH and lack of calcification on MicroCT makes MRIPH a reliable technique for identifying complicated plaques.
Our finding that the high signal intensity seen in MRIPH represents intraplaque hemorrhage is in agreement with other 3D T1-weighted gradient-echo−based sequences.3,24 High signal intensity in carotid plaques did not correlate with the presence of calcium seen in the same segments in the corresponding MicroCT images. This could perhaps be explained by our scanning parameters (TE, 3.3 ms; TR, 11.2 ms; flip angle, 15°), which are much shorter than those that Henkelman and Kucharczyk22 reported as optimal (TE, 29 ms; TR, 30 ms; flip angle, 5°–10°). Also, the nature of the calcium (solid versus small crystals) may have played a role. Finally, most of our plaques were heavily calcified, likely >30%–40% of the weight the tissue.
Calcium producing marked signal intensity loss is in agreement with numerous reports in the current literature in which calcium has been shown to appear dark in T1-weighted, T2-weighted, proton attenuation-weighted, and diffusion-weighted imaging.1,2,19,28–31
Our study does have some limitations. The endarterectomy specimens were not imaged ex vivo with MRIPH. As such, no direct comparisons could be made between ex vivo high signal intensity and calcification as seen on MicroCT. Ex vivo imaging of the endarterectomy specimens with MRIPH would permit these comparisons to be made, allowing identification of any potential errors that could have been introduced due to postprocessing effects of the carotid endarterectomy on MicroCT images. In addition, in a small number of segments (41/1186 for reader one and 12/1107 for reader 2), high signal intensity on MRIPH overlapped calcification seen on MicroCT. However, these represented only a very small proportion of the segments (1.6%–5.9%). This could perhaps represent T1 shortening due to calcification. Ex vivo imaging of carotid endarterectomy specimens with MRIPH would allow T1 measurements to be performed in these areas, clarifying if the high signal intensity seen in these regions is due to T1 shortening secondary to calcification. In addition, these segments could represent mismatched segments. Imaging of carotid endarterectomy specimens with MRIPH in addition to MicroCT will account for any conformational changes that occur to the carotid plaque postendarterectomy and should account for this limitation.
In future studies, MRIPH could be used to evaluate the natural history of hemorrhage within the plaque. In those patients who are followed, changes in the signal intensity seen within the plaques with time can be correlated with findings from endarterectomy studies (histology and MicroCT), to assess if hemorrhage evolves into calcification. Intraplaque hemorrhage is thought to be the result of leakiness of the vasa vasora, vessels that originate from the adventitial side of the artery. Evaluating the location of calcification within the plaque (ie, closer to the adventitial-versus-luminal side of the plaque) would prove helpful in determining if hemorrhage evolves into calcification, because calcification would then be expected to be predominantly located in the adventitial rather than luminal side of the plaque.
Inflammation plays a crucial role in the progression of atherosclerosis.32,33 Because delayed enhancement has been shown to correlate with inflammation in the plaque,34,35 contrasted studies could perhaps be helpful in evaluating whether inflammation plays a role in the development of intraplaque hemorrhage and calcification. Finally, only 11 patients (with a narrow age range) were included in this study; therefore, the results may need further validation in future studies with a larger sample size, particularly including younger patients and/or patients with a shorter history of disease.
Conclusions
Even though calcification can appear as high signal intensity in some T1 GRE-based sequences, the high signal intensity seen in MRIPH cannot be attributed to calcification. Previous studies have shown MRIPH to identify intraplaque hemorrhage. Therefore, the high signal intensity seen in MRIPH reliably identifies complicated plaque, which is increasingly recognized as indicating high-risk vascular disease.
Footnotes
Richard Bitar, MD, is the recipient of a Canadian Heads of Academic Radiology Resident Grant and a Canadian Institutes of Health Research Fellowship.
Paper previously presented at: Annual Meeting of the American Society of Neuroradiology, May 6–12, 2006; San Diego, California.
References
- Received February 2, 2010.
- Accepted after revision March 9, 2010.
- Copyright © American Society of Neuroradiology


