Advertisement

Main menu

  • Home
  • Content
    • Current Issue
    • Accepted Manuscripts
    • Article Preview
    • Past Issue Archive
    • Video Articles
    • AJNR Case Collection
    • Case of the Week Archive
    • Case of the Month Archive
    • Classic Case Archive
  • Special Collections
    • Low-Field MRI
    • Alzheimer Disease
    • ASNR Foundation Special Collection
    • Photon-Counting CT
    • AJNR Awards
    • View All
  • Multimedia
    • AJNR Podcasts
    • AJNR SCANtastic
    • Trainee Corner
    • MRI Safety Corner
    • Imaging Protocols
  • For Authors
    • Submit a Manuscript
    • Submit a Video Article
    • Submit an eLetter to the Editor/Response
    • Manuscript Submission Guidelines
    • Statistical Tips
    • Fast Publishing of Accepted Manuscripts
    • Graphical Abstract Preparation
    • Imaging Protocol Submission
    • Author Policies
  • About Us
    • About AJNR
    • Editorial Board
    • Editorial Board Alumni
  • More
    • Become a Reviewer/Academy of Reviewers
    • Subscribers
    • Permissions
    • Alerts
    • Feedback
    • Advertisers
    • ASNR Home

User menu

  • Alerts
  • Log in

Search

  • Advanced search
American Journal of Neuroradiology

American Journal of Neuroradiology

ASHNR American Society of Functional Neuroradiology ASHNR American Society of Pediatric Neuroradiology ASSR
  • Alerts
  • Log in

Advanced Search

  • Home
  • Content
    • Current Issue
    • Accepted Manuscripts
    • Article Preview
    • Past Issue Archive
    • Video Articles
    • AJNR Case Collection
    • Case of the Week Archive
    • Case of the Month Archive
    • Classic Case Archive
  • Special Collections
    • Low-Field MRI
    • Alzheimer Disease
    • ASNR Foundation Special Collection
    • Photon-Counting CT
    • AJNR Awards
    • View All
  • Multimedia
    • AJNR Podcasts
    • AJNR SCANtastic
    • Trainee Corner
    • MRI Safety Corner
    • Imaging Protocols
  • For Authors
    • Submit a Manuscript
    • Submit a Video Article
    • Submit an eLetter to the Editor/Response
    • Manuscript Submission Guidelines
    • Statistical Tips
    • Fast Publishing of Accepted Manuscripts
    • Graphical Abstract Preparation
    • Imaging Protocol Submission
    • Author Policies
  • About Us
    • About AJNR
    • Editorial Board
    • Editorial Board Alumni
  • More
    • Become a Reviewer/Academy of Reviewers
    • Subscribers
    • Permissions
    • Alerts
    • Feedback
    • Advertisers
    • ASNR Home
  • Follow AJNR on Twitter
  • Visit AJNR on Facebook
  • Follow AJNR on Instagram
  • Join AJNR on LinkedIn
  • RSS Feeds

AJNR at ASNR25 | Join us at BOOTH 312 and more. Check out our schedule

Review ArticleReview Articles
Open Access

Evaluation of CT Perfusion in the Setting of Cerebral Ischemia: Patterns and Pitfalls

Y.W. Lui, E.R. Tang, A.M. Allmendinger and V. Spektor
American Journal of Neuroradiology October 2010, 31 (9) 1552-1563; DOI: https://doi.org/10.3174/ajnr.A2026
Y.W. Lui
  • Find this author on Google Scholar
  • Find this author on PubMed
  • Search for this author on this site
E.R. Tang
  • Find this author on Google Scholar
  • Find this author on PubMed
  • Search for this author on this site
A.M. Allmendinger
  • Find this author on Google Scholar
  • Find this author on PubMed
  • Search for this author on this site
V. Spektor
  • Find this author on Google Scholar
  • Find this author on PubMed
  • Search for this author on this site
  • Article
  • Figures & Data
  • Info & Metrics
  • Responses
  • References
  • PDF
Loading

Abstract

SUMMARY: CTP has a growing role in evaluating stroke. It can be performed immediately following NCCT and has advantages of accessibility and speed. Differentiation of salvageable ischemic penumbra from unsalvageable core infarct may help identify patients most likely to benefit from thrombectomy or thrombolysis. Still, CTP interpretation can be complex. We review normal and ischemic perfusion patterns followed by an illustrative series of technical/diagnostic challenges of CTP interpretation in the setting of acute stroke syndromes.

Abbreviations

ACA
anterior cerebral artery
AIF
arterial input function
ASPECTS
Alberta Stroke Program Early CT Score
CBF
cerebral blood flow
CBV
cerebral blood volume
CTA
CT angiography
CTP
CT perfusion
DWI
diffusion-weighted imaging
ICA
internal carotid artery
MCA
middle cerebral artery
MTT
mean transit time
NCCT
noncontrast CT
PET
positron-emission tomography
SPECT
single-photon emission CT
TTP
time to peak
VOF
venous output function

In the assessment of acute stroke syndrome, neuroimaging plays a critical role in determining patient care. NCCT remains the first-line imaging technique for differentiating hemorrhagic and ischemic stroke and identifying other etiologies for altered neurologic status, such as an intracranial mass.1 In stroke, NCCT is used to exclude acute hemorrhage and large areas of clearly infarcted tissue and to select patients for thrombolysis.2–4 The addition of cross-sectional CT angiography and perfusion imaging can further improve detection of infarct, can identify candidates who will have the best functional outcome after thrombolysis, and may further widen the time window for intravascular therapy.5–8

The role of CTP in the acute stroke setting continues to grow despite widespread use of DWI.9 CT has distinct advantages, including relative cost, availability, and ease of patient monitoring.10 The advent of multidetector CT has also increased imaging speed, making dynamic and angiographic imaging possible. CTP and CTA can be performed rapidly and conveniently following NCCT.11 On 16-section multidetector scanners, the total additional scanning time for CTP/CTA is <2 minutes. The total additional acquisition time is approximately 15 minutes, and additional postprocessing time is approximately 10 minutes.12 CTP imaging can be performed while keeping the radiation dose as low as possible and producing useful perfusion maps. Care must be taken to optimize scanning parameters for CTP as per recent statements from the US Food and Drug Administration,13 the American College of Radiology, and American Society of Neuroradiology.14

With CTP, it is not only possible to accurately identify potentially salvageable ischemic tissue (penumbra) and separate this from irreversibly infarcted tissue (core), but recent work shows that CTP can be used to predict the benefit after thrombolysis.15 Studies have shown good agreement of CTP findings with DWI and MR perfusion.7,16 In addition, CBF can be quantified by using CTP.

CTP packages are now available on virtually all commercial CT scanners. As the role of CTP grows in the diagnosis and treatment of acute stroke, it becomes ever more important for the radiologist to understand patterns and potential pitfalls in interpretation. We review a series of perfusion patterns with illustrative cases of cerebral ischemia and mimickers.

Perfusion Patterns

Normal Perfusion

CTP parameters that are commonly calculated by commercially available postprocessing software platforms include CBF, CBV, MTT, and TTP. CBF, CBV, and MTT are related by the central volume principle: CBF = CBV/MTT.17 These are commonly derived from CTP source data by using deconvolution analysis.18 CTP measures brain tissue blood perfusion. CBV is measured in units of milliliters of blood per 100 g of brain and is defined as the volume of flowing blood for a given volume of brain. MTT is measured in seconds and defined as the average amount of time it takes blood to transit through the given volume of brain. CBF is measured in units of milliliters of blood per 100 g of brain tissue per minute and is defined as the volume of flowing blood moving through a given volume of brain in a specific amount of time.18

In normal perfusion, there is symmetric perfusion with higher CBF and CBV in gray matter compared with white matter, reflecting the physiologic hemodynamic differences between these tissues (Fig 1).19

Fig 1.
  • Download figure
  • Open in new tab
  • Download powerpoint
Fig 1.

NCCT (A) and CTP parametric maps, CBF (B), CBV (C), and MTT (D), demonstrate normal symmetric brain perfusion. By convention, all color maps are coded red for higher values and blue for lower values.

Core Infarct versus Penumbra

In the setting of acute infarction, areas of irreversibly infarcted tissue show matched areas of decreased CBF and CBV with increased MTT (Fig 2 ). This pattern suggests neuronal death with irreversible loss of function or core infarct.20 In several studies correlating CTP with DWI, severe decreases in CBV are particularly sensitive and specific for defining the extent of unsalvageable core.8,21–23

Fig 2.
  • Download figure
  • Open in new tab
  • Download powerpoint
Fig 2.

An 87-year-old woman presenting with acute dysarthria, left facial droop, and left-sided weakness. On admission, NCCT and CTP were performed concurrently. A, NCCT shows some microvascular ischemic changes posteriorly. B−D, CTP maps, CBF (B), CBV (C), and MTT (D), demonstrate a large area of matched deficit on CBV and MTT maps, indicative of core infarct in the right MCA territory.

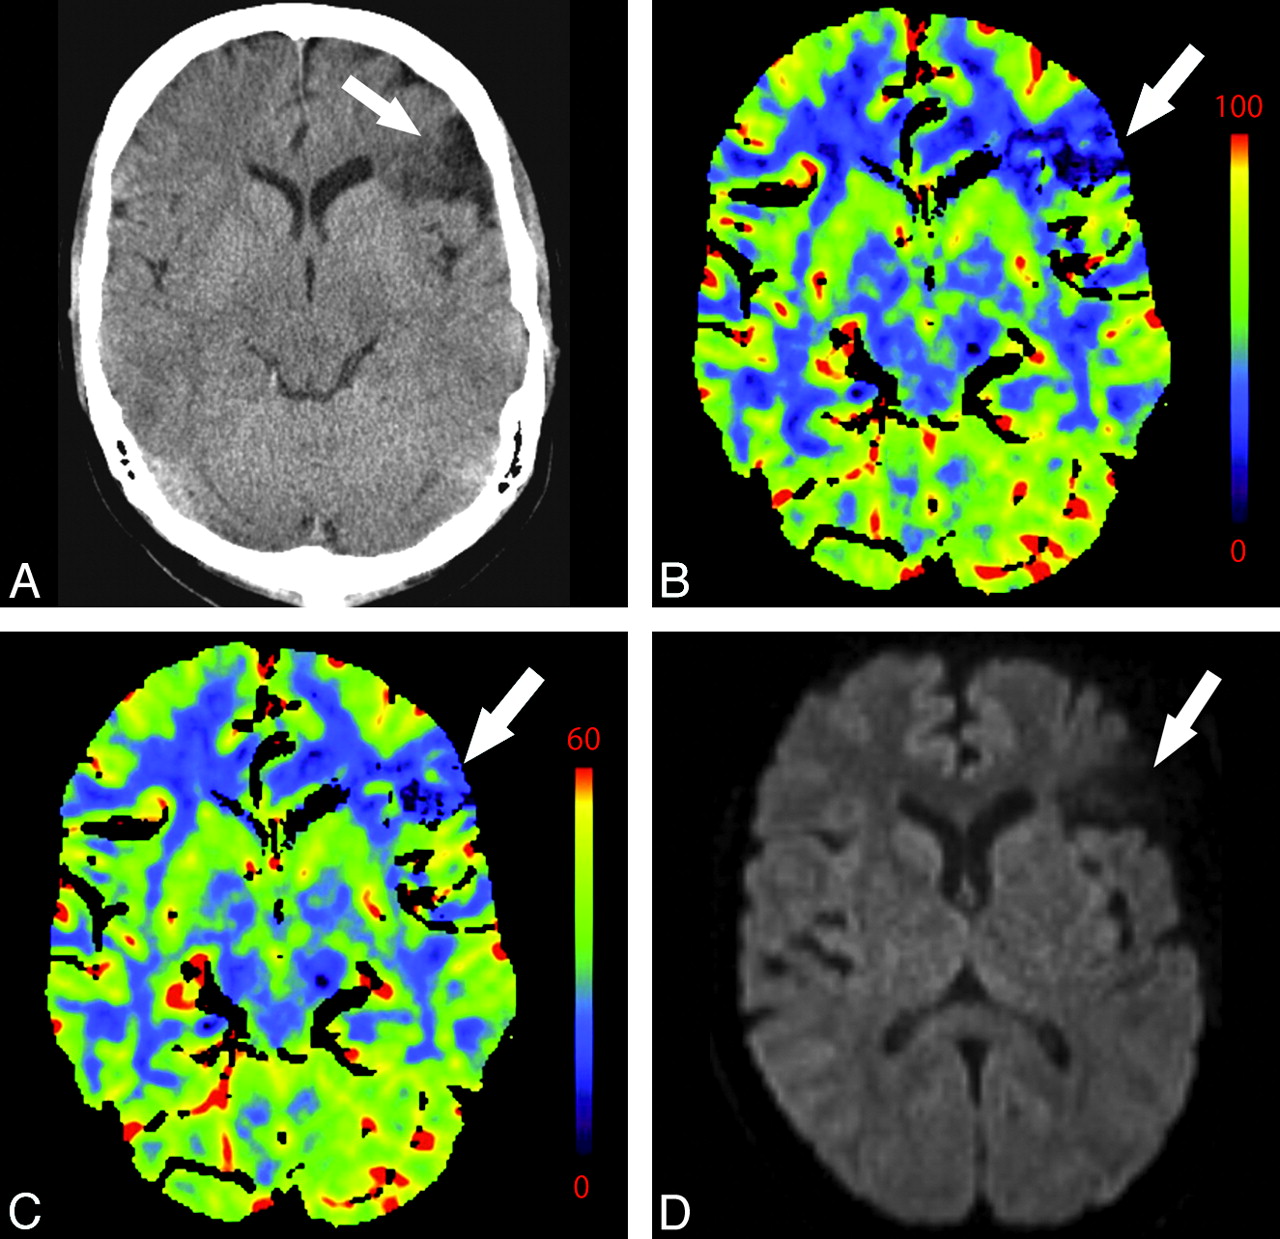
On the other hand, in the setting of acute infarction, it is possible to have regions of tissue that show decreased CBF with maintained CBV indicating potentially salvageable tissue or penumbra. Such areas can also be characterized by prolonged MTT extending beyond areas of core infarct (Fig 3) and have been called CBV/MTT mismatch.11,24 As an alternative to visual inspection for CBV/MTT mismatch, recent work has been done to develop computer-automated generation of penumbra maps, which can provide an easy approximation of core infarct and region of penumbra.25 Reports suggest being able to extend the intravascular therapeutic window with the identification of substantial penumbra.8,26–28

Fig 3.
  • Download figure
  • Open in new tab
  • Download powerpoint
Fig 3.

A 64-year-old man presenting with headache and acute aphasia. A, On admission, NCCT and CTP were performed. NCCT shows no evidence of acute infarction. B, CT perfusion CBF map shows a region of decreased perfusion within the posterior segment of the left MCA territory (arrows). D, MTT map shows a corresponding prolongation within this same region (arrows). C, CBV map demonstrates no abnormality, therefore, representing a CBV/MTT mismatch or ischemic penumbra.

Postischemic Hyperperfusion

Postischemic hyperperfusion reflects restoration of perfusion pressure to normal or near-normal values in a cerebrovascular territory affected by prior severe ischemia due to either spontaneous or therapeutic recanalization of occluded vessels.29 This has been shown by multiple modalities including Xenon-311 perfusion imaging, SPECT, and PET.30 Hyperperfusion following cerebral ischemia in the early acute stage tends to last a short time and has been associated with better prognosis. On the other hand, postischemic hyperperfusion persisting into subacute stages of ischemia indicates a less favorable prognosis and is associated with increased edema and hemorrhage.30 Recent animal studies by using PET and SPECT have been performed to investigate the implications of early postischemic hyperperfusion.30–32

In the setting of main vessel occlusion followed by recanalization, CBV and CBF are increased within the distal territory of interest compared with contralateral brain (Fig 4).29 When interpreting CTP in the setting of acute stroke syndrome, one must be aware of this phenomenon. Correlating with the clinical history may be particularly useful. Areas of hyperperfusion after an ischemic event should not be erroneously identified as contralateral areas of hypoperfusion and acute infarction.

Fig 4.
  • Download figure
  • Open in new tab
  • Download powerpoint
Fig 4.

A 74-year-old man who presented to the emergency department after a fall with left-sided weakness. Initial CT findings were normal (not shown). A, DWI sequence obtained 2 days later demonstrated an acute/subacute right frontal infarct. B, Several hours later, the patient had new contralateral symptoms, which prompted this CTP study. NCCT at that time demonstrated the right frontal opercular infarct. C−E, CT perfusion demonstrates asymmetric perfusion with relatively increased CBV (C), increased CBF (D), and decreased MTT (E) in this region (arrows) compared with the contralateral brain. This is consistent with postischemic hyperperfusion. Of note, no abnormalities are seen in the left hemisphere. F, The following day, the patient's symptoms progressed, and follow-up NCCT shows hemorrhage in the region of subacute infarction.

Establishing CTP Thresholds

Visual inspection of CTP color maps can be an effective way of identifying areas of core infarct and penumbra and may be sufficient to guide decisions on intervention.8,9 Visual inspection has the advantage of speed and simplicity of use; however, this qualitative technique is dependent on user interpretation.

In addition, it is also possible to calculate quantitative CTP parameters (Fig 5 ). These have been shown to be effective in demonstrating acute ischemia, distinguishing salvageable from unsalvageable tissue, and predicting therapeutic outcome, yet protocols and guidelines for quantitative thresholds vary.5,8,21–23,25,33–39 Differences in CTP hardware and software can affect quantified metrics,1,37,40 and clearly defined thresholds for guiding therapy have yet to be standardized.34 Some studies suggest the use of CBF thresholds for defining areas of infarct, specifically CBF < 25 mL ×100 g−1 × min−1.24 In an analysis of 130 patients with acute stroke, Wintermark et al21 suggested using absolute CBV < 2 mL ×100 g−1 to define core infarct, and relative MTT increase >145% to define penumbra. Murphy et al24 studied 30 patients and demonstrated CBF × CBV as the best predictor for differentiating core infarct and penumbra, better than CBF or CBV thresholds alone. Specific thresholds are also specific to the perfusion software platform being used and may not be automatically transferable to other vendors, scanners, and even software versions. At this time, much work remains to standardize quantitative methods of CTP interpretation, which, in the future, may be addressed by a proposed consortium for acute stroke imaging.34

Fig 5.
  • Download figure
  • Open in new tab
  • Download powerpoint
Fig 5.

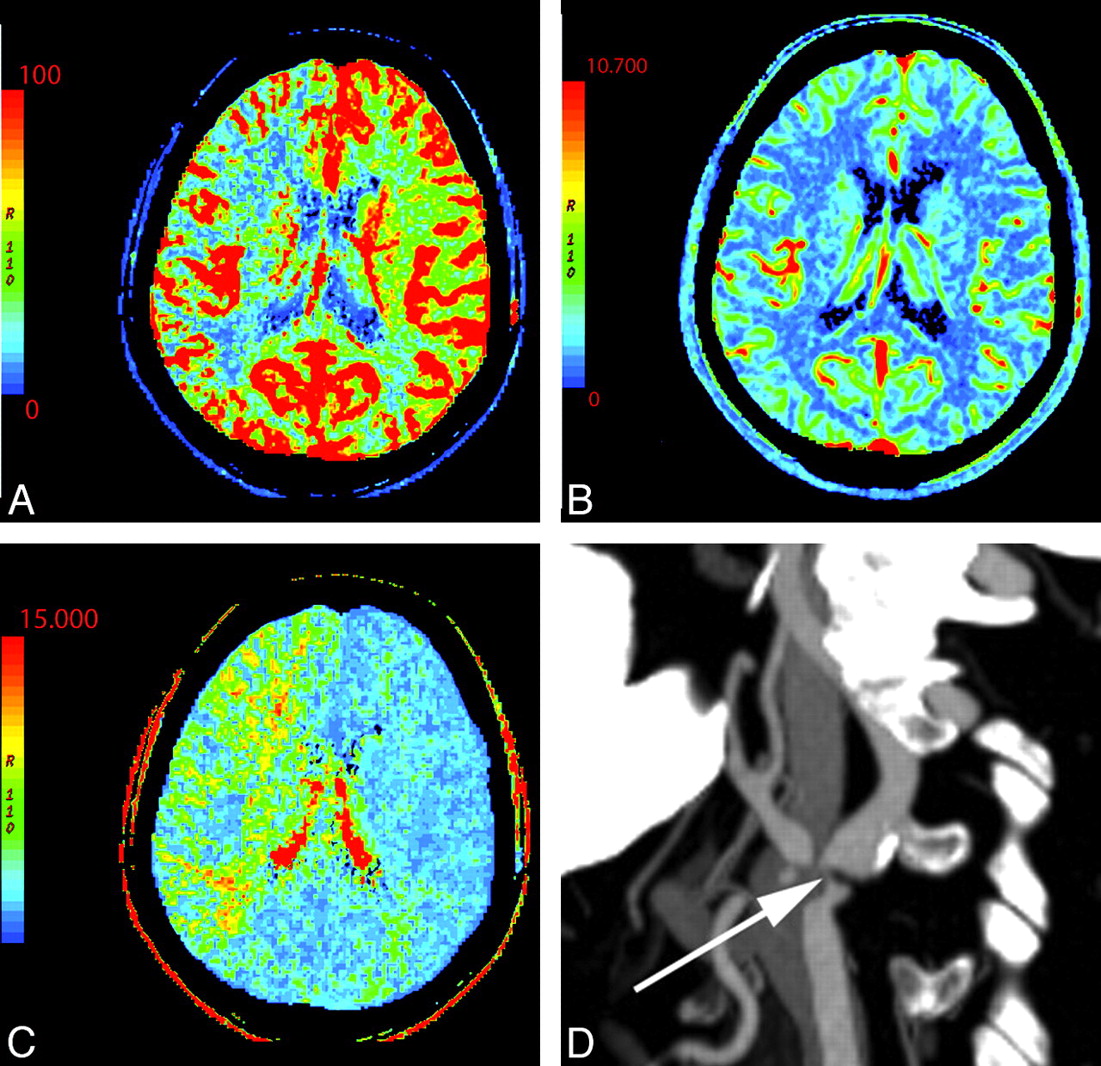
A 76-year-old man presenting with acute right-sided symptoms. A, NCCT is normal. CTP map demonstrates a large left MCA stroke with penumbra. B, The CBF map and D, the MTT map demonstrate decreased flow and prolongation of MTT in most of the left MCA territory (arrows) with a CBF (10 mL 100 g1 min1). C, On the CBV map, there is a region of decreased perfusion in the left basal ganglia only (arrows). This represents a CBV/MTT mismatch or ischemic penumbra. The CBV on the ischemic side is 0.6 mL × 100 g−1. Relative MTT on the ischemic side is 500% increased within the core and 200% increased within the penumbra compared with homologous contralateral brain.

As an alternative, some investigators have proposed adapting a semiquantitative method of visual assessment, applying the ASPECTS technique to CTP evaluation. ASPECTS is a technique originally conceived for use in the setting of acute MCA stroke syndrome to grade the NCCT appearance of MCA territory regions on a 10-point grading system. In the European and Australia Cooperative Stroke Study II trial, ASPECTS grade was shown to have implications for treatment and prognosis.2–4 Applied to CTP, ASPECTS scoring of parametric maps has been shown to improve identification of early ischemic changes and predict infarct extent and outcome of thrombolysis compared with NCCT alone.41–44 Semiquantitative methods are easy to implement, potentially useful, and promising methods of analysis.

Technical Pitfalls

Section Selection

Currently, most CTP protocols use selective axial sections through the basal ganglia to image the MCA territory. These protocols may result in the exclusion of areas of abnormal perfusion (Fig 6). In addition, to evaluate posterior circulation ischemia, protocols must be appropriately adjusted to include lower sections (Fig 7).9 Nagahori et al45 demonstrated prolonged time of bolus arrival and TTP in posterior circulation infarcts. CTP may be a potentially useful adjunct, particularly in the evaluation of posterior fossa ischemia because this location is notoriously difficult to evaluate on NCCT. Care must be taken to image the appropriate brain volume corresponding to the clinical syndrome.

Fig 6.
  • Download figure
  • Open in new tab
  • Download powerpoint
Fig 6.

A 58-year-old man presenting with acute left hemiparesis and what was thought to be acute right MCA syndrome. A, CTP at admission demonstrates symmetric and normal-appearing perfusion; CBV is shown. B, However, an acute infarct is seen on DWI outside the volume imaged during CTP.

Fig 7.
  • Download figure
  • Open in new tab
  • Download powerpoint
Fig 7.

A 61-year-old man presenting with an acute right Wallenberg syndrome. A and B, CBV (A) and MTT (B) maps (here shown in reverse color scheme) obtained through the level of the posterior fossa show an area of ischemic penumbra in the right posterior inferior cerebellar artery territory (arrows). C, DWI confirms a right lateral medullary infarct with salvage of the right inferior cerebellar hemisphere penumbra.

In the future, difficulties arising from appropriate section selection may be resolved with 256-detector scanners, which permit dynamic scanning through the entire brain volume.9,46 Because of cost considerations, it remains to be seen whether the next generation of multidetector scanners will enter the clinical arena. Radiation dose may be a concern; however, the wider nominal beam used by a 256-detector scanner could, in fact, reduce overall radiation dose compared with 16-detector scanners currently widely in use.47

AIF and VOF

The availability of adequate AIF and VOF is necessary for obtaining valid CTP maps. In cases such as suboptimal contrast bolus, cardiac arrhythmia, severe intracranial vascular narrowing, or multiple intracranial emboli, lack of adequate flow within the vessels of the circle of Willis could preclude calculation of diagnostic CTP maps (Fig 8 ). Similarly, poor placement of venous outflow region of interest can be problematic (Fig 9). Technical issues can result in an appearance mimicking global hypoperfusion.

Fig 8.
  • Download figure
  • Open in new tab
  • Download powerpoint
Fig 8.

A 55-year-old woman presenting with left hemiparesis and normal findings on head CT. A, CTP source image shows poor contrast opacification within the right ACA (arrow). Commonly, the A2 segment of the ACA can be used for AIF placement. In this case, this was inadequate and resulted in nondiagnostic functional CTP maps. B, CBV is shown as an example.

Fig 9.
  • Download figure
  • Open in new tab
  • Download powerpoint
Fig 9.

A, Inappropriate venous region-of-interest selection resulting in the CBV appearance mimicking global hypoperfusion. Perfusion was symmetric and normal following correct region-of-interest placement in the same patient (not shown). B, An example of appropriate placement of the AIF and VOF regions of interest is shown in the ACA and superior sagittal sinus, respectively. C, The corresponding normal findings on CBV are shown.

Arterial and venous regions of interest and pre- and postenhancement cutoff values are selected from CTP source imaging to generate representative arterial input and venous outflow time-attenuation curves, which are then used to calculate CTP parameters. The AIF is frequently obtained from the A2 segment of the ACA. Because it travels perpendicular to the axial plane, the A2 segment of the ACA is seen on multiple images, and it is easy to train technologists to find this vessel. However, other arteries may be used as well such as the ICA and MCA. Even external carotid artery branches may be used as surrogate AIFs and have been shown to correlate well with the ACA.48 Venous outflow is frequently obtained from 1 of the dural venous sinuses (Fig 9). Poor placement of regions of interest affects both visual and quantitative CTP assessment.49

Diagnostic Pitfalls

Small and Chronic Infarcts

Calculated CTP maps are relatively low in resolution, and small strokes are not as obvious as large territory infarcts. Small infarcts may be missed even when they are included in the interrogated volume; however, these can be highly symptomatic when located within eloquent areas (Fig 10).

Fig 10.
  • Download figure
  • Open in new tab
  • Download powerpoint
Fig 10.

A 58-year-old woman with left-sided weakness. A−D, NCCT (A) shows left periatrial microvascular ischemic changes (arrows) corresponding to perfusion abnormalities of CBF (B), CBV (C), and MTT (D) maps (arrows). Strategically located infarcts may be symptomatic though small and difficult to detect. No gross asymmetric perfusion is seen in the region of the right internal capsule. E, DWI performed on the same day shows a small acute infarct in the posterior limb of the right internal capsule.

Areas of chronic infarction are frequently obvious on NCCT; however, the perfusion appearance of chronic infarct can be confusing. The appearance of chronic infarct on CTP is not immeasurably low. Nuclear imaging studies have shown that most tissue in regions of chronic infarct demonstrates a low but persistent degree of metabolism and CBF.32 There is continued perfusion to remaining neuronal and glial cells within gliotic brain parenchyma, leading to diminished but persistent and measurable perfusion (Fig 11 ). It is important to interpret CTP in conjunction with NCCT and clinical history to avoid misinterpretation of chronic infarcts as being more recent. Areas of acute infarction adjacent to areas of more chronic infarct may be difficult to identify.

Fig 11.
  • Download figure
  • Open in new tab
  • Download powerpoint
Fig 11.

A 44-year-old woman with a history of anxiety disorder presenting with acute right facial weakness and expressive aphasia. She had no known history of prior stroke. CTP demonstrates a focal area of hypoperfusion in the left frontal lobe within an area of chronic-appearing infarct (arrows). Chronic infarcts have measurable though diminished perfusion. Areas of acute infarct adjacent to chronic infarcts may, therefore, be difficult to detect. NCCT (A), CBF (B), CBV (C), at presentation; DWI (D) 1 day later.

Microvascular Ischemia

Regions of chronic microvascular ischemia are common in patients with cerebrovascular risk factors and, therefore, may be frequently encountered in the interpretation of CTP.50 Reductions in CBF to brain parenchyma affected by white matter disease have been demonstrated by using a variety of modalities,51,52 and CTP corroborates these findings. Recently, Huynh et al53 used perfusion CT parameters to evaluate patients with white matter changes. They found decreased CBV in subjects with moderate-to-severe white matter changes compared with those with mild changes. The CBV was reduced in the periventricular region, and no changes in MTT were detected between the 2 groups. When asymmetric, microvascular changes may potentially be mistaken for regions of acute ischemia (Fig 10).

Extracranial and Intracranial Stenoses

Perfusion asymmetry in the setting of stenosis is difficult to evaluate. It can be unclear whether changes in perfusion reflect acute ischemia, slow collateral flow, or a combination of the 2 (Fig 12). Cerebral hypoperfusion can result from a range of extracranial etiologies, including extracranial carotid stenosis, proximal intracranial stenosis, and cerebrovascular steal syndromes.54–57

Fig 12.
  • Download figure
  • Open in new tab
  • Download powerpoint
Fig 12.

A 76-year-old man with change in mental status. NCCT findings (not shown) were normal. A−C, There is decreased CBF (A) and prolonged MTT (C) in the right MCA and ACA territories with preserved CBV (B). D, CTA reveals severe right ICA stenosis at its origin (arrow).

MTT prolongation is the most consistent and reproducible CTP abnormality in symptomatic extracranial carotid stenosis.54,57 This is accompanied by variable changes in CBF and CBV. Poststenotic areas may mimic or overestimate areas of acute ischemic penumbra. Therefore, the evaluation of the vessels via concurrent CTA should be routine.

On the other hand, steno-occlusive disease can also mask areas of true infarct. Investigators have shown that AIF selection in MR perfusion may improperly reflect flow through stenotic vessels.58 There is also documented interobserver variability in CTP, depending on AIF selection.59 Operator experience may be crucial to properly select local AIF that best reflects the hemodynamics of distal brain parenchyma.

Assessing Cerebrovascular Reserve

Poststenotic regions can be further evaluated by using an acetazolamide challenge CTP to assess cerebrovascular reserve. Vascular stenosis or occlusion leads to reduced distal perfusion pressure. The degree of stenosis does not accurately predict hemodynamic compromise. There are other mechanisms that may compensate, including collateral circulation and autoregulatory reflex vasodilation. Collateral circulation plays an important role in the case of chronic stenoses.60 Autoregulatory reflex vasodilation tends to be more important in cases of acute stenoses.61 These mechanisms provide physiologic reserve to compensate during times of stress. Inability to compensate in times of stress can induce ischemia. In patients with stenotic lesions, baseline CTP maps are not useful in predicting cerebrovascular reserve; however, changes in CBF60,62 and MTT61 after acetazolamide challenge correlate with hemodynamic reserve (Fig 13). Acetazolamide is a potent carbonic anhydrase inhibitor causing short-term cerebral arteriole vasodilation except within territories that are already maximally dilated due to autoregulatory reflex vasodilation. CTP with acetazolamide challenge can be useful in the assessment of cerebrovascular reserve. In particular, regions that demonstrate prominent changes in MTT after acetazolamide should be considered at-risk territories.61

Fig 13.
  • Download figure
  • Open in new tab
  • Download powerpoint
Fig 13.

A 54-year-old woman with dizziness and right-sided weakness. A, NCCT shows no gross abnormality. B, Coronal MIP from CT angiography demonstrates severe M1 of the left MCA and prominent collateral vessels (arrow). C−H, CTP before and following the administration of acetazolamide: pre-CBF (C), post-CBF (D), pre-CBV (E), post-CBV (F), pre-MTT (G), and post-MTT (H) images. Technique and scaling of the images are identical before and after acetazolamide administration. There is global bihemispheric increase in CBF and CBV after acetazolamide administration; however, there is increased asymmetric perfusion between the poststenotic (left) and the nonstenotic territories (right) as seen within the oval regions of interest. This is best seen as prolonged MTT following acetazolamide in portions of the left MCA territory relative to the baseline CT perfusion scan.

Vasospasm

Vasospasm is another condition in which CTP may be abnormal, mimicking areas of penumbra in the setting of acute stroke syndrome. Of course, the appropriate clinical scenario should suggest the diagnosis. The radiologist interpreting CTP must be aware of perfusion findings in vasospasm.

Severe vasospasm has been correlated with transient CTP abnormality, most notably prolongation of MTT and diminished CBF.63 In animal models of subarachnoid hemorrhage, prolongation of MTT was associated with vasospasm and early mortality.64 CTP has also been used in humans to assess the therapeutic effect of both intra-arterial vasodilators65 and intravascular stent placement,66 with improvement in CBF and MTT after treatment. Areas of perfusion abnormality in the setting of vasospasm should be considered at-risk territories akin to penumbra, though the pathophysiology of these 2 entities is different.

The combination of angiography and perfusion makes CT a very promising technique to evaluate patients at risk for vasospasm because it not only provides anatomic information concerning narrowing of the vessels but also provides data on brain tissue hemodynamics. Unlike other perfusion methods including SPECT and Xenon-311 perfusion imaging, CTP is fast and relatively easy to perform in ill patients with subarachnoid hemorrhage.67,68 Attention must be paid, however, to the radiation dose because patients with vasospasm are likely to require multiple follow-up studies.

Seizure

Seizure can be a clinical diagnostic dilemma because status epilepticus and postictal paralysis are both mimickers of acute stroke, and to further complicate matters, seizure can be a presenting symptom of cortical stroke. CTP may show asymmetric perfusion with ictal areas of hyperperfusion (Fig 14). With visual interpretation of color maps, this pattern can be mistaken for contralateral areas of the ischemia.69,70 Currently, characteristics of CTP imaging in the setting of seizure have not been studied in depth.69 The establishment of absolute quantitative CTP thresholds may be especially useful in such cases. Recent work by Hauf et al71 suggests that CTP can be used as an adjunct to electroencephalography to document ongoing seizure activity in patients with nonconvulsive status epilepticus, which may help in management of this difficult scenario.

Fig 14.
  • Download figure
  • Open in new tab
  • Download powerpoint
Fig 14.

A 55-year-old man presenting with acute altered mental status, right facial droop, and right upper extremity weakness and witnessed generalized tonic-clonic seizure. A, NCCT (not shown) and DWI (A) findings are normal. B, CBV shows hypoperfusion in the left hemisphere, mimicking core infarct. Electroencephalography and PET studies (not shown) later demonstrated a right hemispheric seizure focus, supporting CTP ictal hyperperfusion related to seizure rather than relative hypoperfusion related to left hemispheric infarct. The patient's symptoms resolved.

Conclusions

CTP in the setting of acute stroke syndrome is gaining more widespread use. CT has the advantages of being widely available and easily providing quantitative perfusion metrics. Both visual inspection and semiquantitative methods have potential roles in CTP analysis. CTP maps can accurately show regions of core infarct and penumbra, and CTP has recently been shown to be useful in predicting benefit from thrombolytic therapy.15

In interpreting CTP maps, there are several patterns with which one should be familiar. Care must be taken in the qualitative interpretation of perfusion maps because there are several scenarios that may be confusing. Attention should be paid to technical aspects of data acquisition and postprocessing, including placement of AIF and VOF regions of interest as well as selecting an appropriate volume of imaging for the patient's clinical syndrome. Entities such as chronic infarct, severe microvascular ischemia, and seizure can be mistaken for acute infarct. Vascular stenoses can mimic and overestimate areas of ischemic penumbra; therefore, CTP should always be performed and interpreted in conjunction with CTA. Additional uses of CTP are currently under investigation, such as evaluating cerebrovascular reserve. For both quantitative and qualitative postprocessing, operator experience and clinical correlation is of utmost importance for the correct interpretation of CTP data.

Indicates open access to non-subscribers at www.ajnr.org

References

  1. 1.↵
    1. de Lucas EM,
    2. Sanchez E,
    3. Gutierrez A,
    4. et al
    . CT protocol for acute stroke: tips and tricks for general radiologists. Radiographics 2008; 28: 1673– 87
    CrossRefPubMed
  2. 2.↵
    Tissue plasminogen activator for acute ischemic stroke: The National Institute of Neurological Disorders and Stroke rt-PA Stroke Study Group. N Engl J Med 1995; 333: 1581– 87
    CrossRefPubMed
  3. 3.↵
    1. Dzialowski I,
    2. Hill MD,
    3. Coutts SB,
    4. et al
    . Extent of early ischemic changes on computed tomography (CT) before thrombolysis: prognostic value of the Alberta Stroke Program Early CT Score in ECASS II. Stroke 2006; 37: 973– 78. Epub 2006 Feb 23
    Abstract/FREE Full Text
  4. 4.↵
    1. Furlan A,
    2. Higashida R,
    3. Wechsler L,
    4. et al
    . Intra-arterial prourokinase for acute ischemic stroke: the PROACT II study—a randomized controlled trial. Prolyse in Acute Cerebral Thromboembolism. JAMA 1999; 282: 2003– 11
    CrossRefPubMed
  5. 5.↵
    1. Schramm P,
    2. Schellinger PD,
    3. Klotz E,
    4. et al
    . Comparison of perfusion computed tomography and computed tomography angiography source images with perfusion-weighted imaging and diffusion-weighted imaging in patients with acute stroke of less than 6 hours' duration. Stroke 2004; 35: 1652– 58
    Abstract/FREE Full Text
  6. 6.↵
    1. Silvennoinen HM,
    2. Hamberg LM,
    3. Lindsberg PJ,
    4. et al
    . CT perfusion identifies increased salvage of tissue in patients receiving intravenous recombinant tissue plasminogen activator within 3 hours of stroke onset. AJNR Am J Neuroradiol 2008; 29: 1118– 23
    Abstract/FREE Full Text
  7. 7.↵
    1. Wintermark M,
    2. Meuli R,
    3. Browaeys P,
    4. et al
    . Comparison of CT perfusion and angiography and MRI in selecting stroke patients for acute treatment. Neurology 2007; 68: 694– 97
    Abstract/FREE Full Text
  8. 8.↵
    1. Hellier KD,
    2. Hampton JL,
    3. Guadagno JV,
    4. et al
    . Perfusion CT helps decision making for thrombolysis when there is no clear time of onset. J Neurol Neurosurg Psychiatry 2006; 77: 417– 19
    Abstract/FREE Full Text
  9. 9.↵
    1. Parsons MW
    . Perfusion CT: is it clinically useful? Int J Stroke 2008; 3: 41– 50
    CrossRefPubMed
  10. 10.↵
    1. Rai AT,
    2. Carpenter JS,
    3. Peykanu JA,
    4. et al
    . The role of CT perfusion imaging in acute stroke diagnosis: a large single-center experience. J Emerg Med 2008; 35: 287– 92
    CrossRefPubMed
  11. 11.↵
    1. Srinivasan A,
    2. Goyal M,
    3. Al Azri F,
    4. et al
    . State-of-the-art imaging of acute stroke. Radiographics 2006; 26 ( suppl 1): S75– 95
    CrossRefPubMed
  12. 12.↵
    1. Srinivasan A,
    2. Goyal M,
    3. Lum C,
    4. et al
    . Processing and interpretation times of CT angiogram and CT perfusion in stroke. Can J Neurol Sci 2005; 32: 483– 86
    PubMed
  13. 13.↵
    Food and Drug Administration. Update on Safety Investigation of CT Brain Perfusion Scan. Available at: http://www.fda.gov/MedicalDevices/Safety/AlertsandNotices/ucm185898.htm. Accessed December 8, 2009
  14. 14.↵
    The American Society of Neuroradiology and American College of Radiology Statement on CT Protocols and Radiation Dose. Available at: www.asnr.org/asnr_acr_ct_dose.shtml. Accessed January 8, 2010
  15. 15.↵
    1. Knoepfli AS,
    2. Sekoranja L,
    3. Bonvin C,
    4. et al
    . Evaluation of perfusion CT and TIBI grade in acute stroke for predicting thrombolysis benefit and clinical outcome. J Neuroradiol 2009; 36: 131– 37
    CrossRefPubMed
  16. 16.↵
    1. Schaefer PW,
    2. Barak ER,
    3. Kamalian S,
    4. et al
    . Quantitative assessment of core/penumbra mismatch in acute stroke: CT and MR perfusion imaging are strongly correlated when sufficient brain volume is imaged. Stroke 2008; 39: 2986– 92
    Abstract/FREE Full Text
  17. 17.↵
    1. Meier P,
    2. Zierler KL
    . On the theory of the indicator-dilution method for measurement of blood flow and volume. J Appl Physiol 1954; 6: 731– 44
    FREE Full Text
  18. 18.↵
    1. Konstas AA,
    2. Goldmakher GV,
    3. Lee TY,
    4. et al
    . Theoretic basis and technical implementations of CT perfusion in acute ischemic stroke. Part 1. Theoretic basis. AJNR Am J Neuroradiol 2009; 30: 662– 68
    Abstract/FREE Full Text
  19. 19.↵
    1. Rostrup E,
    2. Knudsen GM,
    3. Law I,
    4. et al
    . The relationship between cerebral blood flow and volume in humans. Neuroimage 2005; 24: 1– 11
    CrossRefPubMed
  20. 20.↵
    1. Heiss WD
    . Flow thresholds of functional and morphological damage of brain tissue. Stroke 1983; 14: 329– 31
    FREE Full Text
  21. 21.↵
    1. Wintermark M,
    2. Flanders AE,
    3. Velthuis B,
    4. et al
    . Perfusion-CT assessment of infarct core and penumbra: receiver operating characteristic curve analysis in 130 patients suspected of acute hemispheric stroke. Stroke 2006; 37: 979– 85
    Abstract/FREE Full Text
  22. 22.↵
    1. Wintermark M,
    2. Reichhart M,
    3. Thiran JP,
    4. et al
    . Prognostic accuracy of cerebral blood flow measurement by perfusion computed tomography, at the time of emergency room admission, in acute stroke patients. Ann Neurol 2002; 51: 417– 32
    CrossRefPubMed
  23. 23.↵
    1. Schramm P,
    2. Schellinger PD,
    3. Fiebach JB,
    4. et al
    . Comparison of CT and CT angiography source images with diffusion-weighted imaging in patients with acute stroke within 6 hours after onset. Stroke 2002; 33: 2426– 32
    Abstract/FREE Full Text
  24. 24.↵
    1. Murphy BD,
    2. Fox AJ,
    3. Lee DH,
    4. et al
    . Identification of penumbra and infarct in acute ischemic stroke using computed tomography perfusion-derived blood flow and blood volume measurements. Stroke 2006; 37: 1771– 77
    Abstract/FREE Full Text
  25. 25.↵
    1. Wintermark M,
    2. Fischbein NJ,
    3. Smith WS,
    4. et al
    . Accuracy of dynamic perfusion CT with deconvolution in detecting acute hemispheric stroke. AJNR Am J Neuroradiol 2005; 26: 104– 12
    Abstract/FREE Full Text
  26. 26.↵
    1. Furlan AJ,
    2. Eyding D,
    3. Albers GW,
    4. et al
    . Dose Escalation of Desmoteplase for Acute Ischemic Stroke (DEDAS): evidence of safety and efficacy 3 to 9 hours after stroke onset. Stroke 2006; 37: 1227– 31
    Abstract/FREE Full Text
  27. 27.↵
    1. Hacke W,
    2. Albers G,
    3. Al-Rawi Y,
    4. et al
    . The Desmoteplase in Acute Ischemic Stroke Trial (DIAS): a phase II MRI-based 9-hour window acute stroke thrombolysis trial with intravenous desmoteplase. Stroke 2005; 36: 66– 73. Epub 2004 Nov 29
    Abstract/FREE Full Text
  28. 28.↵
    1. Davis SM,
    2. Donnan GA,
    3. Parsons MW,
    4. et al
    . Effects of alteplase beyond 3 h after stroke in the Echoplanar Imaging Thrombolytic Evaluation Trial (EPITHET): a placebo-controlled randomised trial. Lancet Neurol 2008; 7: 299– 309. Epub 2008 Feb 28
    CrossRefPubMed
  29. 29.↵
    1. Nguyen TB,
    2. Lum C,
    3. Eastwood JD,
    4. et al
    . Hyperperfusion on perfusion computed tomography following revascularization for acute stroke. Acta Radiol 2005; 46: 610– 15
    CrossRefPubMed
  30. 30.↵
    1. Marchal G,
    2. Young AR,
    3. Baron JC
    . Early postischemic hyperperfusion: pathophysiologic insights from positron emission tomography. J Cereb Blood Flow Metab 1999; 19: 467– 82
    PubMed
  31. 31.↵
    1. Alexandrov AV,
    2. Black SE,
    3. Ehrlich LE,
    4. et al
    . Predictors of hemorrhagic transformation occurring spontaneously and on anticoagulants in patients with acute ischemic stroke. Stroke 1997; 28: 1198– 202
    Abstract/FREE Full Text
  32. 32.↵
    1. Marchal G,
    2. Beaudouin V,
    3. Rioux P,
    4. et al
    . Prolonged persistence of substantial volumes of potentially viable brain tissue after stroke: a correlative PET-CT study with voxel-based data analysis. Stroke 1996; 27: 599– 606
    Abstract/FREE Full Text
  33. 33.↵
    1. Wintermark M,
    2. Reichhart M,
    3. Cuisenaire O,
    4. et al
    . Comparison of admission perfusion computed tomography and qualitative diffusion- and perfusion-weighted magnetic resonance imaging in acute stroke patients. Stroke 2002; 33: 2025– 31
    Abstract/FREE Full Text
  34. 34.↵
    1. Wintermark M,
    2. Albers GW,
    3. Alexandrov AV,
    4. et al
    . Acute stroke imaging research roadmap. Stroke 2008; 39: 1621– 28
    Abstract/FREE Full Text
  35. 35.↵
    1. Sparacia G,
    2. Iaia A,
    3. Assadi B,
    4. et al
    . Perfusion CT in acute stroke: predictive value of perfusion parameters in assessing tissue viability versus infarction. Radiol Med 2007; 112: 113– 22
    CrossRefPubMed
  36. 36.↵
    1. Eastwood JD,
    2. Lev MH,
    3. Wintermark M,
    4. et al
    . Correlation of early dynamic CT perfusion imaging with whole-brain MR diffusion and perfusion imaging in acute hemispheric stroke. AJNR Am J Neuroradiol 2003; 24: 1869– 75
    Abstract/FREE Full Text
  37. 37.↵
    1. Eastwood JD,
    2. Lev MH,
    3. Azhari T,
    4. et al
    . CT perfusion scanning with deconvolution analysis: pilot study in patients with acute middle cerebral artery stroke. Radiology 2002; 222: 227– 36
    PubMed
  38. 38.↵
    1. Mayer TE,
    2. Hamann GF,
    3. Baranczyk J,
    4. et al
    . Dynamic CT perfusion imaging of acute stroke. AJNR Am J Neuroradiol 2000; 21: 1441– 49
    Abstract/FREE Full Text
  39. 39.↵
    1. Reichenbach JR,
    2. Rother J,
    3. Jonetz-Mentzel L,
    4. et al
    . Acute stroke evaluated by time-to-peak mapping during initial and early follow-up perfusion CT studies. AJNR Am J Neuroradiol 1999; 20: 1842– 50
    Abstract/FREE Full Text
  40. 40.↵
    1. Miles KA,
    2. Griffiths MR
    . Perfusion CT: a worthwhile enhancement? Br J Radiol 2003; 76: 220– 31
    FREE Full Text
  41. 41.↵
    1. Aviv RI,
    2. Mandelcorn J,
    3. Chakraborty S,
    4. et al
    . Alberta Stroke Program Early CT Scoring of CT perfusion in early stroke visualization and assessment. AJNR Am J Neuroradiol 2007; 28: 1975– 80
    Abstract/FREE Full Text
  42. 42.↵
    1. Kloska SP,
    2. Dittrich R,
    3. Fischer T,
    4. et al
    . Perfusion CT in acute stroke: prediction of vessel recanalization and clinical outcome in intravenous thrombolytic therapy. Eur Radiol 2007; 17: 2491– 98
    CrossRefPubMed
  43. 43.↵
    1. Lin K,
    2. Rapalino O,
    3. Law M,
    4. et al
    . Accuracy of the Alberta Stroke Program Early CT Score during the first 3 hours of middle cerebral artery stroke: comparison of noncontrast CT, CT angiography source images, and CT perfusion. AJNR Am J Neuroradiol 2008; 29: 931– 36
    Abstract/FREE Full Text
  44. 44.↵
    1. Parsons MW,
    2. Pepper EM,
    3. Chan V,
    4. et al
    . Perfusion computed tomography: prediction of final infarct extent and stroke outcome. Ann Neurol 2005; 58: 672– 79
    CrossRefPubMed
  45. 45.↵
    1. Nagahori T,
    2. Hirashima Y,
    3. Umemura K,
    4. et al
    . Supratentorial dynamic computed tomography for the diagnosis of vertebrobasilar ischemic stroke. Neurol Med Chir (Tokyo) 2004; 44: 105– 10, discussion 110–11
    CrossRefPubMed
  46. 46.↵
    1. Mori S,
    2. Obata T,
    3. Nakajima N,
    4. et al
    . Volumetric perfusion CT using prototype 256-detector row CT scanner: preliminary study with healthy porcine model. AJNR Am J Neuroradiol 2005; 26: 2536– 41
    Abstract/FREE Full Text
  47. 47.↵
    1. Mori S,
    2. Endo M,
    3. Nishizawa K,
    4. et al
    . Comparison of patient doses in 256-slice CT and 16-slice CT scanners. Br J Radiol 2006; 79: 56– 61
    Abstract/FREE Full Text
  48. 48.↵
    1. Sheikh K,
    2. Schipper MJ,
    3. Hoeffner EG
    . Feasibility of superficial temporal artery as the input artery for cerebral perfusion CT. AJR Am J Roentgenol 2009; 192: W321– 29
    CrossRefPubMed
  49. 49.↵
    1. Sanelli PC,
    2. Lev MH,
    3. Eastwood JD,
    4. et al
    . The effect of varying user-selected input parameters on quantitative values in CT perfusion maps. Acad Radiol 2004; 11: 1085– 92
    CrossRefPubMed
  50. 50.↵
    1. Murray AD,
    2. Staff RT,
    3. Shenkin SD,
    4. et al
    . Brain white matter hyperintensities: relative importance of vascular risk factors in nondemented elderly people. Radiology 2005; 237: 251– 57
    CrossRefPubMed
  51. 51.↵
    1. Hatazawa J,
    2. Shimosegawa E,
    3. Satoh T,
    4. et al
    . Subcortical hypoperfusion associated with asymptomatic white matter lesions on magnetic resonance imaging. Stroke 1997; 28: 1944– 47
    Abstract/FREE Full Text
  52. 52.↵
    1. O'Sullivan M,
    2. Lythgoe DJ,
    3. Pereira AC,
    4. et al
    . Patterns of cerebral blood flow reduction in patients with ischemic leukoaraiosis. Neurology 2002; 59: 321– 26
    Abstract/FREE Full Text
  53. 53.↵
    1. Huynh TJ,
    2. Murphy B,
    3. Pettersen JA,
    4. et al
    . CT perfusion quantification of small-vessel ischemic severity. AJNR Am J Neuroradiol 2008; 29: 1831– 36
    Abstract/FREE Full Text
  54. 54.↵
    1. Waaijer A,
    2. van der Schaaf IC,
    3. Velthuis BK,
    4. et al
    . Reproducibility of quantitative CT brain perfusion measurements in patients with symptomatic unilateral carotid artery stenosis. AJNR Am J Neuroradiol 2007; 28: 927– 32
    Abstract/FREE Full Text
  55. 55.↵
    1. Turk AS,
    2. Grayev A,
    3. Rowley HA,
    4. et al
    . Variability of clinical CT perfusion measurements in patients with carotid stenosis. Neuroradiology 2007; 49: 955– 61
    CrossRefPubMed
  56. 56.↵
    1. Huang BY,
    2. Castillo M
    . Radiological reasoning: extracranial causes of unilateral decreased brain perfusion. AJR Am J Roentgenol 2007; 189: S49– 54
    CrossRefPubMed
  57. 57.↵
    1. Waaijer A,
    2. van Leeuwen MS,
    3. van Osch MJ,
    4. et al
    . Changes in cerebral perfusion after revascularization of symptomatic carotid artery stenosis: CT measurement. Radiology 2007; 245: 541– 48
    CrossRefPubMed
  58. 58.↵
    1. Neumann-Haefelin T,
    2. Wittsack HJ,
    3. Fink GR,
    4. et al
    . Diffusion- and perfusion-weighted MRI: influence of severe carotid artery stenosis on the DWI/PWI mismatch in acute stroke. Stroke 2000; 31: 1311– 17
    Abstract/FREE Full Text
  59. 59.↵
    1. Soares BP,
    2. Dankbaar JW,
    3. Bredno J,
    4. et al
    . Automated versus manual post-processing of perfusion-CT data in patients with acute cerebral ischemia: influence on interobserver variability. Neuroradiology 2009; 51: 445– 51
    CrossRefPubMed
  60. 60.↵
    1. Kang KH,
    2. Kim HS,
    3. Kim SY
    . Quantitative cerebrovascular reserve measured by acetazolamide-challenged dynamic CT perfusion in ischemic adult Moyamoya disease: initial experience with angiographic correlation. AJNR Am J Neuroradiol 2008; 29: 1487– 93
    Abstract/FREE Full Text
  61. 61.↵
    1. Smith LM,
    2. Elkins JS,
    3. Dillon WP,
    4. et al
    . Perfusion-CT assessment of the cerebrovascular reserve: a revisit to the acetazolamide challenges. J Neuroradiol 2008; 35: 157– 64
    CrossRefPubMed
  62. 62.↵
    1. Rim NJ,
    2. Kim HS,
    3. Shin YS,
    4. et al
    . Which CT perfusion parameter best reflects cerebrovascular reserve? Correlation of acetazolamide-challenged CT perfusion with single-photon emission CT in Moyamoya patients. AJNR Am J Neuroradiol 2008; 29: 1658– 63
    Abstract/FREE Full Text
  63. 63.↵
    1. Wintermark M,
    2. Dillon WP,
    3. Smith WS,
    4. et al
    . Visual grading system for vasospasm based on perfusion CT imaging: comparisons with conventional angiography and quantitative perfusion CT. Cerebrovasc Dis 2008; 26: 163– 70
    CrossRefPubMed
  64. 64.↵
    1. Laslo AM,
    2. Eastwood JD,
    3. Pakkiri P,
    4. et al
    . CT perfusion-derived mean transit time predicts early mortality and delayed vasospasm after experimental subarachnoid hemorrhage. AJNR Am J Neuroradiol 2008; 29: 79– 85
    Abstract/FREE Full Text
  65. 65.↵
    1. Nogueira RG,
    2. Lev MH,
    3. Roccatagliata L,
    4. et al
    . Intra-arterial nicardipine infusion improves CT perfusion-measured cerebral blood flow in patients with subarachnoid hemorrhage-induced vasospasm. AJNR Am J Neuroradiol 2009; 30: 160– 64. Epub 2008 Oct 22
    Abstract/FREE Full Text
  66. 66.↵
    1. Majoie CB,
    2. van Boven LJ,
    3. van de Beek D,
    4. et al
    . Perfusion CT to evaluate the effect of transluminal angioplasty on cerebral perfusion in the treatment of vasospasm after subarachnoid hemorrhage. Neurocrit Care 2007; 6: 40– 44
    CrossRefPubMed
  67. 67.↵
    1. Carlson AP,
    2. Yonas H
    . Radiographic assessment of vasospasm after aneurysmal subarachnoid hemorrhage: the physiological perspective. Neurol Res 2009; 31: 593– 604
    CrossRefPubMed
  68. 68.↵
    1. Zubkov AY,
    2. Rabinstein AA
    . Medical management of cerebral vasospasm: present and future. Neurol Res 2009; 31: 626– 31
    CrossRefPubMed
  69. 69.↵
    1. Royter V,
    2. Paletz L,
    3. Waters MF
    . Stroke vs. status epilepticus: a case report utilizing CT perfusion. J Neurol Sci 2008; 266: 174– 76
    CrossRefPubMed
  70. 70.↵
    1. Masterson K,
    2. Vargas MI,
    3. Delavelle J
    . Postictal deficit mimicking stroke: role of perfusion CT. J Neuroradiol 2009; 36: 48– 51. Epub 2008 Oct 5
    CrossRefPubMed
  71. 71.↵
    1. Hauf M,
    2. Slotboom J,
    3. Nirkko A,
    4. et al
    . Cortical regional hyperperfusion in nonconvulsive status epilepticus measured by dynamic brain perfusion CT. AJNR Am J Neuroradiol 2009; 30: 693– 98
    Abstract/FREE Full Text
  • Copyright © American Society of Neuroradiology
View Abstract
PreviousNext
Back to top

In this issue

American Journal of Neuroradiology: 31 (9)
American Journal of Neuroradiology
Vol. 31, Issue 9
1 Oct 2010
  • Table of Contents
  • Index by author
Advertisement
Print
Download PDF
Email Article

Thank you for your interest in spreading the word on American Journal of Neuroradiology.

NOTE: We only request your email address so that the person you are recommending the page to knows that you wanted them to see it, and that it is not junk mail. We do not capture any email address.

Enter multiple addresses on separate lines or separate them with commas.
Evaluation of CT Perfusion in the Setting of Cerebral Ischemia: Patterns and Pitfalls
(Your Name) has sent you a message from American Journal of Neuroradiology
(Your Name) thought you would like to see the American Journal of Neuroradiology web site.
CAPTCHA
This question is for testing whether or not you are a human visitor and to prevent automated spam submissions.
Cite this article
Y.W. Lui, E.R. Tang, A.M. Allmendinger, V. Spektor
Evaluation of CT Perfusion in the Setting of Cerebral Ischemia: Patterns and Pitfalls
American Journal of Neuroradiology Oct 2010, 31 (9) 1552-1563; DOI: 10.3174/ajnr.A2026

Citation Manager Formats

  • BibTeX
  • Bookends
  • EasyBib
  • EndNote (tagged)
  • EndNote 8 (xml)
  • Medlars
  • Mendeley
  • Papers
  • RefWorks Tagged
  • Ref Manager
  • RIS
  • Zotero
0 Responses
Respond to this article
Share
Bookmark this article
Evaluation of CT Perfusion in the Setting of Cerebral Ischemia: Patterns and Pitfalls
Y.W. Lui, E.R. Tang, A.M. Allmendinger, V. Spektor
American Journal of Neuroradiology Oct 2010, 31 (9) 1552-1563; DOI: 10.3174/ajnr.A2026
del.icio.us logo Twitter logo Facebook logo Mendeley logo
  • Tweet Widget
  • Facebook Like
  • Google Plus One
Purchase

Jump to section

  • Article
    • Abstract
    • Abbreviations
    • Perfusion Patterns
    • Technical Pitfalls
    • Diagnostic Pitfalls
    • Conclusions
    • References
  • Figures & Data
  • Info & Metrics
  • Responses
  • References
  • PDF

Related Articles

  • No related articles found.
  • PubMed
  • Google Scholar

Cited By...

  • Quantification of Infarct Core Volume in Patients with Acute Ischemic Stroke Using Cerebral Metabolic Rate of Oxygen in CT Perfusion
  • Optimal Perfusion Computed Tomographic Thresholds for Ischemic Core and Penumbra Are Not Time Dependent in the Clinically Relevant Time Window
  • Vertebral Artery Hypoplasia: Frequency and Effect on Cerebellar Blood Flow Characteristics
  • Differences in CT Perfusion Summary Maps for Patients with Acute Ischemic Stroke Generated by 2 Software Packages
  • CT perfusion guided delayed recanalization with favorable outcome in pediatric stroke
  • C-Arm CT Measurement of Cerebral Blood Volume Using Intra-Arterial Injection of Contrast Medium: An Experimental Study in Canines
  • Acute Stroke Intervention
  • Crossref (107)
  • Google Scholar

This article has been cited by the following articles in journals that are participating in Crossref Cited-by Linking.

  • Challenging the Ischemic Core Concept in Acute Ischemic Stroke Imaging
    Mayank Goyal, Johanna M. Ospel, Bijoy Menon, Mohammed Almekhlafi, Mahesh Jayaraman, Jens Fiehler, Marios Psychogios, Rene Chapot, Aad van der Lugt, Jianmin Liu, Pengfei Yang, Ronit Agid, Werner Hacke, Melanie Walker, Urs Fischer, Negar Asdaghi, Ryan McTaggart, Padma Srivastava, Raul G. Nogueira, Jacques Moret, Jeffrey L. Saver, Michael D. Hill, Diederik Dippel, Marc Fisher
    Stroke 2020 51 10
  • Computed tomography and magnetic resonance perfusion imaging in ischemic stroke: Definitions and thresholds
    Krishna A. Dani, Ralph G.R. Thomas, Francesca M. Chappell, Kirsten Shuler, Mary J. MacLeod, Keith W. Muir, Joanna M. Wardlaw
    Annals of Neurology 2011 70 3
  • Vertebral Artery Hypoplasia
    Kolja M. Thierfelder, Alena B. Baumann, Wieland H. Sommer, Marco Armbruster, Christian Opherk, Hendrik Janssen, Maximilian F. Reiser, Andreas Straube, Louisa von Baumgarten
    Stroke 2014 45 5
  • Clinical Utility of Quantitative Imaging
    Andrew B. Rosenkrantz, Mishal Mendiratta-Lala, Brian J. Bartholmai, Dhakshinamoorthy Ganeshan, Richard G. Abramson, Kirsteen R. Burton, John-Paul J. Yu, Ernest M. Scalzetti, Thomas E. Yankeelov, Rathan M. Subramaniam, Leon Lenchik
    Academic Radiology 2015 22 1
  • CT for Treatment Selection in Acute Ischemic Stroke: A Code Stroke Primer
    Christopher A. Potter, Achala S. Vagal, Mayank Goyal, Diego B. Nunez, Thabele M. Leslie-Mazwi, Michael H. Lev
    RadioGraphics 2019 39 6
  • Imaging of Stroke: Part 1, Perfusion CT???Overview of Imaging Technique, Interpretation Pearls, and Common Pitfalls
    Andrew Mark Allmendinger, Elizabeth R. Tang, Yvonne W. Lui, Vadim Spektor
    American Journal of Roentgenology 2012 198 1
  • Differences in CT Perfusion Summary Maps for Patients with Acute Ischemic Stroke Generated by 2 Software Packages
    F. Fahmi, H.A. Marquering, G.J. Streekstra, L.F.M. Beenen, B.K. Velthuis, E. VanBavel, C.B. Majoie
    American Journal of Neuroradiology 2012 33 11
  • Intracerebral hemorrhage secondary to intravenous and endovascular intraarterial revascularization therapies in acute ischemic stroke: an update on risk factors, predictors, and management
    Maxim Mokin, Peter Kan, Tareq Kass-Hout, Adib A. Abla, Travis M. Dumont, Kenneth V. Snyder, L. Nelson Hopkins, Adnan H. Siddiqui, Elad I. Levy
    Neurosurgical Focus 2012 32 4
  • Convolutional Neural Network-Based Robust Denoising of Low-Dose Computed Tomography Perfusion Maps
    Venkata S. Kadimesetty, Sreedevi Gutta, Sriram Ganapathy, Phaneendra K. Yalavarthy
    IEEE Transactions on Radiation and Plasma Medical Sciences 2019 3 2
  • Reliability, Reproducibility and Prognostic Accuracy of the Alberta Stroke Program Early CT Score on CT Perfusion and Non-Contrast CT in Hyperacute Stroke
    Jillian Naylor, Leonid Churilov, Ziyuan Chen, Miriam Koome, Neil Rane, Bruce C.V. Campbell
    Cerebrovascular Diseases 2017 44 3-4

More in this TOC Section

  • Mechanisms of Healing in Coiled Intracranial Aneurysms: A Review of the Literature
  • Ultra-High-Field MR Neuroimaging
  • 4D-CTA in Neurovascular Disease: A Review
Show more Review Articles

Similar Articles

Advertisement

Indexed Content

  • Current Issue
  • Accepted Manuscripts
  • Article Preview
  • Past Issues
  • Editorials
  • Editor's Choice
  • Fellows' Journal Club
  • Letters to the Editor
  • Video Articles

Cases

  • Case Collection
  • Archive - Case of the Week
  • Archive - Case of the Month
  • Archive - Classic Case

More from AJNR

  • Trainee Corner
  • Imaging Protocols
  • MRI Safety Corner

Multimedia

  • AJNR Podcasts
  • AJNR Scantastics

Resources

  • Turnaround Time
  • Submit a Manuscript
  • Submit a Video Article
  • Submit an eLetter to the Editor/Response
  • Manuscript Submission Guidelines
  • Statistical Tips
  • Fast Publishing of Accepted Manuscripts
  • Graphical Abstract Preparation
  • Imaging Protocol Submission
  • Evidence-Based Medicine Level Guide
  • Publishing Checklists
  • Author Policies
  • Become a Reviewer/Academy of Reviewers
  • News and Updates

About Us

  • About AJNR
  • Editorial Board
  • Editorial Board Alumni
  • Alerts
  • Permissions
  • Not an AJNR Subscriber? Join Now
  • Advertise with Us
  • Librarian Resources
  • Feedback
  • Terms and Conditions
  • AJNR Editorial Board Alumni

American Society of Neuroradiology

  • Not an ASNR Member? Join Now

© 2025 by the American Society of Neuroradiology All rights, including for text and data mining, AI training, and similar technologies, are reserved.
Print ISSN: 0195-6108 Online ISSN: 1936-959X

Powered by HighWire