
Abstract
BACKGROUND AND PURPOSE: Although NAA is often used as a marker of neural integrity and health in different neurologic disorders, the temporal behavior of WBNAA is not well characterized. Our goal therefore was to establish its normal variations in a cohort of healthy adults over typical clinical trial periods.
MATERIALS AND METHODS: Baseline amount of brain NAA, QNAA, was obtained with nonlocalizing proton MR spectroscopy from 9 subjects (7 women, 2 men; 31.2 ± 5.6 years old). QNAA was converted into absolute millimole amount by using phantom-replacement. The WBNAA concentration was derived by dividing QNAA with the brain parenchyma volume, VB, segmented from MR imaging. Temporal variations were determined with 4 annual scans of each participant.
RESULTS: The distribution of WBNAA levels was not different among time points with respect to the mean, 12.1 ± 1.5 mmol/L (P > .6), nor was its intrasubject change (coefficient of variation = 8.6%) significant between any 2 scans (P > .5). There was a small (0.2 mL) but significant (P = .05) annual VB decline.
CONCLUSIONS: WBNAA is stable over a 3-year period in healthy adults. It qualifies therefore as a biomarker for global neuronal loss and dysfunction in diffuse neurologic disorders that may be well worth considering as a secondary outcome measure candidate for clinical trials.
Abbreviations
- CV
- coefficient of variation
- GM
- gray matter
- 1H-MRS
- proton MR spectroscopy
- MPRAGE
- magnetization-prepared rapid acquisition of gradient echo
- NAA
- N-acetylaspartate
- QNAA
- absolute amount of NAA (millimoles)
- SNR
- signal intensity–to-noise ratio
- SR
- reference NAA peak area
- SS
- subject NAA peak area
- VOI
- volume of interest
- VR180°
- reference transmitter voltage
- VS180°= subject transmitter voltage; WBNAA
- whole-brain NAA concentration
- WM
- white matter
The biochemical information obtained from 1H-MR spectroscopy is often being combined with the anatomic information from conventional MR imaging to provide a more accurate snapshot of a variety of neurologic disorders.1–3 This is done via the levels of several 1H-MR spectroscopy–detectable brain metabolites used as surrogate markers,4,5 key among which is NAA, the second most abundant amino acid derivative in the mammalian brain.6–8 Due to its near-exclusive localization to neurons and their processes, NAA is regarded as a marker for their health and density,9 and its level has been reported to decline in all neurodegenerative central nervous system disorders in adults.10,11
Due to the chronic nature of these diseases, they are often studied serially.12–14 The cost and complexity of such studies in humans, however, frequently limit their duration to a few years, with many months between samples.15 Because the NAA level in healthy subjects is the implicit reference for the 1H-MR spectroscopy component of such studies, it is important to establish its temporal course in that population. This is typically done, out of convenience, by cross-sectional averaging, with the assumption of neurologic stability.16,17
Small single-voxel, or 2D multivoxel VOIs located over the MR imaging–visible pathology are suited for 1H-MR spectroscopy studies of focal diseases.18–20 Even the 3D MR spectroscopic imaging methods that are recently becoming more prevalent, especially for diffuse or multifocal disorders, rarely cover >50% of the brain. Due to their restricted coverage, these techniques require image guidance that subjects them to several intrinsic limitations, albeit less so than smaller VOI studies: 1) they must assume that changes occur only at MR imaging–visible pathologies; 2) although registration programs are available, misregistration errors can still confound serial studies; and 3) to eliminate lipid contamination from bone marrow and subcutaneous adipose tissue, cortical areas must be avoided or examined separately and with smaller VOIs, which can be time- and labor-intensive.21 Fortunately, WBNAA quantification, a short, simple, and easily implemented sequence, addresses all of these issues by providing global concentration (at a cost of localization). It has been shown to decrease cross-sectionally in several diffuse brain disorders while remaining stable in controls, as reviewed recently.22
Although cross-sectional reproducibility is a necessary condition for WBNAA to be used as a surrogate marker for widespread neural loss in diffuse neurologic diseases, it is by itself insufficient. To attain that utility, the normal temporal variations in the healthy brain also must be established. Thus, here we report on the WBNAA concentrations obtained both cross-sectionally and serially with annual scans in a cohort of healthy individuals over 3 years from baseline.
Materials and Methods
Human Subjects
Nine healthy subjects (7 women, 2 men; 31.2 ± 5.6 years old [range, 24–43 years]) were recruited for this study. Their “healthy” status was based on negative answers to a questionnaire listing 28 neurologic disorders before the examination and an MR imaging deemed “unremarkable” by a neuroradiologist afterward. MR imaging and WBNAA were performed on each subject at enrollment and 12, 24, and 36 months afterward. All gave Institutional Review Board–approved written informed consent, and the study was Health Insurance Portability and Accountability Act compliant.
MR Imaging: Brain Volumetry
All experiments were done in a 3T whole-body MR scanner (Trio; Siemens, Erlangen, Germany) by using a TEM3000 circularly polarized transmit-receive head-coil (MRInstruments, Minneapolis, Minnesota). After each subject's placement head-first supine into the magnet, we used a chemical shift imaging–based automatic shim procedure to adjust the scanner's first and second order shims to a consistent 27 ± 3 Hz full width at half maximum whole-head water line width in 3–5 minutes.23 Sagittal T1-weighted MPRAGE: TE/TR/TI = 2.6/1360/800 ms; 160 sections, 1.0 mm thick each, over a 256 × 256-mm2 FOV with a 256 × 256 matrix, followed for brain tissue volume, VB, estimation. GM, WM, and CSF were segmented from the MPRAGE images by using SPM2 segmentation (Wellcome Department of Cognitive Neurology, Institute of Neurology, London, United Kingdom).24,25 The resultant probabilistic GM and WM “masks” for each section were summed on a pixel-by-pixel basis by using our in-house software to yield VB.
MR Spectroscopy: WBNAA Quantification
The whole-head 1H spectrum was obtained by using a nonlocalizing TE/TI/TR = 0/0.94/10-second sequence,26 where the role of the long TR ≫ T1 and short TE ≈ 0 is to ensure insensitivity to possible regional T1 and T2 variations, which are typically unknown, especially in pathologies. The subject's whole-head 1H spectrum was phased manually by using an in-house IDL software (RSI, Boulder, Colorado), and the edges of the Lorentzian shape of the NAA peak were visually identified over the broad baseline of the macromolecules and other N-acetyl–bearing species that also resonate at 2.02 ppm.27 The identified NAA peak area, SS, was then integrated by the program, as shown in Fig 1. Six operators performed this task, each blinded to the other 5 operators. An operator's result more than twice the SD from the group mean for that subject was rejected. If more than 2 were rejected, that set was deemed to be of insufficient quality and excluded. Otherwise, the 4–6 “good” results are averaged into S̄ and converted into absolute amounts, QNAA, by phantom replacement against a reference 3-L sphere of 1.5 × 10⁻² moles of NAA in water by using subject and reference NAA peaks, SS and SR, as follows:26
where VR180° and VS180° are the transmitter voltages into 50 Ω for nonselective 1-ms 180° inversion pulses on the reference and subject, respectively, reflecting their relative coil loading.

Left, Sample annual serial T1-weighted MPRAGE images from the same subject overlaid with their brain parenchyma mask (green) obtained by using SPM2 segmentation. Note the mask correspondence with the underlying anatomy. Right, Serial whole-head 1H-MR spectroscopy spectra from the same subject at baseline and 12, 24, and 36 months later. Note the high SNR in this spectrum, despite a short 2.6-minute acquisition (due to the large volume) and the similarities among the 4 serial spectra, despite minor shimming differences; more importantly, note that the peak areas, SS, are all within ±7%. Also note that although other brain metabolites are also visible in the spectra, eg, choline (Cho), glutamate (Glu), and creatine (Cr), only the NAA is implicitly localized to the brain by its biochemistry due to the nonlocalizing sequence used.
It is noteworthy that although several brain metabolites are visible in the whole-head spectrum (Fig 1), only the NAA is implicitly localized by its biochemistry exclusively to neuronal cells, ie, to just the brain.28,29 The presence of other metabolites (eg, creatine, choline, glutamate) in all other tissue types precludes determining the brain's contribution to their signal intensity.
To account for natural brain size variations, the global NAA concentration, a specific metric independent of brain size, and therefore suitable for cross-sectional comparison, was used:

Its intra- and intersubject variability has been shown previously at better than ±7%.21,26,30
Statistical Analyses
Mixed model analysis of variance was used to compare time points with respect to the intersubject mean of WBNAA and VB. WBNAA and VB were used as dependent variables in separate analyses, with time included in the model as a classification factor. The error variance was allowed to differ across time points to avoid the unnecessary assumption of variance homogeneity. Mixed model regression was used to estimate the rate of change in WBNAA and VB over time for each individual subject as well as the mean rate of change for the entire group. For all mixed model analyses, an autoregressive correlation structure was used to account for statistical dependencies among the longitudinal observations recorded for each subject. That is, observations were assumed correlated only when acquired from the same subject and the strength of correlation between 2 observations was inversely related to the time between them.
Restricted maximum likelihood estimation of variance components in a random effects model was used to estimate the intrasubject and intersubject variance components of WBNAA. These estimates were used to compute the intrasubject and intersubject CV as the square root of the relevant variance component expressed as a percentage of the overall mean of WBNAA.
The estimated between- and within-subject variance components and the observed correlation between longitudinal measures on a subject were used to compute the precision that can be expected when the yearly rate of WBNAA change is estimated by using a linear mixed model regression analysis over K equally spaced annual time points over 4 or 6 years for each of N subjects. The computation was based on the assumption that correlation between consecutive WBNAA assessments is a nonincreasing function of the time between them; ie, they are more likely to be similar when taken closer together on a given person. This permitted a determination of the number of subjects that would be needed to detect any specific annual rate of WBNAA change with either 80% or 90% statistical power at the 2-sided 5% significance level.
Results
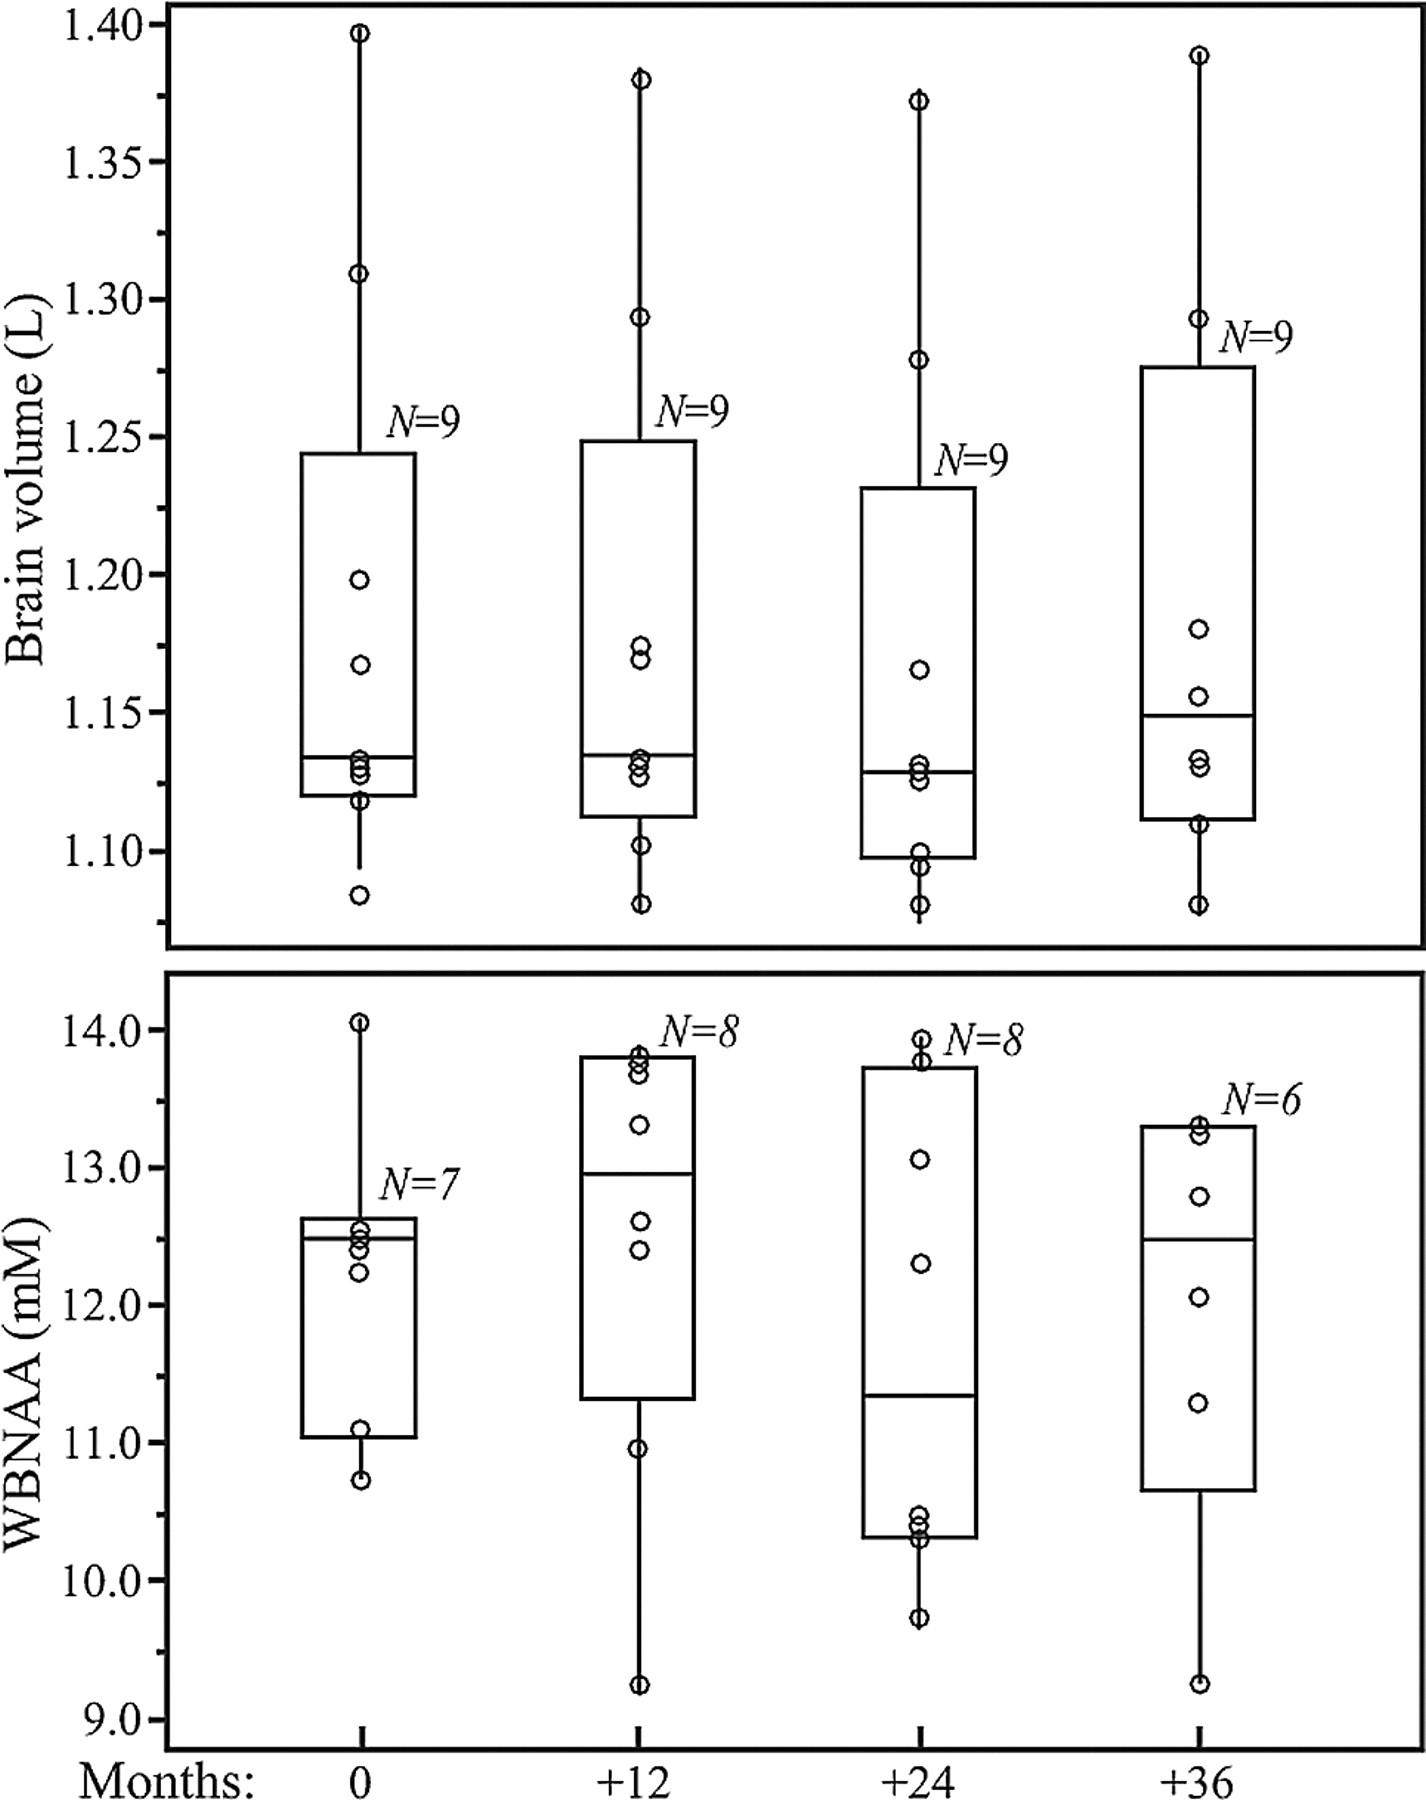
Sample whole-head brain 1H spectra from 4 time points of one subject: baseline and 12, 24, and 36 months are shown in Fig 1. Boxplots of the VB and WBNAA concentrations of the entire cohort are shown in Fig 2. At each time point, 1 to 3 WBNAA datasets were excluded (not consistently of the same subjects) due to failure of the quality criterion described above. Intrasubject VB, shown in Fig 2, changed by an annual average of −0.2 mL, which, though small in magnitude, represented a significant decline (P = .05). WBNAA, shown in Fig 2, exhibited similar mean NAA levels throughout, with average ± SD of 12.7 ± 1.4, 12.9 ± 1.9, 11.9 ± 1.8, and 12.2 ± 2.1 mmol/L at baseline and subsequent annual follow-ups. Its overall mean was 12.1 ± 1.5 mmol/L, with an intersubject CV of 9.8%, similar to the ∼10% reported previously.31

Boxplots showing the first, second (median), and third quartiles (box) ±95% (whiskers) of VB (top) and WBNAA (bottom) distributions at baseline and 12, 24, and 36 month follow-ups. Open circles (○) on each boxplot represent the individual subject's values for each metric at that time point. Note that all 4 WBNAA distributions are statistically indistinguishable (P > .5), whereas the VB values exhibit a small but significant group decline (P = .05).
The individual distribution of WBNAA values at baseline was not significantly different from the follow-up points with respect to its mean (P > .6), as shown in Fig 2. The intrasubject WBNAA level did not change significantly over the course of the study (CV = 8.6%; P > .5), nor did any individual's WBNAA decrease significantly (P > .2 for all). Based on the observed inter- and intrasubject variability mentioned above, Table 1 prescribes the number of subjects (N) needed to be studied annually K times, to detect various annual %-WBNAA change at either 80% or 90% statistical power. For example, n = 14 subjects are needed to detect a 6% WBNAA change, with K = 6 equally spaced annual measurements at 80% power.
Estimated sample sizes for 80% or 90% power at the 2-sided 5% significance level to detect specific yearly rates of WBNAA change using K equally spaced annual scans
Discussion
Quantitative MR metrics are now increasingly being used as biomarkers in clinical trials of neurologic disorders.32–35 Among the various requirements described recently by Miller5 of a biomarker for it to be considered as an “outcome measure” are its temporal reproducibility (in healthy control individuals) and by implication the conjugate metric—its sensitivity to significant change when applied to individual patients' disease progression or treatment response. Our goal therefore was to examine and quantify the intrasubject reproducibility of the WBNAA method in a group of healthy individuals assumed to be stable in their global brain NAA concentration, and based on that metric, to also infer its sensitivity to temporal change.
The results obtained demonstrate WBNAA's potential as a surrogate marker with respect to the reproducibility criterion. Specifically, that neural integrity, for which NAA is an accepted marker,36–38 is statistically stable (as expected) in healthy individuals to within the intrinsic precision of the method,26 over the course of 3 years, as shown in Fig 2. Because WBNAA is normalized to VB, stable to within ±0.25%, as shown in Fig 2 and reported in the literature,39–41 the inter- and intrasubject variabilities observed can be assigned entirely to QNAA; ie, they reflect the biologic and instrumental “noise” of the spectroscopy part of the measurement.
The normal temporal variations in healthy young and middle-aged adults (range, 18–50 years old) at 1.5T were already reported in a study that was, however, subject to a higher dropout rate.42 The present cohort was scanned more times (4 versus 2–3), and at a higher magnetic field (3T versus 1.5T), with less attrition (10% versus 50%), and at more regular time intervals (1 versus 2–3 years). The serial intrasubject variation observed in this study is similar to the 7%–11% reported previously42,43 that in turn was similar to the ∼6% obtainable with back-to-back scans.26
That the variations over a much longer time are of the same magnitude is another indication that they reflect the intrinsic precision of the method rather than real temporal fluctuations in an individual's brain physiology. This is further supported by the fact that the variations reported here at 3T are similar to those reported previously at 1.5T.26,42 Because the WBNAA sequence is “nonecho,” the NAA signal intensity suffers no T2-losses at either magnetic field; therefore, its (already high) SNR is doubled going from 1.5T to 3T. Because the SNR affects the measurement precision44 and because a factor of × 2 improvement 1.5T to 3T makes negligible difference, this indicates that biologic variations and not measurement noise dominate the overall variability. The similarity of the serial to the cross-sectional variability of the WBNAA suggests 1) that they reflect the intrinsic reproducibility of the method and 2) that within this approximately ±7% precision, the global NAA concentration in the brains of healthy subjects is comparable and temporally stable.
The WBNAA variations reported here potentially impact the design of studies that may use this metric as an outcome measure. Specifically, Table 1 determines the number of measurements, participants, and duration needed to detect a given magnitude of WBNAA change. It also illustrates possible trade-offs in these parameters given the study designer's recruitment, cost, and duration constraints. It is noteworthy, eg, that to determine a 6% WBNAA change, smaller than the 10%–20% reported for NAA in several neurologic disorders,12,45 with 80% power requires 4 annual time points (3 years) when using 25 subjects, a number that is usually available in a single site. For the higher 90% statistical power that is often desirable in drug trials to reduce the risk of type II errors, the recruitment needs only rise to 33 subjects. Moreover, because it had been shown that, due to the use of absolute quantification, the WBNAA distributions do not differ significantly among scanners,31 recruitment across multiple sites is not likely to detract from the general utility of Table 1.
Footnotes

-
This research was supported by National Institutes of Health grants EB01015 and NS050520.

Indicates open access to non-subscribers at www.ajnr.org
References
- Received September 21, 2010.
- Accepted after revision October 26, 2010.
- Copyright © American Society of Neuroradiology


