
Abstract
BACKGROUND AND PURPOSE: Cerebral hypoglycemia can result in reversible metabolic brain insults and can be associated with impaired diffusion disturbances. Our aim was to evaluate possible changes in DWI of the human brain during hyperacute short-term severe hypoglycemia.
MATERIALS AND METHODS: Ten individuals scheduled for a clinical IST were examined with DWI while the test was performed. Venous blood glucose was continuously measured, and sequential DWI sequences were performed without interruption. Hypoglycemia was terminated with intravenous glucose administration when glucose levels were at ≤2.0 mmol/L.
RESULTS: Blood glucose levels were lowered to a mean nadir of 1.75 ± 0.38 mmol/L. No alterations of cerebral diffusion could be observed in any individuals on DWI.
CONCLUSIONS: Hyperacute short-term severe hypoglycemia does not induce visible changes in DWI of the human brain.
Abbreviations
- A
- agitation
- ADC
- apparent diffusion coefficient
- BS
- blurred speech
- D
- drowsiness
- DA
- dysaesthesia
- DP
- dyspnea
- DWI
- diffusion-weighted imaging
- EEG
- electroencephalography
- FC
- feeling cold
- FG
- fatigue
- FLAIR
- fluid-attenuated inversion recovery
- H
- hunger
- IST
- insulin stress test
- IV
- impaired vision
- LC
- loss of consciousness
- LMC
- loss of mental concentration
- N
- nausea
- n.a.
- not applicable
- S
- sweating
- T
- tremor
- TH
- thirst
- V
- vertigo
The effect of hypoglycemia on the brain is well known, causing a wide range of vegetative and neurologic symptoms, such as alterations of mental status, seizures, paresis, coma, and death.
Hypoglycemia is seen in the context of numerous metabolic and medical diseases like neoplastic overproduction of endogenous insulin, a major illness like sepsis, Addison disease, or renal failure. However, severe hypoglycemia is seen most commonly in individuals with insulin- or sulfonylurea-treated diabetes mellitus. Hypoglycemia is also of importance in forensic medicine in cases of homicide or suicide attempts.
In type 1 diabetes, severe hypoglycemia is a frequent therapeutic side effect with approximately 2 episodes of mild hypoglycemia per week and an episode of severe, at least temporarily disabling, hypoglycemia approximately once a year. Epidemiologic data indicate that up to 4% of deaths in type 1 diabetes are associated with severe hypoglycemia.1 Some of these patients develop reduced sympathoadrenal responses causing “hypoglycemia unawareness,” which describes the state in which autonomic warning symptoms do not occur or are not recognized before neuroglycopenia develops.2 Therefore these patient are known to have a higher risk of having seizures or coma or requiring another person's assistance to recover from hypoglycemia.3
The rates of severe hypoglycemia in type 2 diabetes are approximately 10% of those in type 1 diabetes.4 In the U.K. Prospective Diabetes Study, the 6-year incidence of overall hypoglycemia in type 2 diabetes was 2.4% in participants with metformin therapy, 3.3% in the sulfonylurea-treated group, and 11.2% in the insulin therapy group, respectively.5 In a large survey in Germany, severe hypoglycemic events, treated by glucagon injection or glucose injection intravenously for example, were 6 episodes per 100 patients per year on the primary care level and 0.31 episodes per 100 patients per year in hospital populations.6 Severe hypoglycemic events in patients with type 2 diabetes on insulin therapy were 0.01 per 100 patients per year in Germany.
Despite the potentially fatal outcome of hypoglycemia, neuroimaging of this condition is not well-studied, with only a few reported cases.7–19 An overview is given in Table 1. A review of these cases reveals a possible association between reversible DWI lesions and elderly patients with diabetes, but, to our knowledge, a systematic investigation is still lacking. DWI of patients with acute hypoglycemia has shown high-intensity signals in numerous different locations of the brain like the internal capsules,7,8,11,14,15 hippocampus,12,16 basal ganglia,12 pons,17 splenium of the corpus callosum,9,13,15 corona radiata,8,9 and cortex of the frontal or parietal or occipital lobe.8,10,12,15,16,18,19 After correction of hypoglycemia, the high-intensity signals are reported to disappear within 2 hours20 and within 10 minutes in rats.21 Although the cortex, basal ganglia, and hippocampus seem to be the brain tissues most vulnerable to hypoglycemia,22 the underlying mechanism of the distribution pattern of the high-intensity signals remains unclear. Asymmetry of the lesions might be explained by the asynchronous onset of electrocerebral silence between the hemispheres.22
Reported location of hypoglycemic lesions based on DWI imaging of the cerebrum
Although with signal-intensity augmentation, cerebral hypoglycemia and cerebral ischemia exhibit similar findings in DWI, the underlying processes on a cellular basis are profoundly different in respect to their pathogenesis, indicating various therapeutic regimens used to protect cerebral integrity.
The purpose of this study was to evaluate the effect of short-term severe hypoglycemia on DWI of the brain in neurologically healthy individuals. Therefore, we formulated a hypothesis that severe hyperacute hypoglycemia of the brain induced by insulin administered within a standard clinical test may alter diffusion conditions at the cellular level and thus become visible on DWIs as signal-intensity increase or changes of ADC values.
Materials and Methods
Participants
Participants for this study were recruited in the Unit for Endocrinology and Metabolic Disorders of the Department of Internal Medicine III of the University Hospital, Jena, Germany, where all participants had been scheduled for a diagnostic IST. The highly standardized IST is widely used as a potent provocative test for assessing growth hormone and adrenocorticotropic hormone reserve in adults by means of an induced hypoglycemia. The IST, when performed by experienced medical staff, is a safe, effective, and reliable procedure.23 In some centers, the IST is performed by endocrine specialist nurses24; in our clinic however, the test is always performed by experienced physicians. The only change to the standard clinical routine IST procedure was the alteration of the environmental setting: The participants were asked days in advance whether they would agree to have the test performed in an MR imaging scanner instead of the standard examination room to obtain brain diffusion images during the IST.
After approval of the institutional ethics committee of the Friedrich-Schiller-University was granted, 10 participants (Table 2) were included (5 women, 5 men; median age, 41.5 years; range, 23–62 years). The group consisted of 3 patients with diabetes mellitus type I who had a history of several severe hypoglycemic episodes; these patients were scheduled for the IST to rule out/confirm the possibly dangerous diagnosis of hypoglycemia unawareness. Three patients included in the study had a known history of abnormal adrenal cortex function (adrenal insufficiency); they were scheduled for the IST to evaluate the extent of the adrenal insufficiency. Four more patients included in the study were scheduled for the IST to rule out any abnormal pituitary or adrenal cortex function, but they finally were found to be in good health with normal IST findings.
Subject data showing the duration of hypoglycemia, minimal blood glucose level, clinical symptoms, and visible DWI lesions
Exclusion criteria were the following: 1) history of neurologic, neurosurgical, or psychiatric disorders; 2) acute diseases; 3) multimorbidity; 4) MR imaging contraindications; 5) age younger than 18 years or older than 65 years; and 6) pregnancy. Written consent for participation in the study was obtained from each individual.
Experimental Design
Experimental sessions were started at 7:00 am. The IST was performed by a consultant in internal medicine. After an overnight fast, the participants were placed in the MR imaging scanner. An indwelling cannula for infusion of regular human insulin and glucose was placed in a superficial vein of the dorsum of 1 hand and a second cannula for collection of blood glucose samples, on the contralateral side. On-site testing of venous blood glucose was performed every 5 minutes to monitor hypoglycemia by using a quality-controlled glucometer (OneTouch; LifeScan, Milpitas, California). Venous blood samples were collected every 5 minutes in containers with fluoride to prevent glucose metabolism. Blood glucose was measured in these samples within 3 hours after collection with a quality-controlled laboratory method (Architect c8000; Abbott Laboratories, Abbott Park, Illinois). For induction of hypoglycemia, a single intravenous bolus of regular human insulin was given (Actrapid, Novo Nordisk, Bagsværd, Denmark; 0.15 IU per kilogram of body weight). Hypoglycemia was terminated with an intravenous bolus of 30 mL of glucose 40% as soon as the blood glucose level was at ≤2.0 mmol/L or the subject wished to abandon the trial due to vegetative symptoms. The subjects were continuously monitored by the consultant who was present in the scanner room while a neuroradiologist was constantly evaluating the obtained MR images.
MR Imaging
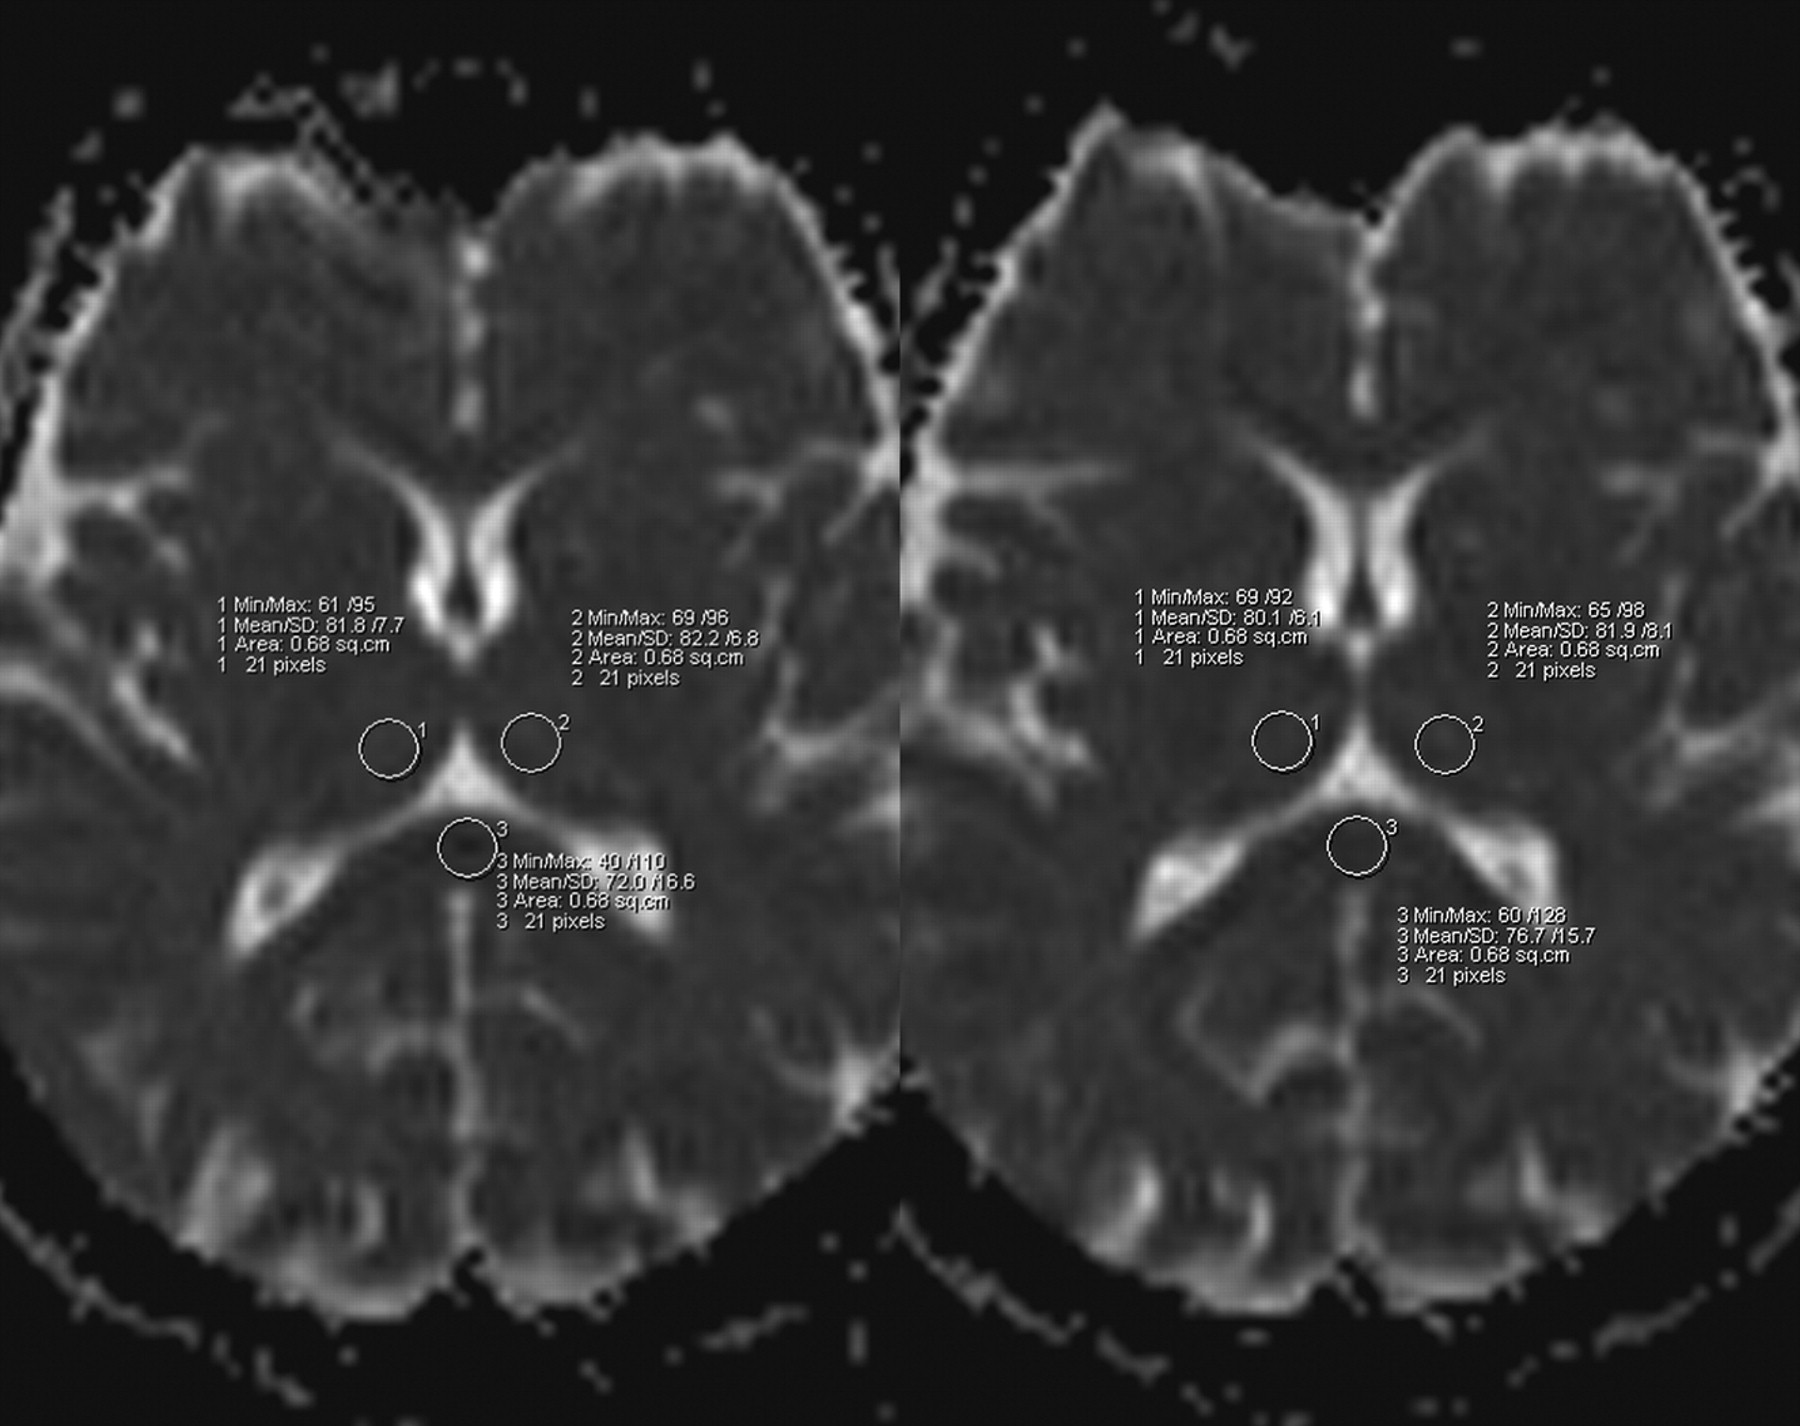
MR imaging was performed on a 1.5T whole-body MR imaging scanner (Magnetom Sonata; Siemens, Erlangen, Germany) equipped with echo-planar-imaging data capability designed to obtain rapid diffusion images. The study protocol included a DWI sequence (acquisition time, 114 seconds; TR, 4500 ms; TE, 107 ms; 25 sections; section thickness, 5.0 mm; matrix, 128 × 128). The DWI sequence was acquired with 2 different b-values (b = 0 s/mm2 and b = 1000 s/mm2). The diffusion gradients were applied in the x-, y-, and z-directions, and the acquired images were combined to form a single composite DWI (trace-weighted image). The ADCs were calculated for each pixel and composed in an ADC map. The ADC values were measured on the ADC map, which was calculated on the basis of b-values of 0, 500, and 1000 s/mm2. These ADC maps were calculated by using algorithms implemented within the Magnetom scanner software (Syngo, Siemens). The regions of interest were set as the circle with an area of 0.68 cm2. They were manually set for the bilateral thalamus and splenium according to Fig 1. We analyzed the last ADC map calculated in the normoglycemic state before insulin administration and the last ADC map calculated in hypoglycemic state before starting glucose infusion, which terminated the IST. Statistical analysis was performed with the Student t test for the comparison between the ADC values of normoglycemic and hypoglycemic states.

Example of region-of-interest setting on ADC maps. The circular region of interest of 0.68 cm2 was set for the bilateral thalamus and splenium. ADC values were calculated before (left image) and after (right image) insulin was administered.
All subjects were scanned with standard MR images in the transversal plane by using a T1-weighted spin-echo sequence (acquisition time, 180 seconds; TR, 500 ms; TE, 16 ms; 19 sections; section thickness, 6.0 mm; matrix, 256 × 256; FOV, 210 mm; flip angle, 70°), a proton- and T2-weighted turbo spin-echo (double-echo) sequence (acquisition time, 283 seconds; TR, 2900 ms; TE, 13 ms and 81 ms; 19 sections; section thickness, 6.0 mm; matrix, 256 × 256; FOV, 210 mm; flip angle, 150°), and a FLAIR sequence (acquisition time, 218 seconds; TR, 9000 ms; TE, 108 ms; 19 sections; section thickness, 6.0 mm; matrix, 256 × 256; FOV, 210 mm; flip angle, 150°) before hypoglycemia to rule out pathologic brain findings. During hypoglycemia, sequential DWI sequences were obtained without interruption, except the necessary loading time for the sequence parameters. The standardized protocol repeated 1 DWI scan as soon as the ongoing DWI scan had finished until the end of the IST. With an acquisition time of 114 seconds, we could obtain 5 scans within 10 minutes. The end of the IST was indicated by the consultant of internal medicine, who performed the IST in the scanner room.
Five minutes after normalization of blood glucose to values ≥4.0 mmol/L, 1 final DWI sequence and 1 final gadolinium-enhanced T1-weighted spin-echo sequence (after intravenous infusion of 0.1 mmol/kg of gadopentetate dimeglumine [Magnevist, Schering, Berlin, Germany]) were performed. The total scanning time per subject was between 2 and 3 hours, depending on the time needed to establish the individual subject's hypoglycemia. All MR images were independently assessed by 2 neuroradiologists blinded to the clinical information.
Results
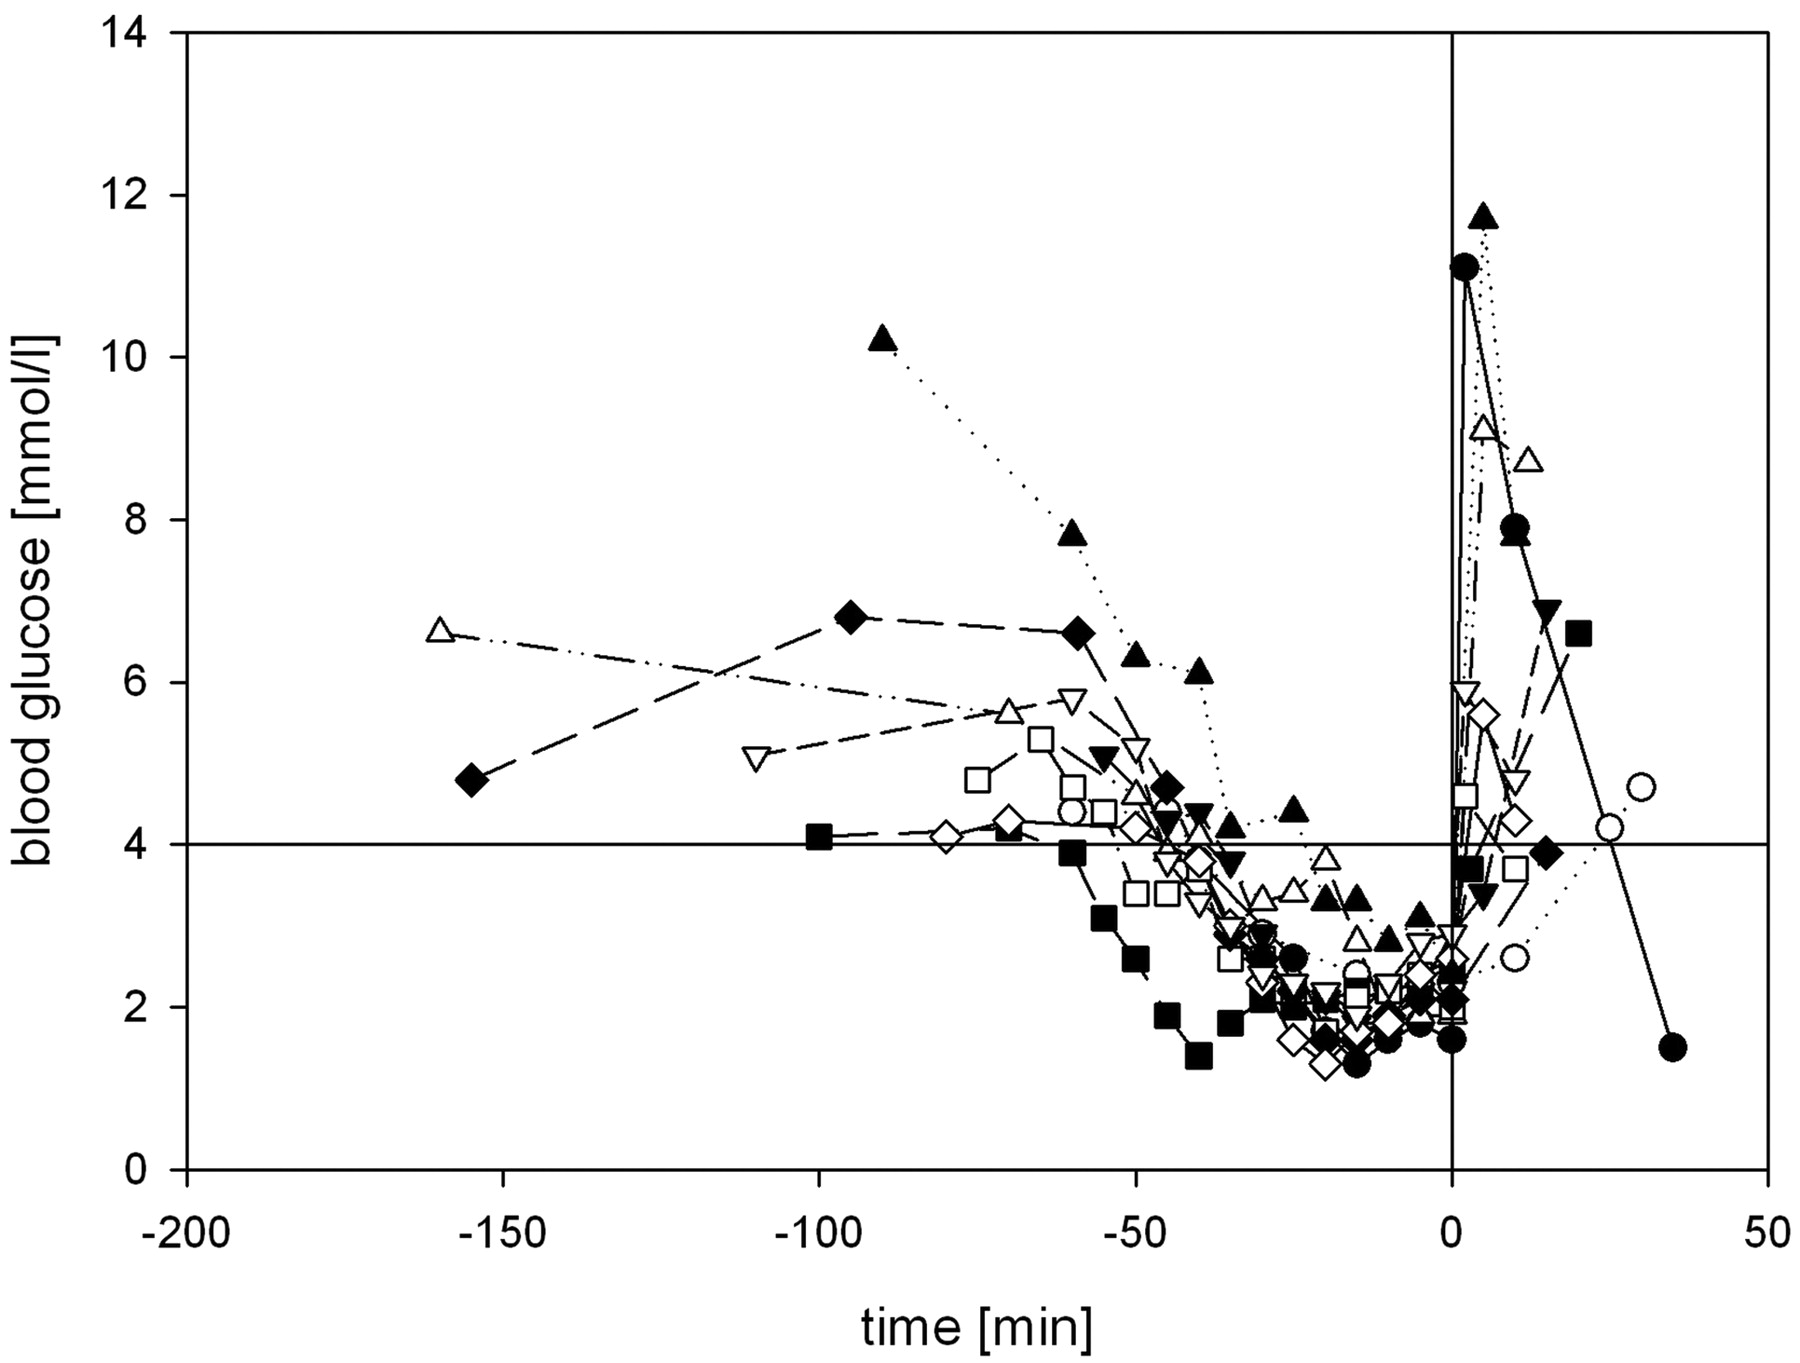
Severe hypoglycemia was established in all subjects: Blood glucose levels ≤4.0 mmol/L were achieved for 43.8 ± 10.9 minutes, ≤3.0 mmol/L for 31.5 ± 12.0 minutes, and ≤2.5 mmol/L for 20.5 ± 10.7 minutes. In 8 subjects, blood glucose was lowered to ≤2.0 mmol/L for 10 ± 5.3 minutes (Fig 2 ). All subjects developed clinical symptoms of neuroglycopenia or adrenal counter-regulation (Table 2). The mean nadir of blood glucose was 1.75 ± 0.38 mmol/L, ranging from 1.3 to 2.4 mmol/L (Fig 3 ). There was no difference in the nadir of hypoglycemia regarding sex (women, 1.82 mmol/L, versus men, 1.68 mmol/L). Two of 10 participants started developing neuroglycopenic symptoms at a blood glucose level of 2.8–3.0 mmol/L. The first onset of neuroglycopenic symptoms was observed at a mean blood glucose level of 2.51 ± 0.93 mmol/L.

Blood glucose levels of subjects during the procedure. The horizontal line indicates the lower threshold of physiologic postprandial blood glucose concentration (4.0 mmol/L); the vertical line indicates the end of hypoglycemia by administering 40 mL of glucose 40% intravenously.

Duration of hypoglycemia during DWI. The blood glucose level was lowered to <4.0 mmol/L for a mean of 43.8 ± 10.85 minutes for all subjects, to <3 mmol/L for 31.5 ± 12.0 minutes, to <2.5 mmol/L for 20.5 ± 10.7 minutes, and to a level <2.0 mmol/L for 10 ± 5.3 minutes.
Analyzing the DWIs, we observed no visible alterations of the DWIs and ADC maps during hypoglycemia in any individual (Table 3). The ADC measurements were stable. The mean ADC value of the splenium in normoglycemic state was 74.31 mm2/s × 10−6 ± 7.27 versus 74.18 mm2/s × 10−6 ± 7.54 in hypoglycemic state; statistical analysis showed no significant difference (P = .95). Analyzing the ADC values of the left and right thalamus showed similar results: The mean ADC value of the right thalamus in a normoglycemic state was 73.14 mm2/s × 10−6 ± 5.10, while the mean ADC value was 74.0 mm2/s × 10−6 ± 4.11 in a hypoglycemic state. Statistical analysis showed no significant difference (P = .17). The mean ADC value of the left thalamus in a normoglycemic state was 73.55 mm2/s × 10−6 ± 4.57, while the mean ADC value was 74.98 mm2/s × 10−6 ± 4.65 in a hypoglycemic state. Statistical analysis showed no significant difference (P = .09).
ADC values in different regions of interest before starting and before ending the hypoglycemic statea
The final contrast-enhanced T1-weighted sequence after hypoglycemia revealed no signs of blood-brain barrier leakage. The findings of the initially performed T2 and FLAIR scans were all normal.
Discussion
The physiologic postabsorptive blood glucose concentration range is 4.0–6.0 mmol/L.4 Although 3.9 mmol/L is commonly cited as the lower limit of normal blood glucose, there is no commonly accepted precise value of a blood glucose level defining the beginning of hypoglycemia. The American Diabetes Association reported in “Standards of Medical Care in Diabetes-2007,”25 a blood glucose level of 3.9 mmol/L as a glycemic threshold for hypoglycemia with the need of treatment. The glycemic threshold for neuroglycopenic symptoms and cognitive impairments is reported at 2.8–3.0 mmol/L.4 The Canadian Diabetes Association26 proposed a blood glucose level of 4.0 mmol/L as an operational clinical cutoff for hypoglycemia and classified hypoglycemia as “severe” when the blood glucose level is lower than 2.8 mmol/L, the individual requires the assistance of another person, or the patient may be unconscious.
In this study, a mild hypoglycemia was defined as a laboratory blood glucose measurement of ≤3.3 mmol/L without clinical symptoms of neuroglycopenia or adrenal counter-regulation (sweating, hunger, freezing, nausea, tremor, agitation, drowsiness, double vision, loss of mental concentration, fatigue, dysaesthesia, or blurred speech). Severe hypoglycemia was defined as a laboratory blood glucose measurement of ≤2.5 mmol/L and clinical symptoms of neuroglycopenia or adrenal counter-regulation.
Severe cerebral hypoglycemia with onset of neurologic symptoms is reported to be associated with diffusion disturbances, which could be visualized as hyperintense lesions in DWI in very different regions of the brain such as the internal capsules,7,8,11,14,15 hippocampus,12,16 basal ganglia,12 pons,17 splenium of the corpus callosum,9,13,15 corona radiata,8,9 and cortex of the frontal or parietal or occipital lobe.8,10,12,15,16,18,19 A summary is given in Table 2. The reported signal-intensity augmentation in DWI corresponds to a low diffusion value. In normal brain tissue, random water diffusion (Brownian motion) decreases the amplitude of the signal intensity due to phase incoherence. With cytotoxic edema, there is no net change in water content, only a change in its distribution. The amount of water within the cellular compartment, where the Brownian motion is restricted, increases. Phase coherence here is preserved, and there is more signal intensity recovered during the diffusion observation period, producing a high signal intensity.
Hypoglycemia constitutes a unique metabolic brain insult.27 Most knowledge of hypoglycemic effects on the brain is derived from animal studies.28–30 Although infarction and hypoglycemia exhibit similar findings on DWI, the neurochemical analyses reveal profound differences: Cellular redox systems are reduced in ischemia but are oxidized in hypoglycemia31; and brain pH is decreased in ischemia due to the formation of lactic acid but is elevated in hypoglycemia32 due to the formation of ammonia from deamination of amino acids, the absence of lactic acid, and the consumption of metabolic acid. In hypoglycemia, adenosine triphosphate levels are still more than one-third of normal29 but less than 5% in ischemia.33
Hypoglycemia only causes neuronal death during blood glucose levels ranging from 1.36 to 0.12 mmol/L, when EEG isoelectricity is established. Significant neuronal damage occurs after 30 minutes of electrocerebral silence.34 The onset of ionic and metabolic changes occurs abruptly at the onset of EEG isoelectricity, and neuronal damage is absent in hypoglycemia unless the EEG becomes isoelectric, regardless of the blood glucose level at which the EEG goes flat.34 Hypoglycemia kills neurons actively and not, as was assumed earlier, by depriving them of glucose. In hypoglycemia, the glycolysis is reduced, resulting in accumulation of oxaloacetate because there is little acetate with which to condense to form citrate. This shifts the aspartate-glutamate transaminase reaction toward aspartate. Aspartate is a known neurotoxin by virtue of its excitatory properties.35 The excitatory amino acid aspartate in tissue increases ≤400%30 and is massively released into the extracellular space, where aspartate levels increase up to 1500%36 and flood the excitatory amino acid receptors located on neuronal dendrites. The characteristic neuropathology is the destruction of dendrites due to the location of receptors. Calcium fluxes occur, and membrane breaks in the cell lead rapidly to neuronal necrosis. Selective neuronal necrosis results when cell membrane destruction spreads from dendrites to neuronal perikarya. Aspartate leads to selective neuronal necrosis predominantly in the cerebral cortex, caudoputamen, and hippocampus,37 thus offering a different lesion pattern compared with lesions caused by cerebral ischemia. Furthermore, hypoglycemia is generalized but not dependent on vascular territories, resulting in a distribution of lesions that does not follow any vascular territory.38
Other imaging modalities could also contribute to differentiating ischemia and hypoglycemia: MR spectroscopy, though it needs some time to be performed and analyzed, could possibly detect changing concentrations of lactic acid in ischemic brain tissue. Also perfusion imaging should contribute to the differentiation of hypoglycemia and ischemia: In ischemia, perfusion imaging is more likely to detect a perfusion deficit in the area where the diffusion disturbance is detected, visualizing the penumbra, whereas in hypoglycemia, it is not likely to depict a perfusion deficit.
This characteristic lesion pattern in hypoglycemia offers the possibility of distinguishing lesions of ischemic and hypoglycemic origin by using DWI of the brain. Even postmortem, it is sometimes possible to distinguish brain damage of hypoglycemic origin (eg, due to insulin overdose) and brain damage of ischemic origin. If prevailing symmetric superficial laminar necrosis of the cerebral cortex is demonstrable, then hypoglycemic brain damage is more likely,38 while symmetric superficial laminar necrosis after ischemia is less often seen.37 Considering the effect of glucose infusion may be an additional diagnostic tool because severe transient hypoglycemia causes reversible hyperintense lesions in humans8,9 and in animal studies,21 whereas ischemic hyperintense lesions should not disappear.
To our knowledge, our results demonstrate, for the first time, that neither hypoglycemia with a blood glucose level of <2.5 mmol/L for a duration of 20 minutes nor severe hypoglycemia of <2.0 mmol/L for 10 minutes induce visible changes in DWI of the human brain.
Our findings in humans are in concordance with the data from animal experiments, which show that serious brain damage does not occur in hypoglycemia until electrocerebral silence is present for at least several minutes. Neuronal death only appears after 30 minutes of EEG isoelectricity, and the attenuation of neuronal necrosis is positively related to the number of minutes of cerebral isoelectricity up to the maximum examined period of 60 minutes.34
Boyle et al39 reported that some patients with insulin-dependent diabetes mellitus might develop higher rates of glucose uptake in the brain during hypoglycemia, causing an unawareness of lower plasma glucose concentrations. It is known that the capillary respective plasma glucose levels do not always represent the cerebral glucose level. Glucose reaches the brain by crossing the blood-brain barrier by means of the specific glucose transport protein 1.40 When endothelial cells in capillaries in the brain are deprived of glucose, there is an associated increase in the transcription and translation of this protein,40,41 and the normal energy metabolism in the brain could potentially be maintained in the presence of lower systemic plasma glucose concentrations. In our study, during the examination, all participants did not show signs of an increased glucose uptake because all of them developed signs of physiologic counter-regulations with both autonomic and neuroglycopenic symptoms.
Lindstrom et al42 observed that severe hypoglycemia may cause cardiac arrhythmias like bradyarrhythmia, ventricular ectopic beats, ST-depression, and flattening of the T-wave, which hypothetically may also lead to diffusion disturbances visible in DWI of the human brain, presumably caused by cardiac microembolism. These ischemic lesions should not be reversible, when euglycemia is re-established. However the reversibility of hyperintense lesions in severe hypoglycemia in humans is reported by Aoki et al8 and Böttcher et al9 and in animal studies by Hasegawa et al.21
Our results confirm the hypothesis that visible alterations of brain tissue in DWI of the human brain are potentially induced not only by the severity of hypoglycemia but also by its duration. With respect to the high sensitivity of DWI in visualizing cytotoxic cell edema, whereas in cerebral ischemia high signal intensity occurs only within minutes after ischemia onset, we conclude that short-term severe hypoglycemia does not induce visible diffusion changes on DWI, assuming that on a cellular level, the metabolic transpositions are still compensable.
These findings are of major clinical relevance when assessing the impact of short-term severe hypoglycemia on the human brain in patients with diabetes, in whom this type of hypoglycemia is most typical and frequent.
We are well aware of the limitations of our study: First, the small number of participants may not be powered to detect rare DWI changes of acute hypoglycemia. Second, the group was not homogeneous with regard to their diagnosis but was homogeneous with regard to the neurologic status of the participants. Because we focused on the integrity of brain diffusion during acute severe hypoglycemia, the homogeneity of the neurologic status is of importance, while a certain subgroup diversity could even lead to an earlier detection of brain diffusion differences within the participating subgroups. Another self-evident limitation of our study is that we could not ever evaluate diffusion imaging of hypoglycemia in cases with the most severe hypoglycemic symptoms like unresponsiveness because the IST was always stopped or had to be abandoned long before this severe hypoglycemic symptom developed. So also in the future, this special aspect of hypoglycemia has to be left to the evaluation and meta-analyses of incidental case reports only.
Further studies with a larger number of participants are still necessary, especially considering that with the ongoing widespread clinical use of 3T MR imaging, systematic comparisons of the known differences between 3T and 1.5T43 in diffusion imaging are still desirable.
Conclusions
Hyperacute short-term severe hypoglycemia for <10 minutes does not induce visible changes in DWI of the human brain, suggesting that prolonged hypoglycemia may be the relevant cause for observed reversible diffusion disturbances in MR imaging. Therefore, prompt adequate therapy for hypoglycemia can prevent cerebral injury in patients with diabetes.
Footnotes
-
Indicates Fellows' Journal Club selection
-

This work was supported by Sunlight Medical Ltd in the form of a grant of Omnisense, a quantitative ultrasound machine.
Disclosures: Hans-Joachim Mentzel was a speaker at conferences and is a member of the Speaker Bureau for Bayer Healthcare (Germany), GE Healthcare (Germany), and Novartis (Germany). Ulrich Alfons Müller received research support (including provision of equipment or materials) from Roche Diagnostics in the form of a grant for multicentric evaluation of a structured patient education program for optimization of intensified insulin therapy, which was completed in 2009, and a grant for an ongoing telemedicine project in diabetes mellitus type 2.

References
- Received September 16, 2010.
- Accepted after revision November 8, 2010.
- Copyright © American Society of Neuroradiology


