
Abstract
BACKGROUND AND PURPOSE: Neuronal damage in aSAH apart from perfusion deficits has been widely discussed. We aimed to test if cerebral injury occurs in aSAH independently from visible perfusion deficit by measuring cerebral metabolites in patients with aSAH without infarction or impaired perfusion.
MATERIALS AND METHODS: We performed 3T MR imaging including 1H-MR spectroscopy, DWI, and MR perfusion in 58 patients with aSAH and 11 age-matched and sex-matched control patients with incidental aneurysm. We compared changes of NAA, Cho, Glx, Lac, and Cr between all patients with aSAH and controls, between patients with and without visible perfusion deficit or infarction and controls, and between patients with and without visible perfusion deficit or infarction by using the Wilcoxon signed-rank test.
RESULTS: We found that NAA significantly (P < .005) decreased in all patients with aSAH. Cho was significantly increased in all patients compared with controls (P < .05). In patients without impaired perfusion or infarction, Glx was significantly decreased compared with both controls (P = .005) and patients with impaired perfusion or infarction (P = .006).
CONCLUSIONS: The significant decrease of NAA and Glx in patients with aSAH but without impaired perfusion or infarction strongly suggests global metabolic changes independent from visible perfusion deficits that might reflect neuronal mitochondrial injury. Further, impaired perfusion in aSAH seems to induce additional metabolic changes from increasing neuronal stress that might, to some extent, mask the global metabolic changes.
ABBREVIATIONS:
- ACA
- anterior cerebral artery
- aSAH
- aneurysmal subarachnoid hemorrhage
- DSC
- dynamic susceptibility-weighted contrast-enhanced
- Glx
- glutamate + glutamine
- Lac
- lactate
Cerebral dysfunction and delayed ischemic neurologic deficits are frequent complications of aneurysm rupture and increase the risk for a poor outcome. Neurologic sequelae of aSAH have been mainly attributed to impaired cerebral perfusion.1 According to this hypothesis, brain damage after aSAH should be most pronounced in hemodynamically impaired brain regions. However, increasing evidence exists that SAH itself induces brain damage, and cortical spreading depression with neuronal and glial mass depolarization wave may be an underlying mechanism.2⇓⇓⇓–6
After SAH, patients frequently show cognitive or behavioral abnormalities that have no pathologic correlate in conventional MR imaging.7 1H-MR spectroscopy allows noninvasive in vivo measurement of metabolic changes that are able to detect brain damage even in normal-appearing brain tissue.8⇓–10 Cerebral metabolite changes could also be measured by 1H-MR spectroscopy after SAH, even on morphologically normal MR imaging.1,7,11,12 Furthermore, Macmillan et al1 found chronic metabolic changes in patients after aSAH that might be compatible with the neurologic sequelae in patients with SAH.
The brain metabolite NAA is a sensitive neuronal marker that is known to decrease in almost all cerebral diseases associated with neuronal injury. NAA is formed in neuronal mitochondria, so it is also considered a marker of mitochondrial integrity and function in neurons.13⇓⇓⇓⇓⇓⇓–20 Therefore, it might be also decreased in patients with decreased cerebral mitochondrial function without irreversible neuronal damage.
Apart from NAA, 1H-MR spectroscopy measures other metabolites such as the pooled Cho compounds as markers of membrane-related processes, the pooled Cr compounds as the sum of Cr and phosphocreatine, and Lac as a marker of anaerobe metabolism. Furthermore, the signal pattern Glx, which is attributed to the sum of glutamate and glutamine signals, is measurable especially at higher-field strengths.
Metabolic changes can be evaluated by use of MR spectroscopy, and perfusion changes can be measured by MR perfusion imaging in almost every region of the brain. This can be done in defined areas of the brain on the basis of the underlying anatomy and also in relationship to the vascular territories. The combination of these 2 imaging modalities seems adequate to investigate metabolite changes after aSAH in hemodynamically normal and impaired vascular territories of the brain.
The aim of our study was to test whether metabolic changes in patients with aSAH are limited to brain areas of impaired perfusion, or if a normally perfused brain is affected as well.
Materials and Methods
Study Participants
The study was approved by the local ethics committee, and informed consent was given from each participant. A total of 58 patients (42 women; aged 32–81 years; mean age, 55 years) with acute aSAH and 11 control patients (8 women; aged 23–73 years; mean age, 50 years) with incidental aneurysms were included in the study. MR imaging was done in each patient during the time window from initial bleeding until the individual end of occurrence of vasospasm21 and was repeated in case of clinical deterioration. Therefore, the time between MR imaging follow-up examinations, whenever necessary (28 of 58 patients had between 1 and 8 follow-ups [mean number of follow-ups, 2] between 3 and 21 days after bleeding), varied depending on each patient's individual clinical course.
MR Imaging Examination
MR imaging of the brain was performed on a 3T whole-body system (Magnetom Verio; Siemens, Erlangen, Germany) with an 8-channel phased array head coil. The protocol included T2-weighted images; T2*-weighted images, single-shot echo-planar DWI (b = 1000) with apparent diffusion coefficient maps, MR angiography (3D multislight time-of-flight), and MR perfusion. For MR perfusion, DSC-MR imaging was performed after intravenous contrast agent injection (0.05 mmol/kg) of gadobutrol (power injector, flow rate of 5 mL/s followed by a 20-mL bolus of 0.9% saline with the same flow rate).
1H-MRS of the brain was performed on the same 3T whole-body system by use of the same 8-channel phased array head coil. Sequence parameters were TR, 1500 ms; TE, 35 ms; field of view, 240 × 240 mm2; matrix, 16 × 16; section thickness, 15 mm; and duration, 04:45 minutes. The axial 2D MRS section (with a circular phase-encoding scheme) was acquired at the level of the centrum semiovale. The volume of interest was selected by use of a chemical shift imaging-semiLASER sequence,22 which was provided by the vendor as a work-in-progress sequence. The target volume was adjusted to a size of 100 × 70 mm2. Before Fourier transformation, the matrix was extrapolated to 36 × 36, resulting in a 7.5 × 7.5 mm2 in-plane grid size (Fig 1).
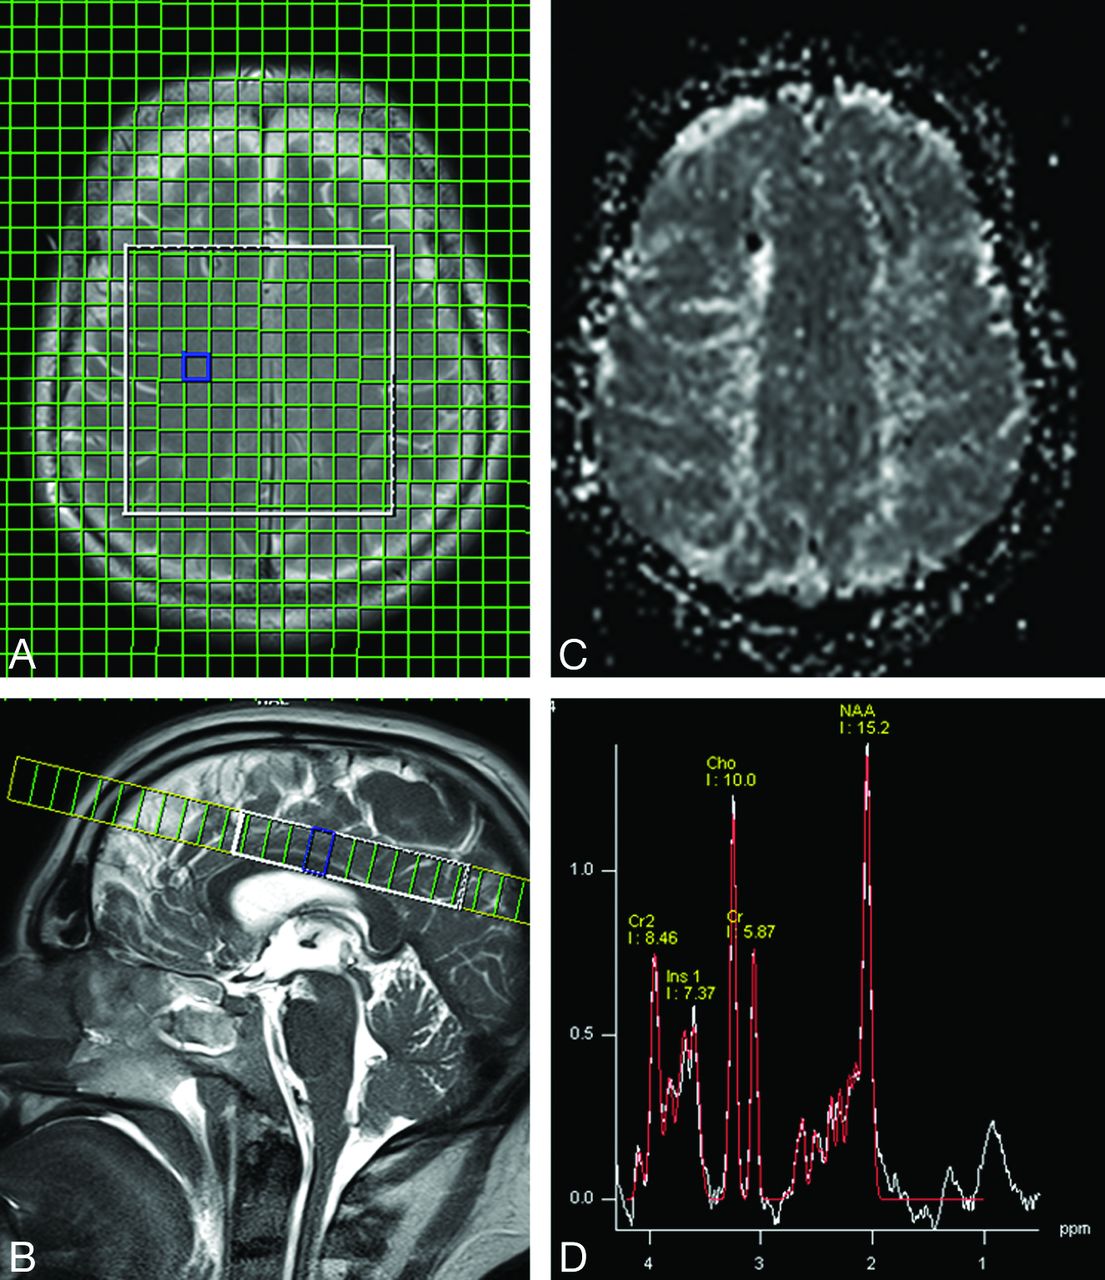
An axial 2D MRS section was acquired at the level of the centrum semiovale (A and B). For correlation with the spectroscopic data, gray-scale relative MTT maps (C) were generated at the same level as the 2D MRS section. Lac was quantified visually in the original spectra (D). No clear positive doublet signal at 1.3 ppm (Lac) was found in any of the patients or controls.
Processing
1H-MRS.
The 1H-MRS spectra were analyzed off-line. A graphical user interface developed at our institute was used for image-guided selection (based on the reference images) of the free induction decays from the aSAH data. The free induction decays were analyzed by use of the LCModel software23 (downloadable test version at: http://s-provencher.com), which simulates the spectra with a linear combination of model spectra and is considered to be the most suitable tool for analyzing short-TE spectra.24 Baseline correction was performed, including macromolecules. The Cramer-Rao lower bounds indicated by the program were used to measure the quality and reliability of the 1H spectroscopic data, rejecting data with values below 20%.23 In addition, all spectra from the selected voxels were visually assessed for artifacts according to the criteria described by Kreis.25 Only spectra with adequate quality were included in the analysis. Metabolite intensities were referenced against a calibrated phantom. Concentrations are considered as laboratory units (a.u.), but their values in millimoles per liter (mmol/L) are in the order of published data.
Metabolite values (NAA, Cho, Glx, Cr) were averaged in 4 different arterial territories (left ACA, right ACA, left MCA, and right MCA) according to the underlying anatomy. No attempt was made to exclude voxels with impaired perfusion or infarcted tissue. In patients with several follow-up MR studies, the metabolite values of all studies were averaged for each territory.
DSC-MR Imaging
To analyze the relative MTT from the perfusion MR imaging data, we used the in-built software syngo (Siemens) featuring standard algorithms applied to the first-pass data as described previously.26,27 MTT maps of the tracer were computed by means of the relationship specified by the central volume theorem: MTT = CBV/CBF.27
Gray-scale relative MTT maps (Fig 1) were generated at the same level as the 2D MRS section and were aligned with the congruent DWI/apparent diffusion coefficient maps and T2-weighted images to provide better visualization of infarcted areas. In each of the 4 regions of interest (ACA and MCA of both hemispheres), cerebrovascular impairment because of delayed perfusion (>2 seconds of MTT delay compared with the contralateral healthy-appearing tissue)28 or infarcted areas was identified by 2 experienced neuroradiologists on all imaging modalities.
Data Analysis
Four groups were defined: 1) all patients with SAH (n = 58); 2) patients with SAH but without infarction or impaired perfusion (n = 12); 3) patients with SAH with infarction or impaired perfusion (n = 46); and 4) controls (n = 11).
Metabolite concentrations (NAA, Cho, Glx, Cr) of each arterial territory (ACA and MCA of both hemispheres) were compared among groups: 1 vs. 4, 2 vs. 4, 3 vs. 2, and 3 vs. 4 (Table). Lactate was quantified visually in the original spectra. The presence of a clear positive doublet signal at 1.3 ppm was taken as a marker for increased concentration of this metabolite.8 (Fig 1).
Metabolite concentrations (a.u.) of patients with SAH and controls and P values of between-group comparisons
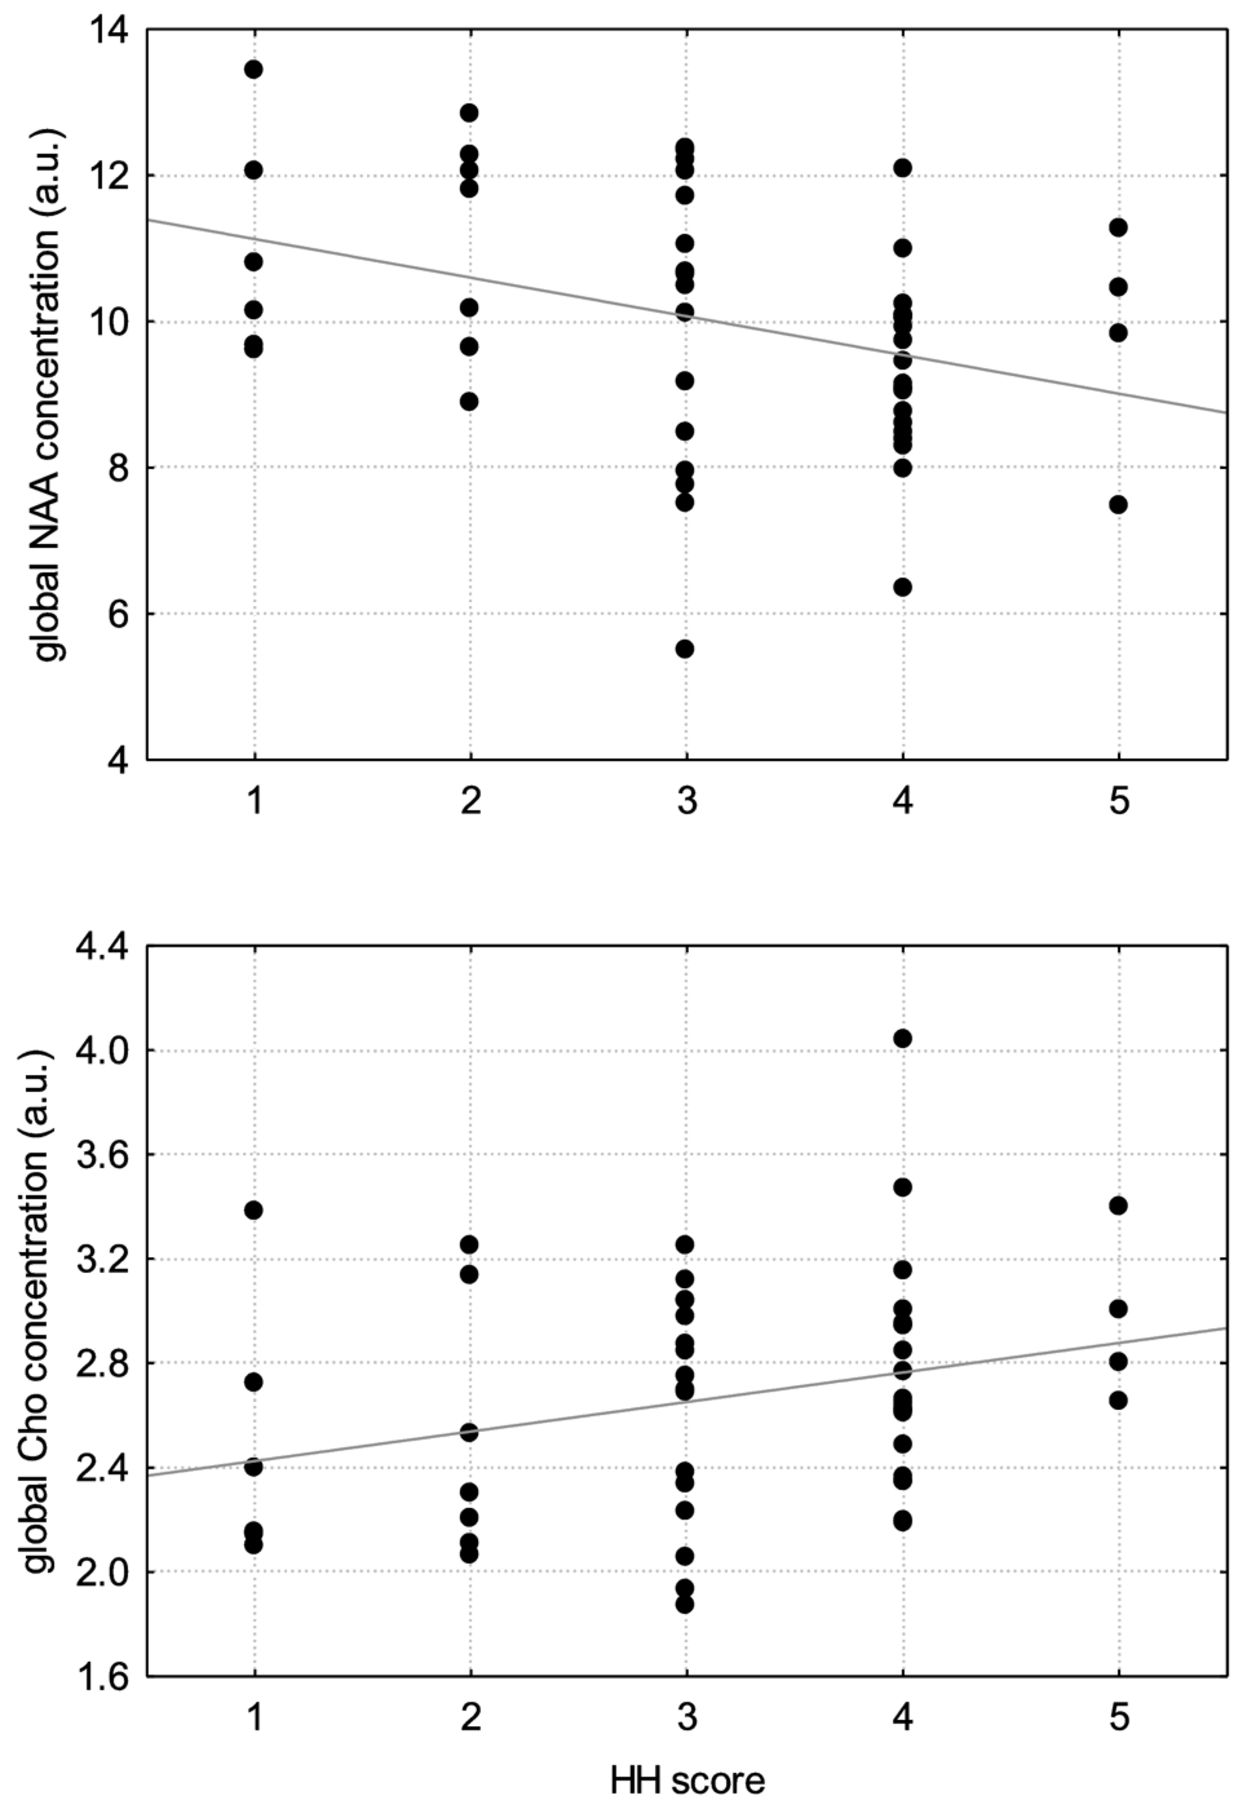
For all patients with SAH (n = 58), the NAA/Cho ratio was calculated. For the concentrations and the ratio, a correlation (Spearman rho) vs the Hunt and Hess scale, which indicates the severity of acute symptoms after onset of SAH, was done (Fig 2).
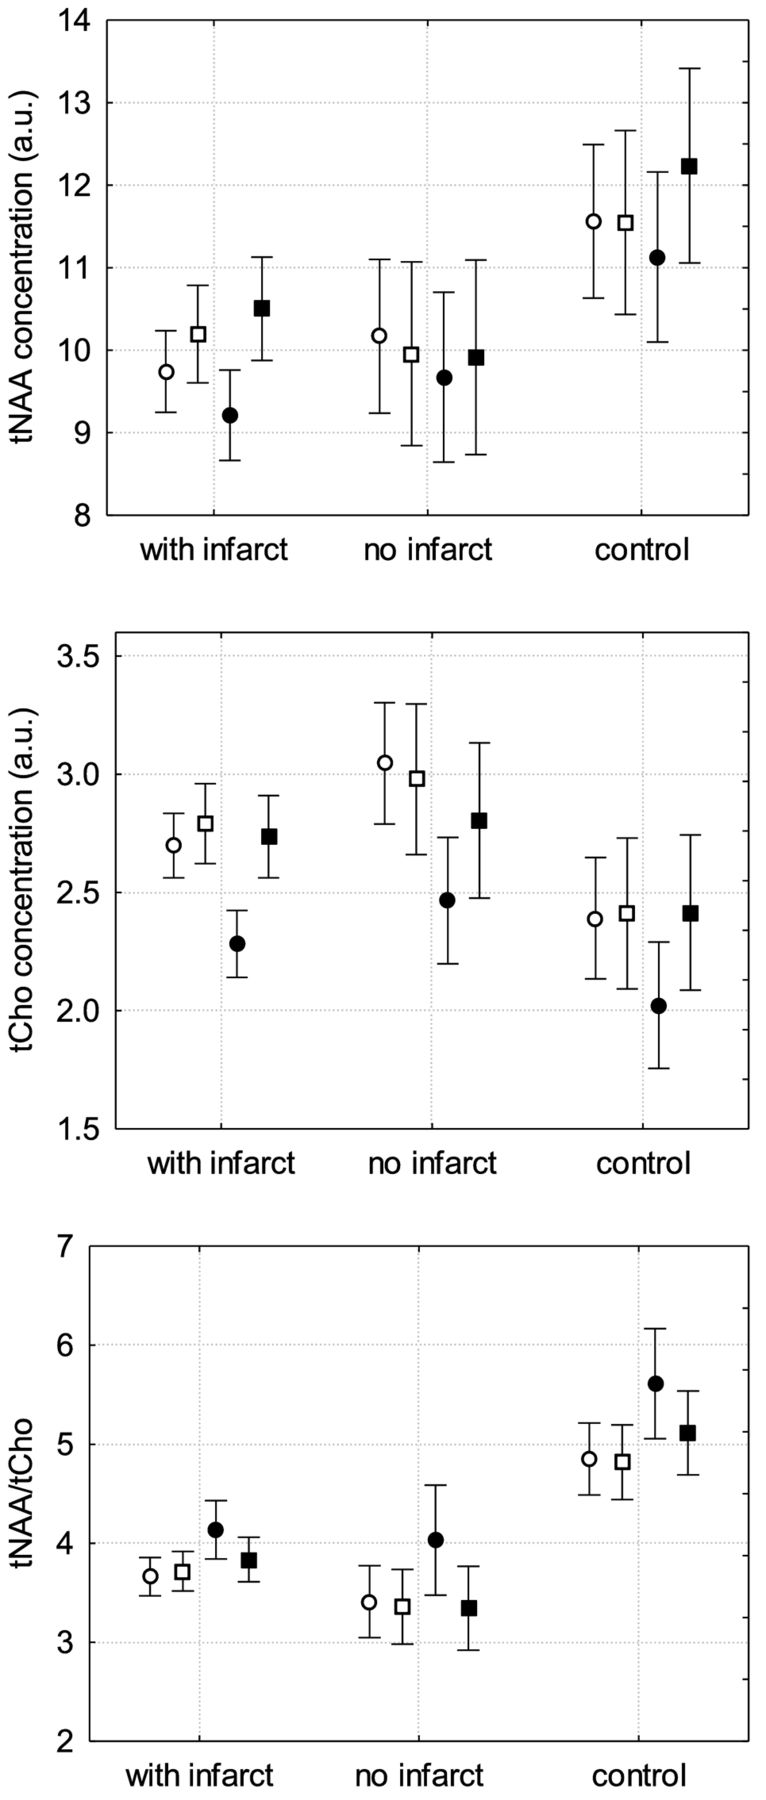
Distribution of NAA and Cho concentrations and NAA/Cho ratio in patients with aSAH with infarct or impaired perfusion, patients with aSAH without infarct or impaired perfusion, and in controls (white circle: ACA right; white square: ACA left; black circle: MCA right; black square: MCA left).
Results
Compared with controls, all patients with aSAH showed significant decrease in NAA globally and in each territory and significant increase in Cho globally and in the ACA territories. However, Glx showed significant changes only in the territory of the left MCA but not globally (Table).
Patients with SAH with impaired perfusion or infarction showed significant decrease in NAA globally and in each territory but no significant increase of Cho compared with controls (Fig 3, Table), and Glx was significantly decreased only in the territory of the left MCA but not in the other territories or globally (Table).

Correlation between NAA and Cho concentration and SAH score on the Hunt and Hess scale. The metabolite concentration reflects the average over all target areas and is therefore titled as a global concentration.
Patients with aSAH but without impaired perfusion or infarction also showed significant decrease of NAA globally and in each territory compared with controls. Cho was significantly increased in the territory of the right ACA only but not globally (Fig 3). However, significant decrease in Glx could be shown globally and in the territories of the left ACA and MCA (Table).
Compared with patients with aSAH but without impaired perfusion and/or infarction, patients with aSAH with impaired perfusion or infarction showed significant increase in Glx globally and in the territories of the left ACA and MCA, but NAA and Cho did not show significant changes (Table).
We further found a significant correlation (P < .05) between the NAA/Cho ratio and the Hunt and Hess scale (Spearman R, −0.55) as a decrease in NAA and increased Hunt and Hess scale (Spearman R, −0.36), as well as an increase in Cho and increased Hunt and Hess scale (Spearman R, 0.27) (Fig 2).
Cr showed no significant changes between all patients with SAH, patients with or without impaired perfusion or infarction, and controls in any territory or globally. There was a significant increase of Cr in patients with impaired perfusion or infarction in the territory of the left MCA only, whereas in all other territories and globally, no changes have been found. No Lac peaks were found in any of the 3 groups.
Discussion
Our study reveals that patients with aSAH show significant metabolic changes, even in the absence of impaired perfusion or infarction. All patients with aSAH, including both groups with and without impaired perfusion or infarction, showed a significant decrease in NAA. Although Glx showed significant decrease only in patients with aSAH without impaired perfusion or infarction, a significant increase in Cho was found only in patients with aSAH with impaired perfusion or infarction. However, both metabolites showed a concordant trend in each other's group.
The brain metabolite NAA is a sensitive marker for neuronal integrity, function, and attenuation. Its concentration is very stable in healthy adults,13⇓⇓⇓⇓⇓–19 so that decreasing NAA suggests neuronal damage. Consistent with our results, previous studies that used 1H-MR spectroscopy revealed significant decrease in NAA and increase in Cho in patients with aSAH.1,7,11,12,29 These authors believed that the decrease in NAA was mainly attributed to reversible and irreversible neuronal damage because of impaired perfusion resulting mainly from cerebral vasospasm.
To test this hypothesis, we are the first to measure metabolic changes in patients with aSAH without areas of infarction and/or impaired brain perfusion measured by DWI and perfusion measurement by DSC-MR imaging. Our results strongly suggest that the NAA decrease and decreased NAA/Cho ratio in patients with SAH cannot be explained by measureable impairment of cerebral perfusion related to cerebral vasospasm.
Neuronal damage in SAH apart from measureable impaired perfusion has been discussed in the literature, pointing toward different focal and generalized pathophysiologic mechanisms contributing to neuronal damage. The neuronal damage in aSAH seems to be a multifactorial process that includes local toxic effects of the blood clots, inflammatory and thrombogenic changes, disturbances of the cerebral autoregulation, and changes of the microcirculation.2,3,30⇓⇓⇓⇓⇓⇓⇓⇓⇓⇓⇓⇓⇓⇓⇓⇓⇓⇓⇓⇓⇓–52 One key factor contributing to neuronal damage in aSAH is cortical spreading depression, which causes neuronal depolarization resulting in cytotoxic edema because of overstressing of adenosine triphosphate-dependent sodium and calcium pumps. Therefore, energy demand increases to regenerate the calcium and sodium pump function. Cerebral blood flow accordingly increases by vasodilation to augment the glucose and oxygen supply. From a physiologic standpoint, after neuronal repolarization, spreading oligemia occurs because of vasodilation. However, cerebral injury such as aSAH might lead to an inverse hemodynamic response with nitric oxide-resistance and spasm of the microcirculation, resulting in energy impairment and neuronal damage. Those pathologic changes, which might not be detectable with DSA and transcranial Doppler sonography, can be associated with or without measurable perfusion deficit.2,3,6,48,53⇓⇓–56 Cortical spreading depression might therefore be a main contributor to the metabolic changes in areas without visible impaired perfusion or infarction, as shown in our study.
It has to be further mentioned that NAA reduction might not only be caused by irreversible neuronal damage but also by neuronal dysfunction. NAA is formed by acetylcoenzyme A and aspartate in mitochondria.13,15⇓–17,19 Therefore, NAA decrease in patients with aSAH might be caused by reduced NAA synthesis in functionally impaired neuronal mitochondria.
We could further show significant decrease in Glx in patients with aSAH without evidence of impaired perfusion or infarction, which, in contrast, was not detectable in patients with impaired perfusion or infarction.
The decrease of Glx shown in our study is another indication of impaired mitochondrial function in aSAH. Glutamate is produced from alpha-ketoglutarate, which is an intermediate in the citric acid cycle occurring in the mitochondrial matrix. Furthermore, glutamate can be used as an additional energy source besides glucose in aSAH.19,29 Therefore, the overall decrease of Glx might be a consequence of the impaired energy metabolism in SAH. It has been shown that glutamate as a main component of Glx might be increasingly produced as an excitatory neurotransmitter in aSAH57 and to increases extracellularly in SAH in rats.58 However, 1H-MRS measures the pool of glutamate, and synaptic changes of the neurotransmitter might not be detected. The insignificant decrease in Glx in patients with impaired perfusion and infarction might be the result of the increasingly released excitatory neurotransmitter glutamate as a neuronal stress reaction.
We also found an increase in Cho signal that reached a level of significance in the group of all patients with aSAH, and no significant difference could be shown between such patients with or without impaired perfusion or infarction. Cho signal includes free Cho, phosphorylcholine, and glycerophosphocholine, all known to be substrates of membrane metabolism. Cho is increased in enhanced anabolic and/or catabolic processes of cell membrane lipids.1,7 Cho increases in neoplastic and in inflammatory diseases.1,59 Regarding patients with aSAH, Macmillan et al1 could show that Cho was chronically increased even in normal-appearing white matter, but they also showed a more pronounced increase of Cho in posthemorrhagic, probably glial T2 white matter changes. Glycerophosphocholine as a major part of the Cho signal is known to be attributed to membrane catabolism because of cell damage.1 Therefore, we hypothesize the increase in Cho in our study to be result of damage of neuronal membranes as well as activation of glial membrane anabolism. Our finding that increase in Cho concentration correlates positively with increasing Hunt and Hess grade (Fig 2) might support this thesis.
The role of Cr, which is found in highest concentrations in astrocytes and oligodendrocytes, has not yet been fully understood. It is known that increased Cr suggests upregulated metabolism because phosphocreatine works as a short-term energy reservoir. However, it is still unclear whether there is another biochemical role for Cr1,60 in SAH. We did not find significant changes of Cr between patients with SAH and controls.
Lac has been discussed as a sensitive marker of ischemic and hypoxic diseases of the brain, including mitochondriopathies and aSAH.1,20,61 Dunne et al29 found an increase in Lac in vitro early after initial bleeding of SAH, which quickly returned to normal values because of washout effects. In our in vivo study, we did not find an increase in Lac in patients with SAH with or without perfusion deficits, neither in brain parenchyma nor in the CSF.20 Our results coincide with previous studies1,7 and might be explained by the fact that the Lac increase after an initial event decreases very fast afterward.11,19
Technical Limitations
Quantitative metabolite values may be influenced by coil sensitivity profiles depending on their localization,62 whereas metabolic ratios are not dependent on coil loading and pulse inhomogeneity.
We cannot exclude transient intervals of impaired perfusion before the MR imaging examination.63 However, our results show significant differences between patients with and without impaired perfusion. A sustained effect caused by a potential transient impaired perfusion before the MR imaging examination might have diminished the observed effect.
It is worth mentioning that our study is the first to compare MRS results of patients with aSAH exclusively vs patients with incidental aneurysms to exclude effects caused by the aneurysm itself.
Conclusions
We found metabolic changes in patients with aSAH with and also without impaired cerebral perfusion or infarction. In fact, metabolic changes were even more pronounced in patients without impaired perfusion or infarction vs patients with such changes. This finding implies global metabolic changes in patients with aSAH independent from visible perfusion deficits. The decrease in concentrations of NAA and Glx indicates that impaired mitochondrial function might be relevant for cerebral injury in aSAH. Furthermore, impairment of perfusion in aSAH seems to induce additional metabolic changes from increasing neuronal stress that might, to some extent, mask the global metabolic changes.
Footnotes
M.W. and A.J. contributed equally to this manuscript.
Disclosures: Joachim Berkefeld—UNRELATED: Board Membership: advisory board member of Acandis company (Pforzheim, Germany); Payment for Development of Educational Presentations: invited lectures paid by Siemens (Forchheim, Germany).
REFERENCES
- 1.↵
- 2.↵
- 3.↵
- 4.↵
- 5.↵
- 6.↵
- 7.↵
- 8.↵
- 9.↵
- 10.↵
- 11.↵
- 12.↵
- 13.↵
- 14.↵
- 15.↵
- 16.↵
- 17.↵
- 18.↵
- 19.↵
- 20.↵
- 21.↵
- 22.↵
- 23.↵
- 24.↵
- 25.↵
- 26.↵
- 27.↵
- 28.↵
- 29.↵
- 30.↵
- 31.↵
- 32.↵
- 33.↵
- 34.↵
- 35.↵
- 36.↵
- 37.↵
- 38.↵
- 39.↵
- 40.↵
- 41.↵
- 42.↵
- 43.↵
- 44.↵
- 45.↵
- 46.↵
- 47.↵
- 48.↵
- 49.↵
- 50.↵
- 51.↵
- 52.↵
- 53.↵
- 54.↵
- 55.↵
- 56.↵
- 57.↵
- 58.↵
- 59.↵
- 60.↵
- 61.↵
- 62.↵
- 63.↵
- Received August 6, 2012.
- Accepted after revision September 28, 2012.
- © 2013 by American Journal of Neuroradiology
In this issue


Jump to section
Related Articles
Cited By...
- No citing articles found.