
Abstract
BACKGROUND AND PURPOSE: Current T2-weighted imaging takes >3 minutes to perform, for which the ultrafast transition into driven equilibrium (TIDE) technique may be potentially helpful. This study qualitatively and quantitatively evaluates the imaging of transition into driven equilibrium of the balanced steady-state free precession (TIDE) compared with TSE and turbo gradient spin-echo on T2-weighted MR images.
MATERIALS AND METHODS: Thirty healthy volunteers were examined with T2-weighted images by using TIDE, TSE, and turbo gradient spin-echo sequences. Imaging was evaluated qualitatively by 2 independent observers on the basis of a 4-point rating scale regarding contrast characteristics and artifacts behavior. Image SNR and contrast-to-noise ratio were quantitatively assessed.
RESULTS: TIDE provided T2-weighted contrast similar to that in TSE and turbo gradient spin-echo with only one-eighth of the scan time. TIDE showed gray-white matter differentiation and iron-load sensitivity inferior that of TSE and turbo gradient spin-echo, but with improved motion artifacts reduction on qualitative scores. Nonmotion ghosting artifacts were uniquely found in TIDE images. The overall SNRs of TSE were 1.9–2.0 times those of turbo gradient spin-echo and 1.7–2.2 times of those of TIDE for brain tissue (P < .0001). TIDE had a higher contrast-to-noise ratio than TSE (P = .169) and turbo gradient spin-echo (P < .0001) regarding non-iron-containing gray matter versus white matter. TIDE had a lower contrast-to-noise ratio than turbo gradient spin-echo and TSE (P < .0001) between iron-containing gray matter and white matter.
CONCLUSIONS: TIDE provides T2-weighted images with reduced scan times and reduced motion artifacts compared with TSE and turbo gradient spin-echo with the trade-off of reduced SNR and poorer gray-white matter differentiation.
ABBREVIATIONS:
- CNR
- contrast-to-noise ratio
- TGSE
- turbo gradient spin-echo
- TIDE
- transition into driven equilibrium
T2-weighted MR images are commonly used to depict gross pathologic changes of the brain, including tumor, infarction, ischemia, white matter demyelination, inflammation, edema, and so forth.1⇓⇓–4 The turbo spin-echo sequence is a method currently used for routine T2WI examination in the brain and in other extracranial regions.5,6 In daily practice, it often takes >3 minutes to obtain 1 set of 2D TSE T2WIs on a certain plane.5⇓–7 Accordingly, it might take as long as 10 minutes to obtain T2WI on 3 orthogonal planes by using TSE. Although 3D imaging techniques have been developed to acquire T2WI, they still take as long as 6–8 minutes of acquisition time,8⇓–10 which makes them prone to motion artifacts and hampers their clinical application in daily practice.
There is an increasing need for a fast imaging technique to acquire T2WI of the brain in patients with motion during MR imaging. In 2000, Chung et al11 demonstrated the advantage of a fast imaging with steady-state free precession to freeze the fetal motion during MR imaging. However, true fast imaging with steady-state precession carries a contrast known as T2/T1 rather than T2-weighted. The transition into driven equilibrium is a variant of the balanced steady-state free precession technique, inheriting characteristics of balanced steady-state free precession like high SNR efficiency and flow compensation. Different from the T2/T1 contrast of conventional balanced steady-state free precession,11,12 pure T2 contrast or T2-weighted contrast with fat suppression can be rendered by transition into driven equilibrium (TIDE) theoretically, depending on the sampling strategy of the contrast-determining central k-space.13⇓⇓⇓–17 The typical scan time of TIDE for a single section is approximately 1 second, which is desirable, especially when 3-plane multisection T2WIs are considered for clinical practice, such as for rapid screening or diagnosis. Before applying them to daily practice, however, the imaging quality and characteristics of TIDE need to be evaluated.
We assume that TIDE could also provide T2-weighted imaging contrast similar to that in other pulse sequences, including TSE and turbo gradient spin-echo (TGSE). In this study, we aimed to qualitatively and quantitatively evaluate TIDE compared with TSE and TGSE in T2-weighted brain MR images.
Materials and Methods
This prospective study was approved by the institutional review board of Tri-Service General Hospital. Written informed consent was obtained from all subjects. For assessment of imaging quality, the inclusion criteria were that the volunteers had no history of brain disease such as tumor, hemorrhage, infarction, infection, or inflammation (none were excluded); had no history of brain surgery or radiation therapy (none were excluded); and had not received chemotherapy for systemic malignancy (1 was excluded before MR imaging). Accordingly, 30 healthy volunteers, including 10 men (mean age, 40.7 ± 9.3 years) and 20 women (mean age, 41.5 ± 8.9 years) were enrolled. In addition to qualitative and quantitative analyses of brain images from these healthy volunteers, 2 patients, including a 57-year-old woman with stroke history and a 9-day-old neonate with a seizure history, were also scanned for demonstration only.
MR Imaging Protocols
All MR imaging examinations were conducted on a 1.5T whole-body MR imaging unit (Magnetom Vision Plus; Siemens, Erlangen, Germany) by using a standard circularly polarized head coil with a maximal amplitude of 25 mT/m and a slew rate of 83.3 T/m/s for the gradient system. For anatomic localization, gradient-echo MR imaging was used to acquire 3-plane orthogonal images. Subsequently, whole brain images were acquired by using 3 protocols. The first protocol used a conventional fat-saturated dual-echo turbo spin-echo sequence (hereafter termed the TSE method) with parameters as follows: TR/TE1/TE2, 3800/22/90 ms; number of signals acquired, 1; echo-train length, 5; FOV, 240 × 240 mm; matrix, 250 × 256 (interpolated into 256 × 256 on the MR imaging console); receiver bandwidth, 62.5 kHz; section thickness, 4 mm; and intersection space, 1 mm. Twenty sections covered the brain from the vertex to the level of the upper cervical spinal cord in an axial orientation. In the second protocol, a turbo gradient spin-echo sequence (hereafter termed the TGSE method) was used with all imaging parameters identical to those used with the TSE method. The third protocol used the transition into the driven equilibrium sequence (hereafter termed the TIDE method) (TR/TE, 6.46/3.23 ms; matrix size, 256 × 256; receiver bandwidth, 125 kHz) with all other imaging parameters identical to those used with the TSE and TGSE methods.
Qualitative Analysis of Brain Imaging
The quality of TSE, TGSE, and TIDE images was rated by 2 neuroradiologists (C.-J.J. and C.-J.H., both with 10 years of experience in brain image interpretation) on the basis of a 4-point (0–3) rating scale regarding 5 items: gray-white matter differentiation, iron-load sensitivity, CSF motion artifacts, eyeball motion artifacts, and nonmotion ghosting artifacts. For gray-white matter differentiation, a score of 0, 1, 2, or 3 represented poor, fair, good, and excellent performance in differentiating the gray matter from white matter structures, respectively. For iron-load sensitivity, scores of 0, 1, 2, and 3 represented poor, fair, good, and excellent performance in detecting iron-related low signal intensity, respectively. As for the CSF, eyeball, and ghosting artifacts, scores of 0, 1, 2, and 3 indicated severe, moderate, mild, and without artifacts, respectively. The mean scores of the 2 raters were used when comparing the quality of different imaging techniques.
Image Processing and Quantitative Data Analysis
All image data were transferred from the MR imaging console to a personal computer, where all data were processed with software programs developed (by Y.-C.K.H.) by using Matlab (MathWorks, Natick, Massachusetts). All image processing, region-of-interest drawing, and data analyses were performed by a single author (Y.-C.K.H.). Regions of interest were manually drawn with about 50–100 pixels on the white matter, non-iron-containing gray matter, and iron-containing gray matter. For white matter, the centrum semiovale, corona radiata, and periventricular white matter were chosen. For gray matter, the head of the caudate nucleus, putamen, and thalamus were selected. As for iron-containing gray matter, the globus pallidus was adopted. An additional region of interest was placed outside the head to represent background noise.
The signal-to-noise ratio was calculated for each region of interest. The SNR was defined as the mean signal intensity of the region of interest divided by the SD of the background region of interest (ie, noise). In addition to SNR, the contrast-to-noise ratio (CNR) between gray matter and white matter was also calculated. The CNR was defined as the difference in signal intensities between gray matter and white matter divided by the SD of the background noise. In the calculation of CNRs, the thalamus, globus pallidus, and centrum semiovale were used to represent non-iron-containing gray matter, iron-containing gray matter, and white matter, respectively.
Statistical Analyses
Statistical analyses were performed by using a statistics plug-in, SigmaXL (SigmaXL, Toronto, Ontario, Canada), of the Microsoft Excel program (Microsoft, Redmond, Washington). Interobserver reliability for assessing image quality was evaluated by linearly weighted κ statistics,18 in which a κ value of 0 represented poor agreement; 0.1–0.2, slight agreement; 0.21–0.40, fair agreement; 0.41–0.60, moderate agreement; 0.61–0.80, substantial agreement; and 0.81–1.00, almost perfect agreement, respectively. The 2-tailed paired Student t test was applied to determine the significance of the difference between any 2 of the 3 sequences regarding the imaging quality, SNR, and CNR. For correction of multiple comparisons, P values < .05/15 = .0033 (ie, 15 comparisons) for qualitative study and <.05/30 = .0017 (ie, 30 comparisons) for quantitative study were considered statistically significant.
Results
Scan Times
The total scan times for the 20 sections covering the whole brain plus the prescan adjustment were 193, 193, and 24 seconds for TSE, TGSE, and TIDE methods with a ratio of 8:8:1, respectively. With 48 more seconds, TIDE provided additional coronal and sagittal images.
Perceptive Imaging Contrast and Noise of TSE, TGSE, and TIDE Images
Both raters considered all images of TIDE, TSE, and TGSE as T2-weighted in perception (Fig 1). As shown in the axial images at the level of lateral ventricles (Fig 1A–C), TSE, TGSE, and TIDE images all showed a similar T2-weighted contrast (ie, higher signal intensity of the superficial cortex and non-iron-containing deep gray matter and lower signal intensity of white matter). While TSE and TGSE images showed lower signal intensity of the iron-containing gray matter than white matter, TIDE images showed isointensity between the iron-containing gray matter and white matter (Fig 1D–F).

TSE (A, D), TGSE (B, E), and TIDE (C, F) images of a 38-year-old healthy man. The results show similar T2 contrast of the neocortex (A–C). At the basal ganglia, iron-containing gray matter (eg, globus pallidus) has a much higher intensity in the TIDE image compared with the other 2 results (D–F). Ghosting artifacts appear in the TIDE image (arrow in C).
TSE, TGSE, and TIDE images were susceptible to variable noises, including ghost artifacts, magnetic susceptibility artifacts, and motion artifacts related to eyeball movements and pulsation of CSF and blood flow (Figs 1 and 2). While TSE and TGSE images were more susceptible to motion artifacts (Figs 2A, B, D and E), TIDE seemed to be more susceptible to nonmotion ghost artifacts (Fig 1C, -F) and magnetic susceptibility artifacts (Fig 2C).
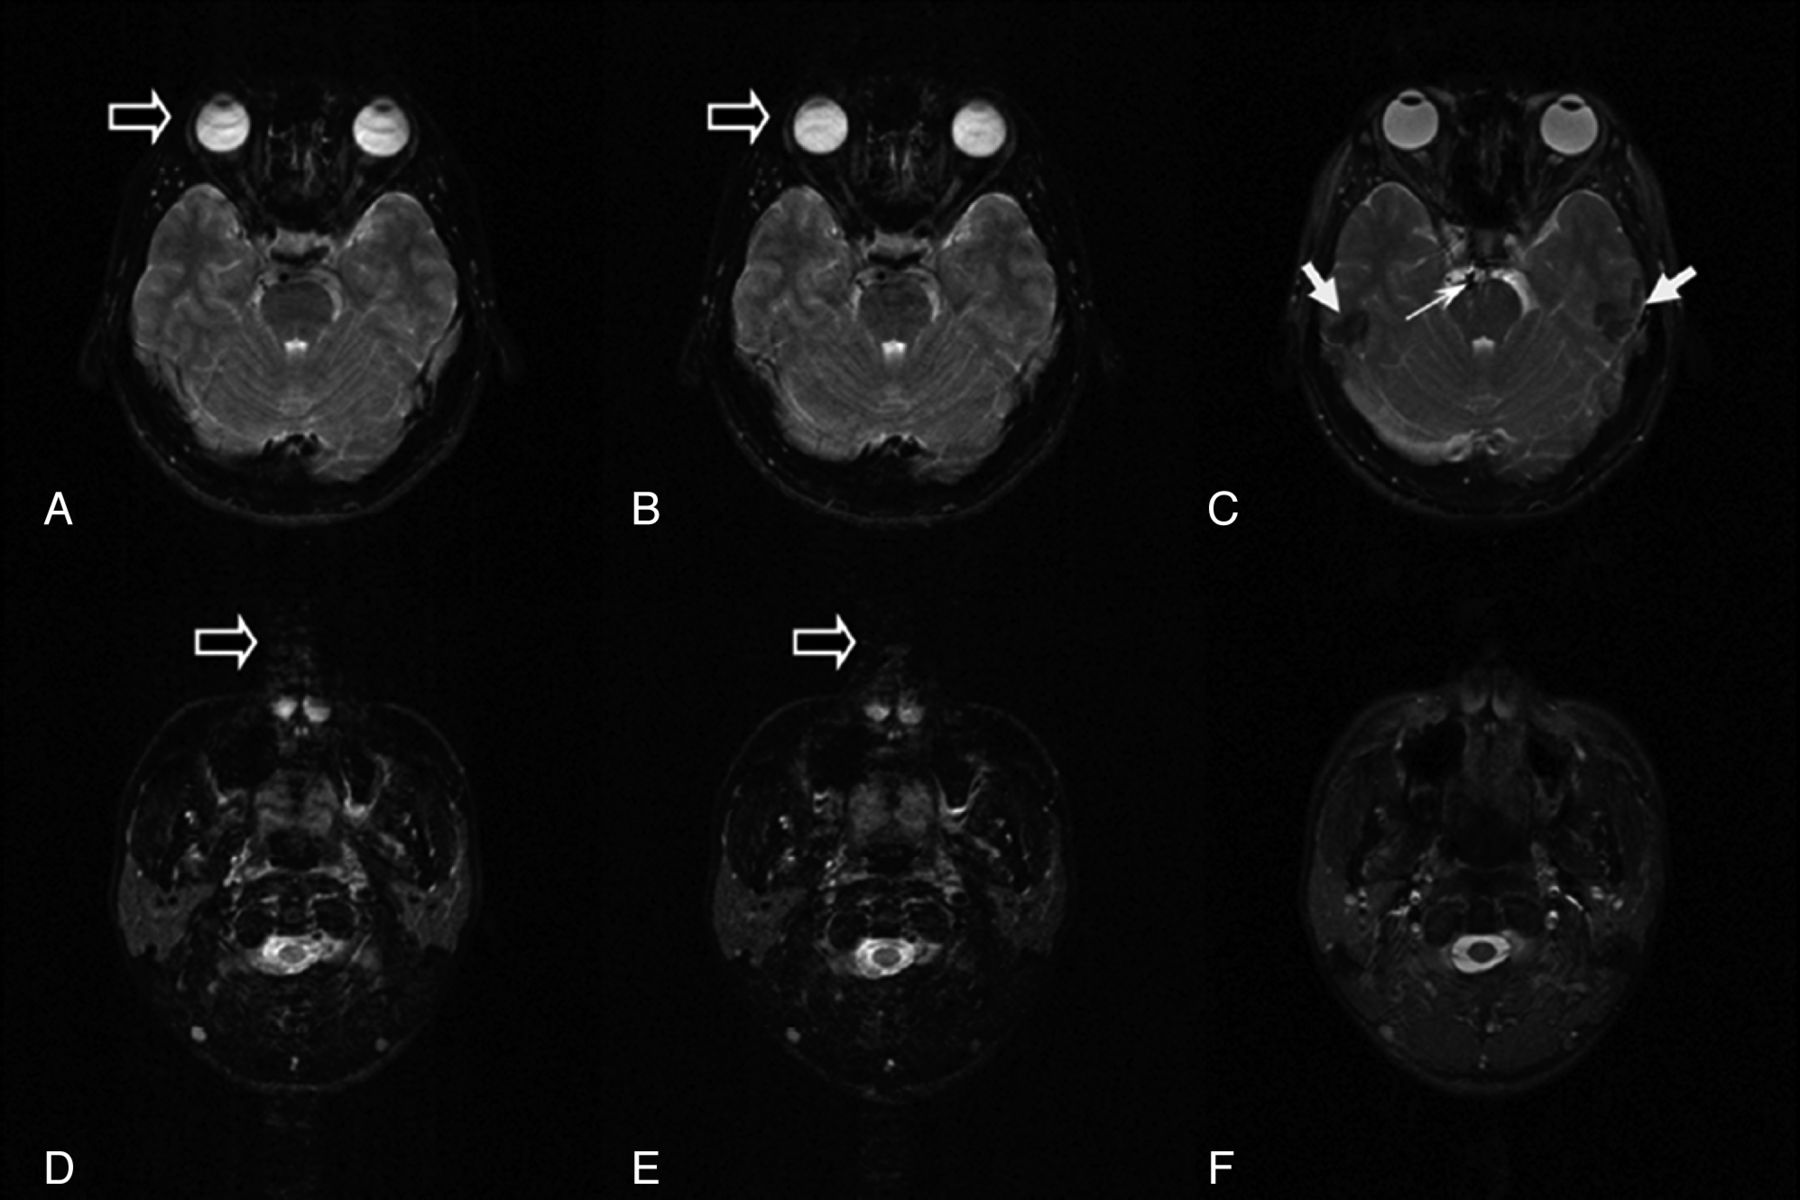
TSE (A, D), TGSE (B, E), and TIDE (C, F) images of a 25-year-old healthy man. Motion artifacts can be found in the TSE and TGSE images, due to eyeball movement (open arrows in A and B) and CSF flow (open arrows in D and E). Magnetic susceptibility artifacts appear in the TIDE image (solid arrows in C). Occasional basilar artery flow artifacts are seen in the TIDE image (thin arrow in C).
Qualitative Analysis of TSE, TGSE, and TIDE Images
Assessment scores of TSE, TGSE, and TIDE images regarding the 5 imaging quality items rated by 2 neuroradiologists are listed in the On-line Table. Analysis of interobservor agreement by using linearly weighted κ showed substantial agreement for gray-white matter differentiation, iron-load sensitivity, CSF motion artifacts, and nonmotion ghosting artifacts (with linearly weighted κ values of 0.773, 0.671, 0.646, and 0.739, respectively) and fair agreement for eyeball motion artifacts (with a linearly weighted κ value of 0.398).
A significant difference (P < .003) was observed between any 2 of TSE, TGSE, and TIDE sequences for all imaging quality items with exceptions regarding nonmotion ghosting artifacts and CSF motion artifacts, in which the difference between TSE and TGSE was insignificant (P = .573 and .0034, respectively). The average scores of gray-white matter differentiation were highest on TSE (2.98 ± 0.09), followed by TGSE (2.13 ± 0.22) and TIDE (1.15 ± 0.23) in decreasing order (P < .0001). Similarly, the average scores of iron-load sensitivity were also highest on TSE (2.90 ± 0.20), followed by TGSE (2.07 ± 0.22) and TIDE (0.47 ± 0.22) in decreasing order (P < .0001). TIDE was less susceptible to CSF and eyeball motion artifacts compared with TSE and TGSE. The average scores of CSF motion artifacts were 2.98 ± 0.09, 1.23 ± 0.39, and 0.98 ± 0.09 for TIDE, TSE, and TGSE, respectively (P < .0001, except P = .0034 between TSE and TGSE). The average scores of eyeball motion artifacts were 2.62 ± 0.34, 2.18 ± 0.52, and 1.88 ± 0.36 for TIDE, TSE, and TGSE, respectively (P < .003). TIDE was more susceptible to nonmotion ghosting artifact, while TSE and TGSE were not. The average scores of nonmotion ghosting artifacts were 1.78 ± 0.34, 2.98 ± 0.09, and 2.97 ± 0.13 for TIDE, TSE, and TGSE, respectively (P < .0001, except P = .572 between TSE and TGSE).
Quantitative Region-of-Interest Analysis of SNRs and CNRs
The SNRs of gray matter (head of the caudate nucleus, putamen, thalamus, and globus pallidus) and white matter (centrum semiovale, corona radiata, anterior periventricular white matter, and posterior periventricular white matter) and the CNRs between gray matter (thalamus and globus pallidus) and white matter (centrum semiovale) are listed in the Table. The SNRs of non-iron-containing gray matter were significantly higher than those of white matter in images acquired from all pulse sequences (P < .001). The SNRs of iron-containing gray matter were significantly lower than those of white matter in TSE and TGSE (P < .001) but significantly higher than those of white matter in TIDE (P < .001). TSE had significantly higher SNRs than TGSE and TIDE regarding all regions of gray matter and white matter (P < .001). The overall mean SNRs of TSE were 1.9–2.0 times those of TGSE and 1.7–2.2 times those of TIDE for brain tissue, respectively. The SNRs in TIDE images were significantly lower than those in the TGSE images regarding all regions of white matter and the head of the caudate nucleus (P < .001) but not significantly different regarding the putamen (P = .364) and thalamus (P = .031). As for iron-containing gray matter such as the globus pallidus, the SNRs of TIDE images were significantly higher than those of TGSE images (P < .001) but were significantly lower than those of TSE images (P < .001).
SNRs and CNRs of TSE, TGSE, and TIDE sequences
The CNR of non-iron-containing gray matter (thalamus) versus the centrum semiovale was highest in TIDE, followed by TSE and TGSE in decreasing order, with statistical significance between TSE and TGSE (P < .0001) and between TIDE and TGSE (P < .0001). The difference in the CNR of non-iron-containing gray matter (thalamus) versus the centrum semiovale between TIDE and TSE, however, was not significant (P = .169). The CNR of iron-containing gray matter (globus pallidus) versus the centrum semiovale was highest in TSE, followed by TGSE and TIDE in decreasing order, with statistical significance between any 2 pulse sequences (P < .0001). While the CNR was of negative value in TSE and TGSE, it was of positive value in TIDE.
Case Demonstration
A 57-year-old woman with a stroke history was scanned by using TSE, TGSE, and TIDE pulse sequences. An axial TSE image at the level of the lateral ventricles showed an old infarction with high signal intensity involving the left corona radiata (Fig 3A). The lesion appeared similarly hyperintense on the TGSE image (Fig 3B) but was somewhat less hyperintenese on the TIDE image (Fig 3C). In addition, an intracerebral hematoma at the late subacute stage was also found at the right corpus striatum, showing hyperintensity on images acquired by using all pulse sequences, with a dark rim, which was more conspicuous on TSE (Fig 3D) and TGSE (Fig 3E) and less obvious on TIDE (Fig 3F), anteromedially. Notable hypointense magnetic susceptibility artifacts involving the anteromedial frontal region were observed on the TIDE image (Fig 3F) but not on TSE or TGSE images.
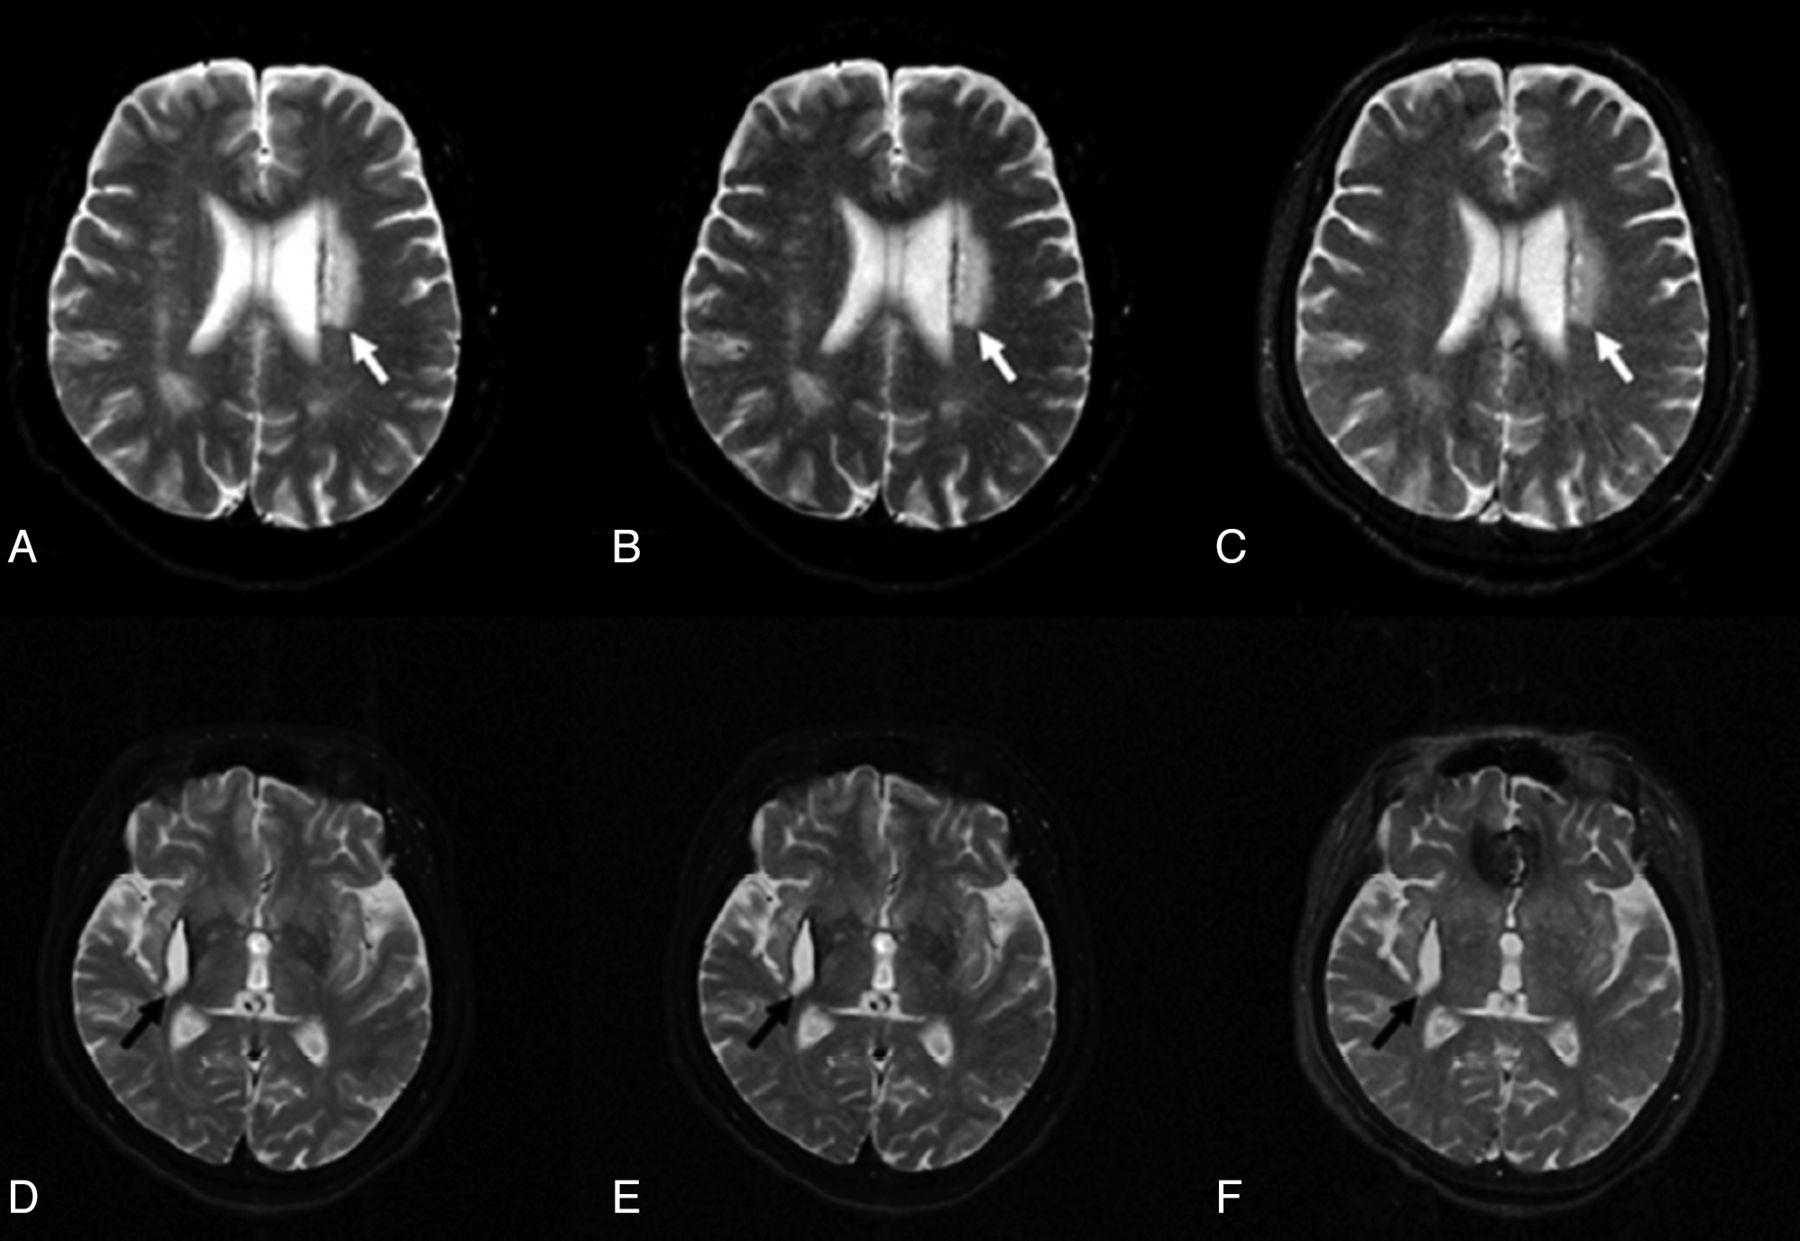
TSE (A, D), TGSE (B, E), and TIDE (C, F) images of a 57-year-old woman with stroke history. A hyperintense lesion appears near the left lateral ventricle (white arrows in A–C). The degrees of hyperintensity are different in these images. Similar contrast of a late subacute hematoma involving the right corpus striatum is found in all sequences (black arrows in D–F).
A second example regarding motion artifacts was demonstrated on coronal TSE T2WI (Fig 4A) in a 9-day-old neonate, in which severe motion degraded the imaging quality, hampering the delineation of brain contour and blurring the cerebral sulci and ventricles (Fig 4A). Such motion artifacts were avoided by using TIDE imaging (Fig 4B), in which the contour of the brain was clearly demonstrated, the cerebral sulci and ventricles were conspicuously depicted, and the superficial cortex and subcortical white matter were successfully differentiated.
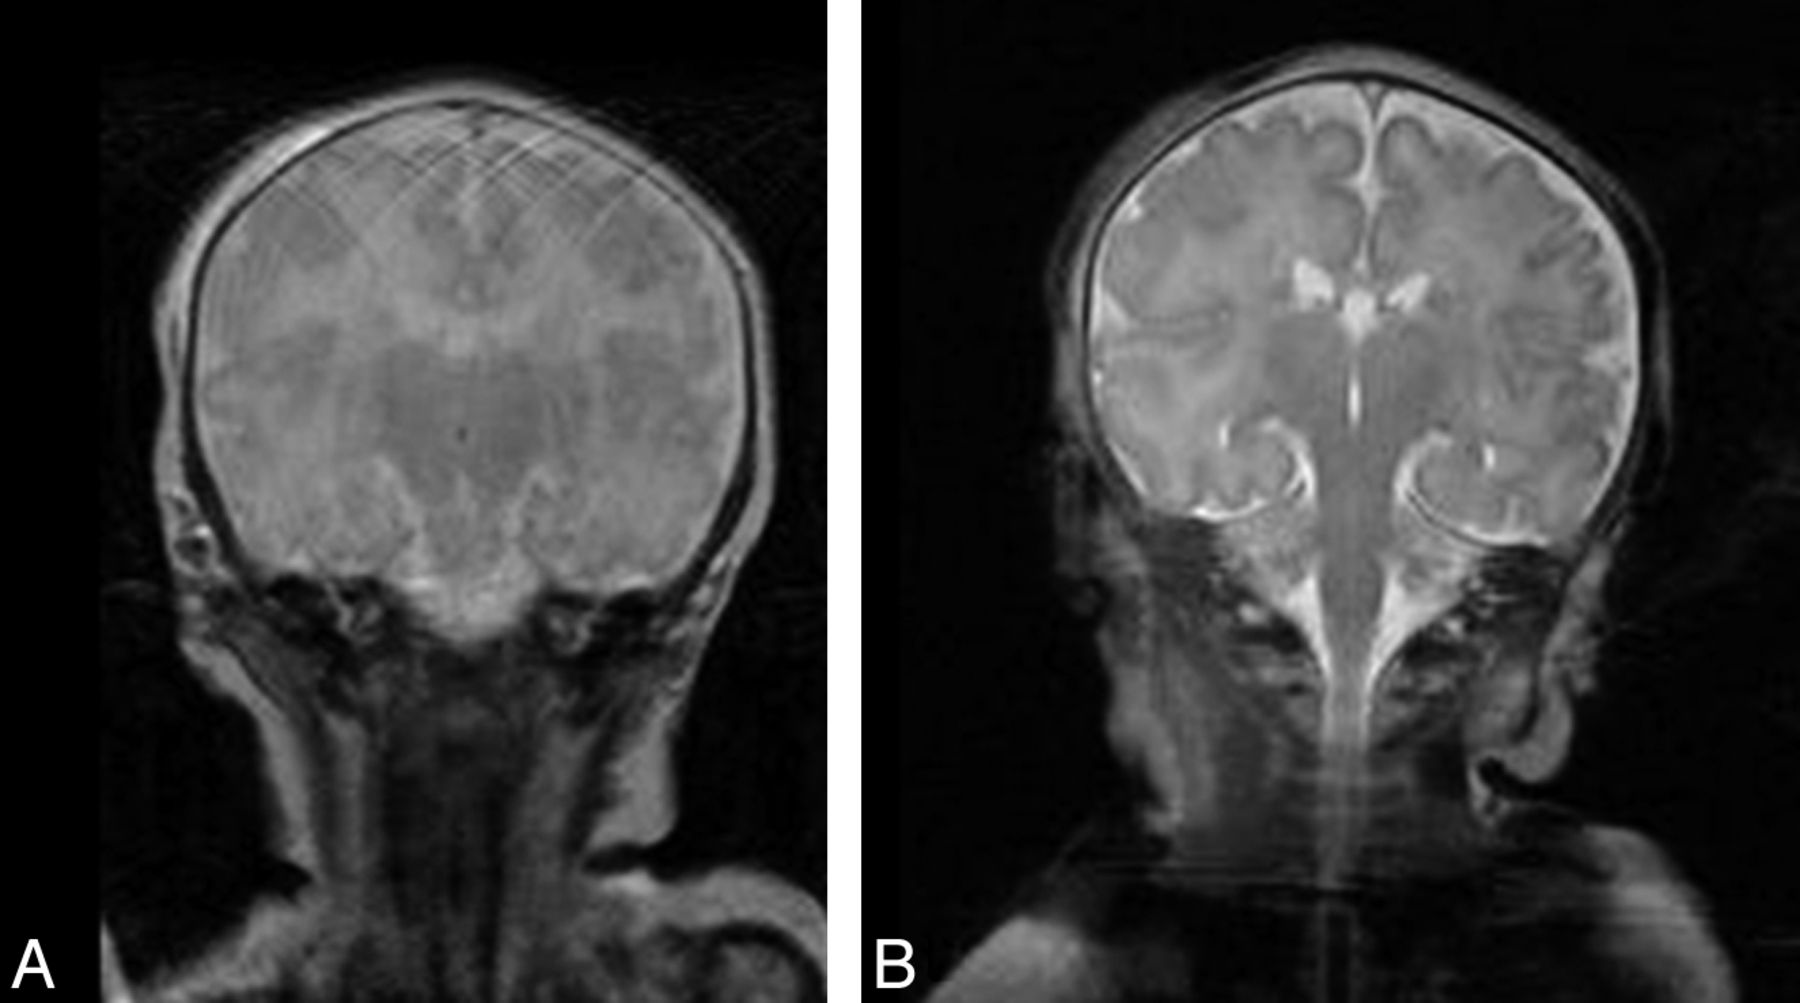
A 9-day-old neonate with seizures, presenting with involuntary movements, was imagined with TSE (A) and TIDE (B) sequences. A motion artifacts-free T2-weighted image can be acquired with TIDE, depicting a clear brain anatomy.
Discussion
Our results show that TIDE is superior to TSE and TGSE through a shortening of the scan time to one-eighth (from 193 to 24 seconds) of the time used in TSE and TGSE acquisitions. The short scan time of TIDE makes it less susceptible to CSF and eyeball motion artifacts compared with TSE and TGSE (Fig 2). While TSE and TGSE were susceptible to CSF motion artifacts (average score = 1.23 and 0.98, respectively), TIDE is almost free of CSF motion artifacts (average score = 2.98). Likewise, TIDE is less susceptible to eyeball motion artifacts (average score = 2.62) than TSE (average score = 2.18) and TGSE (average score = 1.88). In a 26-year-old female volunteer, for example, the trigeminal nerves are blurred on TSE and TGSE partially due to CSF motion artifacts and eyeball motion artifacts (Fig 5A, -B). The TIDE image, which is free of CSF motion artifacts and eyeball motion artifacts, clearly demonstrates the trigeminal nerves (Fig 5C). The rapid imaging acquisition of TIDE (1 image per second) also makes it free from other motion artifacts. While the initial TSE shows severe motion artifacts in a 9-day-old neonate due to his involuntary head movement during the MR imaging, TIDE provides satisfactory imaging quality without the aforementioned motion artifacts (Fig 4). Nevertheless, TIDE is more susceptible to nonmotion ghosting artifacts (average score = 1.78) compared with TSE (average score = 2.98) and TGSE (average score = 2.97). These ghostings are commonly seen on TIDE at certain anatomic regions, including the extracranial region (Fig 1C) and the bases of the middle cranial (Fig 2C) and anterior cranial fossae (Fig 3F) as demonstrated. The origin is related to oscillatory signals in every other phase-encoding arising from the alternative ascending and descending acquisitions in balanced steady-state free precession.17,19
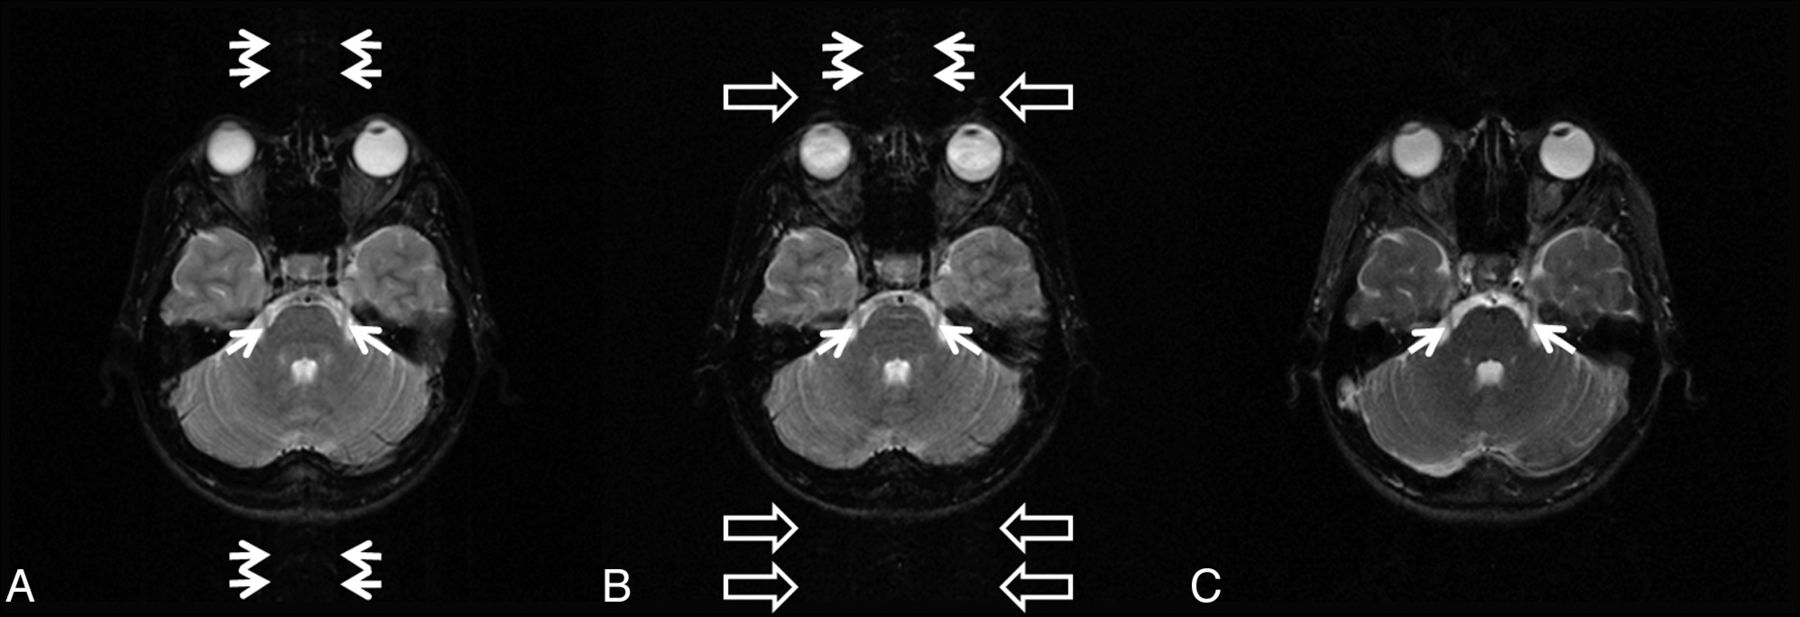
TSE (A), TGSE (B), and TIDE (C) images of a 26-year-old female volunteer. CSF motion artifacts (double arrows) are seen on TSE and TGSE images, while eyeball motion artifacts (open arrows) are seen on the TGSE image. The trigeminal nerves (arrows) are clearly demonstrated on TIDE, which is free of the aforementioned motion artifacts but are somewhat blurred on TSE and TGSE.
Regarding the gray-white matter differentiation, our study shows that TIDE provides poorer gray-white matter differentiation (average score = 1.15) than TGSE (average score = 2.13) and TSE (average score = 2.98) on qualitative analysis. Quantitative analysis of CNRs between gray matter and white matter shows a discrepant result from the aforementioned qualitative analysis. TIDE has a higher CNR (average value = 5.69) between the thalamus (gray matter) and centrum semiovale (white matter) than TSE (average value = 4.95) and TGSE (average value = 2.74). On the other hand, our study shows that TIDE has lower SNRs than TSE and TGSE regarding both gray matter and white matter. The discrepant results suggest that SNR is the dominant factor, compared with CNR, influencing the neuroradiologists' perceptions while judging gray-white matter differentiation in images acquired by using different pulse sequences. In a 40-year-old male volunteer, for example (Fig 6), the SNRs are highest on TSE and lowest on TIDE, while the CNR is highest on TIDE, followed by TSE and TGSE in decreasing order. The gray-white matter junctions are clearly demonstrated on TSE, but blurred on TGSE and TIDE.
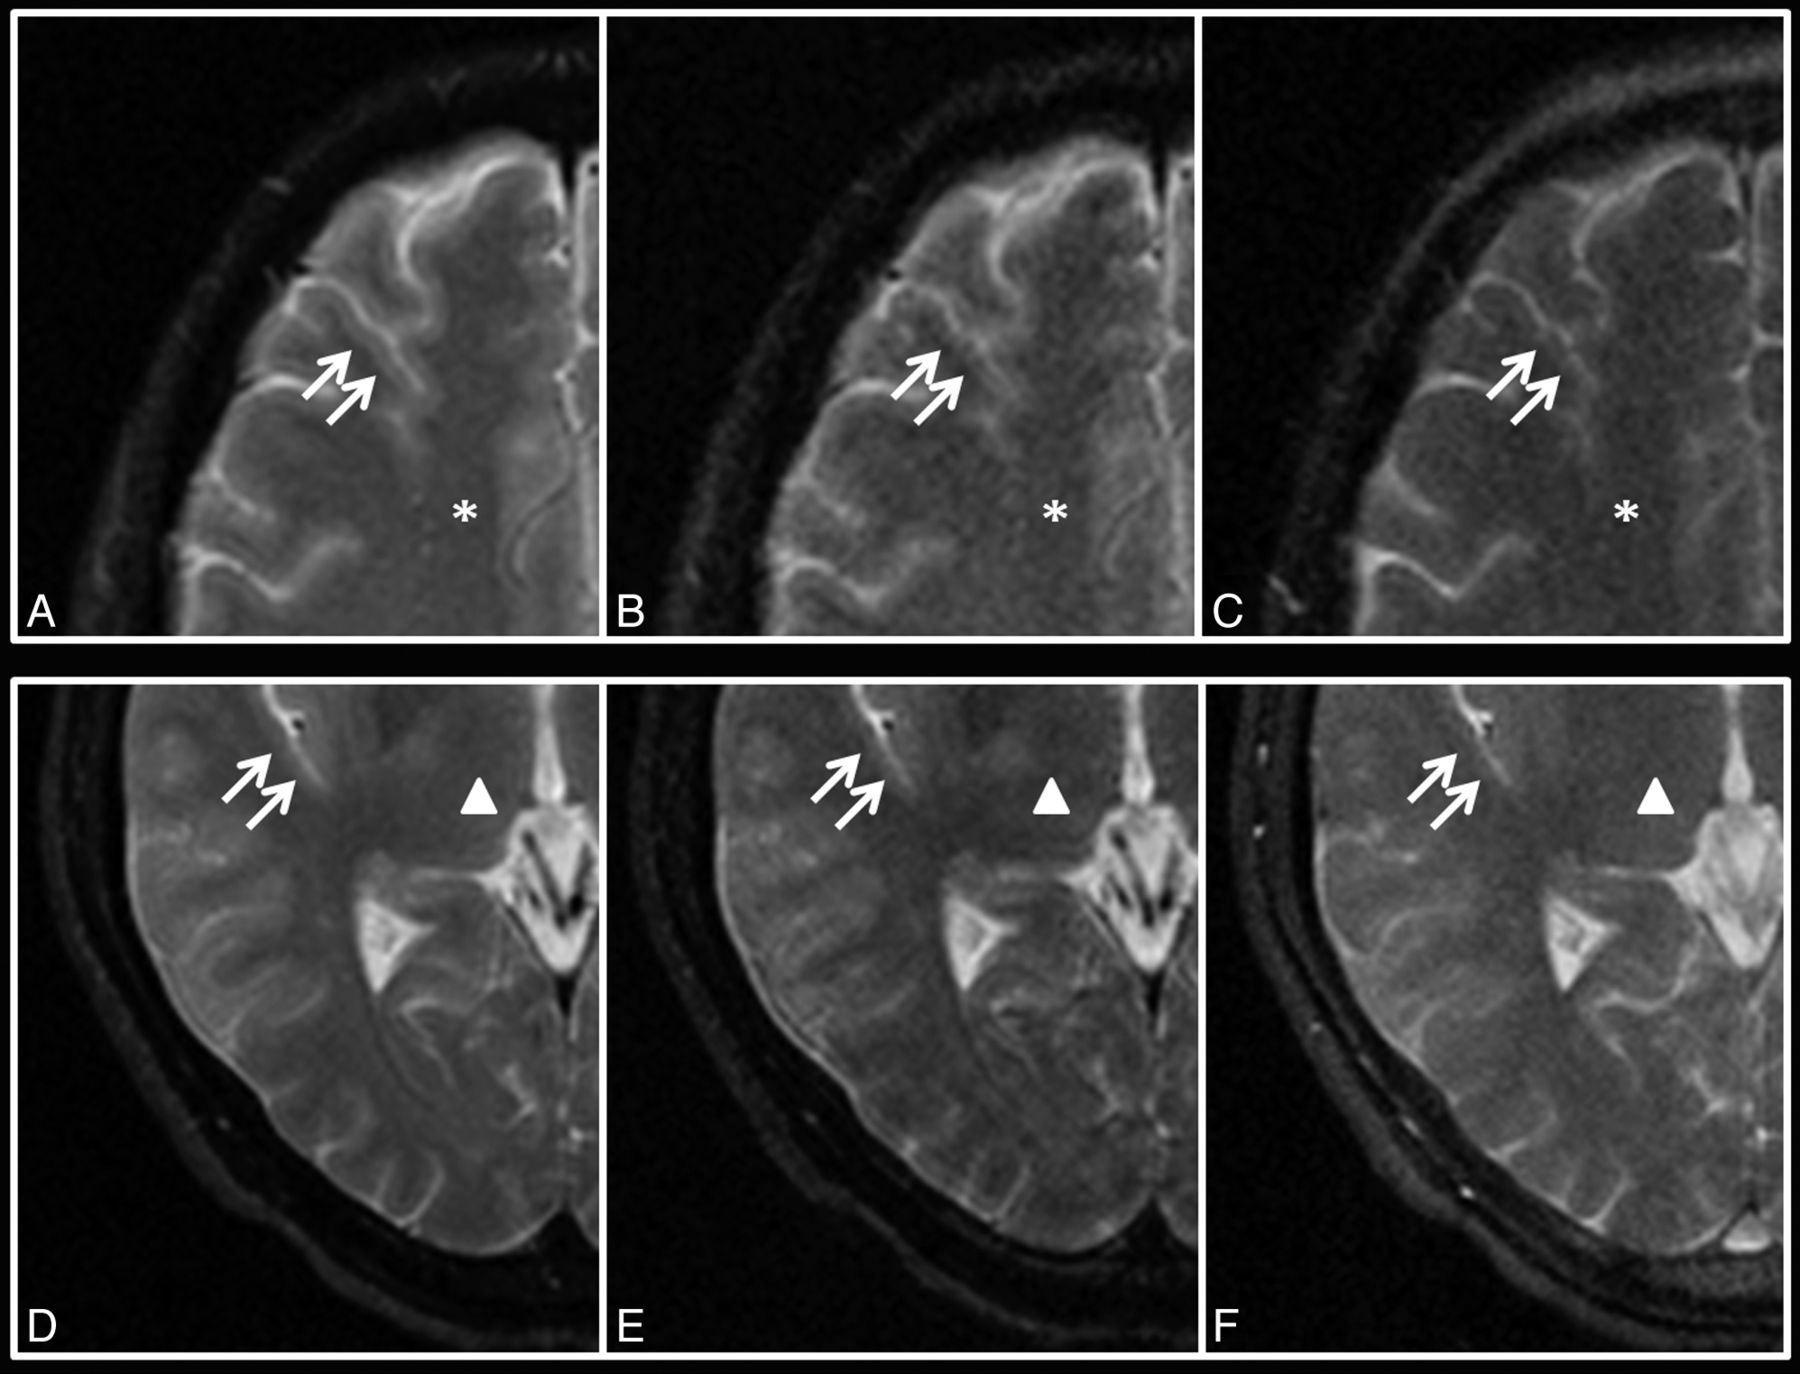
TSE (A, D), TGSE (B, E), and TIDE (C, F) images of a 40-year-old male volunteer at the levels of the centrum semiovale (star, A–C) and thalamus (triangle, D–F). The gray-white matter junctions (double arrows) are clearly demonstrated on TSE but are blurred on TGSE and TIDE.
In our study, the SNR of TIDE is approximately one-half (0.45–0.58) that for TSE. The lower SNR of TIDE might be due to 2 factors, including the half-Fourier acquisition and a higher readout bandwidth used in TIDE. The use of the half-Fourier function in TIDE, with 8 additional k-space lines acquired for Hermitian symmetry calibration, reduces the SNR to 71.84% of the full-Fourier mode value.20 The readout bandwidth used for TIDE (125 kHz) in our study was 2 times of that used for TSE (62.5 kHz), which further explains another ∼0.707 reduction in SNR for TIDE.21 If one takes both of the above effects into account, the overall SNR in TIDE is thus expected to be approximately one-half that in TSE, as shown in our results. The lower SNRs of TIDE might explain the lower qualitative scores of gray-white matter differentiation of TIDE compared with TSE.
TIDE performs worst in detecting iron deposition in the iron-containing gray matter. Our results show that TIDE has the poorest iron-load sensitivity (average score = 0.47) compared with TGSE (average score = 2.07) and TSE (average score = 2.90) on qualitative analysis. The low signal intensity of the globus pallidus on TSE and TGSE has been attributed to the accumulation of nonheme iron, ferritin, which has been shown to cause marked T2 shortening.22 The study of Yamada et al23 has shown that the iron-related susceptibility has caused underestimation of relative cerebral blood flow and relative cerebral blood volume in the globus pallidus. Our results show that TIDE has positive CNRs (average value = 3.28) rather than the negative CNRs of TGSE (average value = −4.49) and TSE (average value = −7.67). The rapid imaging acquisition of TIDE makes it least susceptible to the iron-related signal loss.
Fast imaging methods by using parallel imaging techniques, including sensitivity encoding, simultaneous acquisition of spatial harmonics, and array spatial sensitivity encoding technique, have been shown to reduce the scan time.24⇓–26 However, the reduction of scan time by using parallel imaging techniques is achieved at the cost of reduced SNR, which is inversely proportional to the square root of the acceleration factor.25,27 For example, if an acceleration factor of 8 was used for TSE to achieve a scan time similar to that of TIDE in our study, the SNR would drop to approximately 35.4% of the original value, which is even worse than the SNR performance of TIDE (45%–58%).
There are several limitations in our study. First, we did not acquire coronal and sagittal images on TSE and TGSE sequences. To do that, we would have needed an additional 12 minutes 52 seconds. Thus, the results of our study design only validate the imaging quality on the basis of axial images. Second, qualitative evaluation of imaging was reported on the basis of only 2 experienced raters. Yet since the linearly weighted κ statistics showed substantial interobserver agreement, visual perception from additional neuroradiologists should supposedly yield similar results. Third, we did not collect certain brain pathology for statistical analysis. In our preliminary study, only 2 patients were scanned for demonstration purposes with no statistical analysis performed. Whether TIDE is helpful in lesion detection in patients with involuntary movements (Parkinson disease, tics, neonates, infants, and so forth) deserves further study. On the basis of the limited observations from our study, conspicuity of lesions whose magnetic susceptibility differs from that in surrounding parenchyma, such as iron-containing tissues, hemorrhage, hematoma, or calcification, may need to be paid special attention because of the reduced iron-load sensitivity of the TIDE sequence. On the other hand, regions prone to motion artifacts interferences, such as those adjacent to large vessels, rapid flowing CSF, and the eyeballs, might potentially benefit from the fast scanning characteristics in TIDE imaging.
Conclusions
TIDE provides T2-weighted images with reduced scan times and reduced motion artifacts compared with TSE and TGSE at the trade-off of reduced SNR and poorer gray-white matter differentiation. The fast-scan nature of TIDE might provide a rapid survey, especially in patients with involuntary movements.
Footnotes
Disclosures: Yin-Cheng Kris Huang—RELATED: Grant: National Health Research Institutes, Taiwan, ROC,* Comments: National Health Research Institutes MD PhD/DDS PhD. Predoctoral Fellowship, registration number: DD9803N. *Money paid to the institution.
References
- Received August 21, 2013.
- Accepted after revision October 8, 2013.
- © 2014 by American Journal of Neuroradiology


Jump to section
Related Articles
Cited By...
- No citing articles found.