
Abstract
SUMMARY: We investigated the brain magnetic susceptibility changes induced by natalizumab-associated progressive multifocal leukoencephalopathy. We retrospectively included 12 patients with natalizumab–progressive multifocal leukoencephalopathy, 5 with progressive multifocal leukoencephalopathy from other causes, and 55 patients with MS without progressive multifocal leukoencephalopathy for comparison. MR imaging examinations included T2* or SWI sequences in patients with progressive multifocal leukoencephalopathy (86 examinations) and SWI in all patients with MS without progressive multifocal leukoencephalopathy. Signal abnormalities on T2* and SWI were defined as low signal intensity within the cortex and/or U-fibers and the basal ganglia. We observed T2* or SWI signal abnormalities at the chronic stage in all patients with progressive multifocal leukoencephalopathy, whereas no area of low SWI signal intensity was detected in patients without progressive multifocal leukoencephalopathy. Among the 8 patients with asymptomatic natalizumab–progressive multifocal leukoencephalopathy, susceptibility changes were observed in 6 (75%). The basal ganglia adjacent to progressive multifocal leukoencephalopathy lesions systematically appeared hypointense by using T2* and/or SWI. Brain magnetic susceptibility changes may be explained by the increased iron deposition and constitute a useful tool for the diagnosis of progressive multifocal leukoencephalopathy.
ABBREVIATIONS:
- NTZ
- natalizumab
- PML
- progressive multifocal leukoencephalopathy
Natalizumab (NTZ), an effective treatment in patients with relapsing-remitting multiple sclerosis, is associated with a risk of progressive multifocal leukoencephalopathy (PML).1 Early diagnosis of NTZ-associated PML (NTZ-PML) may improve the functional outcome.2 However, the diagnosis of asymptomatic NTZ-PML remains difficult due to the coexistence of MS lesions and the different imaging patterns of NTZ-PML lesions.3⇓–5
MR imaging is crucial for the recognition of NTZ-PML.1,4⇓⇓–7 The known imaging findings for asymptomatic NTZ-PML include the following: a subcortical location involving U-fibers, a sharp lesional border toward the gray matter contrasting with an ill-defined border toward the white matter, and increased signal intensity on T2-weighted and diffusion-weighted images.5 Postcontrast enhancement and T2WI hyperintense punctate lesions have also been reported in patients with NTZ-PML.4,5,8
To our knowledge, there are no data available on the susceptibility changes, evaluated by gradient-echo T2* or susceptibility-weighted images, in a cohort of consecutive patients with NTZ-PML. Our purpose was to investigate the brain magnetic susceptibility changes, detected on T2* or SWI, in a cohort of consecutive patients with NTZ-PML.
Case Series
Patients.
This retrospective study was approved by our institutional review board. From February 2011 to August 2014, 17 consecutive patients, including 12 patients with relapsing-remitting multiple sclerosis treated with NTZ, 2 with leukemia, 2 treated with immunosuppressive therapies after liver or renal transplant, and 1 with neurosarcoidosis (8 women; mean age, 48.7 years; range, 26–63 years), were diagnosed with PML on the basis of the following:
Suggestive clinical and imaging findings associated with positive DNA polymerase chain reaction for the John Cunningham virus in the CSF, in 15 patients (“definite PML” according to the American Academy of Neurology criteria9)
Highly suggestive imaging and clinical follow-up for 2 patients treated with NTZ (patients 10 and 12) for whom iterative CSF examination findings were negative.
Characteristics of patients are summarized in the On-line Table. Patient 2 underwent postmortem brain neuropathologic examination.
Eighty-six brain MR imaging scans (Achieva 1.5T [n = 32], 3T [n = 54]; Philips Healthcare, Best, the Netherlands) were obtained in these 17 patients with PML (mean MR images per patient, 4.9; range, 1–10). MR imaging was performed at asymptomatic (n = 8), symptomatic (n = 17), immune reconstitution inflammatory syndrome (n = 19), and chronic/follow-up stages (n = 42). MR imaging protocol included pre- and postcontrast T1WI, T2WI, fluid-attenuated inversion recovery, and diffusion MR images. The gradient-echo T2* sequence was available in 67 MR imaging examinations; SWI, in 19.
Fifty-five consecutive patients with MS and without NTZ-PML (37 women; mean age, 44.2 years; range, 22–61 years; 23 with clinically isolated syndrome, 32 with relapsing-remitting multiple sclerosis) served as a control group. SWI was performed in all controls at 3T (55 MR imaging examinations, Achieva 3T, Philips Healthcare).
Image Analysis
Three experienced neuroradiologists (J.H., X.L., and J.-P.P.) reviewed the 141 MR imaging examinations available in consensus. For each MR image, they assessed the signal abnormalities on T2* or SWI defined as
Areas of low signal intensity within the cortex and/or the U-fibers.
Low signal intensity and asymmetry of the signal of the basal ganglia.
In patients with NTZ-PML, consecutive MR images were also reviewed to analyze the longitudinal changes in each patient regarding signal intensity on T2* and SWI.
Results
PML Lesions
Twenty supratentorial and 4 infratentorial PML lesions were visible in the 17 patients with PML involving the frontal (n = 6, right; n = 4, left), parietal (n = 6, left), occipital (n = 2, right), and temporal (n = 1, right; n = 1 left) lobes or the middle cerebellar peduncle (n = 1, right; n = 3, left). In 2 patients (patients 1 and 13), PML was confined to the middle cerebellar peduncle. Eight patients (11 PML lesions) were explored at the asymptomatic stage, including 6 patients with ≥1 subcortical supratentorial PML lesion, 1 with an infratentorial lesion (patient 1), and 1 with both supra- and infratentorial lesions (patient 11).
Cortex and U-Fibers
Patient imaging findings are summarized in the On-line Table.
When considering the subcortical PML lesions with MR imaging available at the chronic stage (18 lesions), T2* and/or SWI demonstrated areas of cortical low signal intensity in all cases.
For 8 patients (with 11 NTZ-PML lesions), MR imaging, including T2* and/or SWI, was available at the presymptomatic stage. Of the 8 patients scanned at the presymptomatic stage, susceptibility changes were visible in 6 (75%), including 6 PML lesions (55%): 4 small subcortical lesions (2 observed with SWI and 2 with T2*; patients 4, 6, 9, and 12; Fig 1) and 2 lesions involving the middle cerebellar peduncles. For 5 subcortical PML lesions (45%), the cortical low T2* signal intensity was not visible initially at the presymptomatic stage and only appeared at the chronic stage. U-fiber low-signal intensity on SWI is shown in Fig 2.

Susceptibility-weighted, FLAIR, and diffusion images in patient 9 with unilobar left frontal NTZ-PML at the asymptomatic stage. A hypointense rim involving the cortex and the U-fibers of the left frontal lobe is visible on SWI (A, arrow). The NTZ-PML lesion appears hyperintense on FLAIR (B, arrow) and diffusion (C, arrows) images.

In patient 11 at the symptomatic stage, the NTZ-PML lesion appears hyperintense on the FLAIR image involving the right precentral gyrus (A, arrows). The SWI sequence reveals a hypointense rim involving the U-fibers adjacent to the PML lesion (B, arrows).
Longitudinal changes were observed in 8 patients (9 PML lesions), with cortical T2* and/or SWI low signal intensity appearing or becoming more prominent.
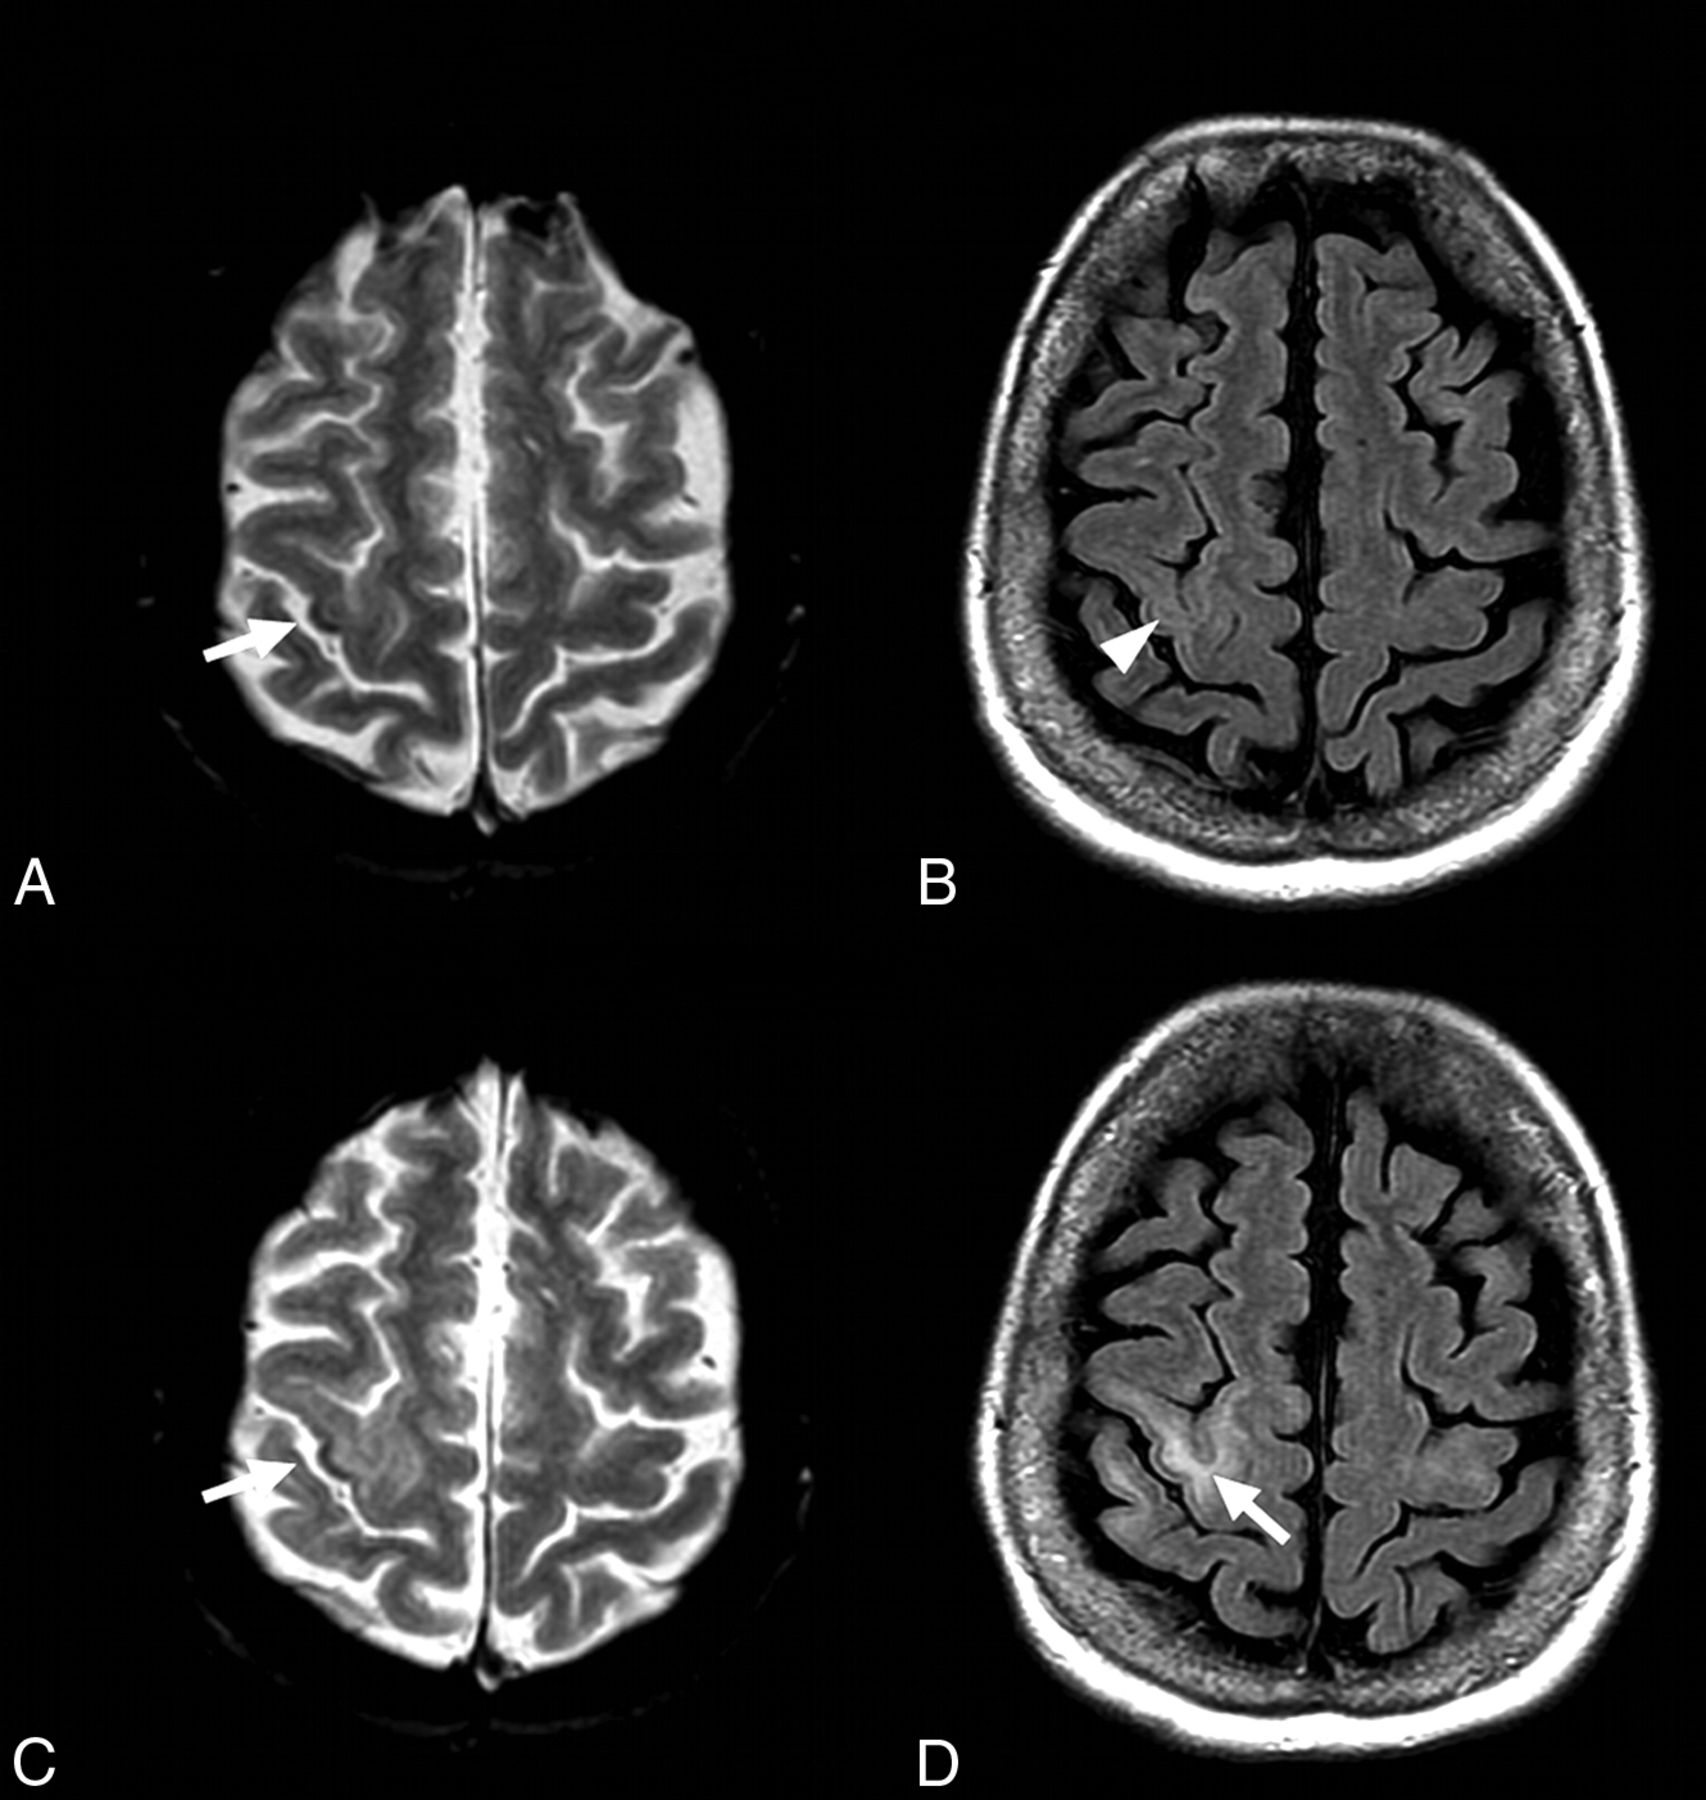
Cortical or U-fiber T2* hypointensity was systematically adjacent to a PML lesion, hyperintense on FLAIR images. However, only a faint FLAIR hyperintensity was visible adjacent to the area of cortical T2* hypointensity for 3 MR imaging examinations: 2 performed at the symptomatic stage in patient 7 and 1 performed at the asymptomatic stage in patient 12 (Figs 3 and 4, respectively).

FLAIR and T2* images in patient 7 at the symptomatic stage. Cortical low signal intensity is visible on T2* images (A, arrowheads) adjacent to the hyperintense PML lesion (A–C, arrows). Such cortical T2* signal abnormality is also visible (C, arrowhead) with only subtle adjacent hyperintensity on FLAIR images (D, arrowhead). Note the low signal intensity of the left basal ganglia on both T2* and FLAIR images (E and F, arrowheads) adjacent to the insular PML lesion (E and F, arrows).
FLAIR and T2* images in patient 12 with NTZ-PML at asymptomatic and symptomatic stages. At the asymptomatic stage, a small area of cortical low signal intensity is visible on T2* image within the right central sulcus (A, arrow), with faint signal abnormalities on FLAIR image (B, arrowhead). At the symptomatic stage, the cortical hypointensity on T2* image is more prominent (C, arrow), while subcortical FLAIR hyperintensity is obvious (D, arrow).
Cortical low T2* signal intensity was associated with T1WI hyperintensity in 2 patients (patients 2 and 4) at the chronic stage. For all subjects, the areas of low signal intensity did not match contrast enhancement or diffusion restriction.
A phase map was available in patients scanned with the SWI sequence, showing a paramagnetic dipole matching the low signal intensity observed on magnitude images, suggesting iron deposition.
MR imaging was only available at the chronic stage for patient 2, for whom a postmortem pathologic specimen revealed astrocytic gliosis associated with abundant microglial and macrophage infiltrate within the area of cortical low T2* signal intensity previously visible on T2* images (Fig 5). Macrophages contained degraded myelin-filled vacuoles, and there was no visible calcification or hemorrhage.

T2* and T1WI at the chronic stage and pathologic specimen (hematoxylin-eosin staining) of patient 2. An extensive PML lesion is visible involving the left frontal and parietal white matter. Low signal intensity of the left precentral cortex is visible on T2* image (A, arrow), matching the hyperintensity on T1WI (B, arrow). Pathologic specimen reveals a loss of distinction between GM and WM (C, arrows) as well as microglial and macrophage infiltrate of the cortical neuropile (D, arrowheads; hematoxylin-eosin staining, high-power objective).
Basal Ganglia
Asymmetric T2* hypointensity within the basal ganglia was systematically observed when PML was adjacent to the deep gray matter (7 patients, 8 PML lesions) at any stage (Figs 3 and 6), including the presymptomatic stage for patients 1 and 11.

FLAIR and SWI in patient 8 at symptomatic and chronic stages. At the symptomatic stage, an extensive PML lesion is visible on FLAIR images involving the right frontal and temporal white matter and the brain stem (A and B, arrows). Note the low signal intensity of the right lenticular nucleus on FLAIR images (B, arrowheads). At the chronic stage, the SWI sequence revealed decreased signal-intensity of the right substantia nigra (C, arrow) compared with the left (C, arrowhead). SWI minimal-intensity-projection view confirms this pattern of asymmetric hypointensity involving the right lenticular nucleus and substantia nigra, adjacent to the PML lesion (D, arrows).
Consecutive MR images revealed the progressive decrease of signal of the basal ganglia with PML expansion on FLAIR and T2* images for 3 patients once the PML lesion became adjacent to the deep GM.
No low signal intensity was observed within the cortex, U-fibers, or basal ganglia in controls.
Discussion
All the consecutive patients with PML showed at least 1 area of low T2* or SWI signal intensity, involving deep or cortical gray matter, except 1 patient scanned only at the symptomatic stage. Such data may be clinically relevant because we did not observe this finding in consecutive patients with MS without PML. Brain magnetic susceptibility changes may be observed in patients with PML at the presymptomatic stage, while the findings are subtle by using other MR images such as FLAIR; such findings suggest a potential added value for T2* or SWI sequences in patients suspected of having PML. In addition, susceptibility changes induced by PML do not appear specific to NTZ-PML.
The underlying cause of signal hypointensity on T2* and SWI in patients with NTZ-PML remains unclear. In patients with an asymmetric hypointensity involving the basal ganglia, phase maps revealed a paramagnetic dipole, ruling out asymmetric physiologic calcifications. Moreover, our pathologic case may suggest that an accumulation of iron within the macrophages could potentially explain these findings. Iron accumulation in the deep GM of patients with MS is strongly associated with the duration and severity of the disease. Increases in iron deposition in subcortical regions were recently demonstrated in patients with MS by using quantitative susceptibility and R2* mapping.10 This effect was strongly correlated with myelin degeneration along the WM skeleton and the Expanded Disability Status Scale.10 Most interesting, while SWI has been extensively evaluated in patients with MS, such low signal intensity on T2* or susceptibility-weighted MR images had never been previously reported in patients with MS plaques, active or not, to our knowledge. Indeed, we may hypothesize that PML lesions could differ from MS plaques by further increasing myelin degeneration and thus intracellular accumulation of iron within macrophages and microglial cells. Why some PML lesions are associated with T2*/SWI subcortical hypointensity and some are not at the presymptomatic stage remains unclear. We hypothesize that iron deposition may be increased in case of high local iron storage capacity (in the lenticular nucleus, dentate nucleus, and maybe the precentral cortex) or in case of high local myelin content (in the middle cerebral peduncle or pyramidal tract).
Our study had some limitations. We included a relatively small number of patients with NTZ-PML, and the John Cunningham virus DNA polymerase chain reaction was negative in 2. However, the diagnosis of NTZ-PML may be challenging, including negative findings on CSF examinations, as previously reported.11 Different MR imaging scanners (1.5T and 3T) were used in this retrospective study. However, to assess longitudinal changes with time, we compared MR images obtained at the same MR imaging field strength and with the same MR sequence. In this preliminary clinical report, we did not assess the diagnostic accuracy of low signal intensity on T2* and SWI for the diagnosis of NTZ-PML. Indeed both T2* and SWI sequences were used in patients with NTZ-PML at asymptomatic, symptomatic, and chronic stages. Susceptibility-weighted or T2* MR images are sensitive to nonuniform B1 or B0; however, no area of low signal intensity was observed in the control group, demonstrating that the reported signal anomalies were not related to artifacts. The absence of signal abnormalities observed in patients with MS without PML may also suggest a high specificity of this finding. Further prospective studies are required to assess its real specificity for the diagnosis of asymptomatic NTZ-PML. Finally, the control group used in our study did not match the group of patients with PML in terms of sex, disease severity, and treatment.
Conclusions
Our study showed that PML, related to NTZ or not, induces brain magnetic susceptibility changes within U-fibers or deep gray matter, visible on T2* or SWI and potentially explained by iron deposition. Such findings were observed at the presymptomatic stage with potential implications for patient care.
Footnotes
Disclosures: Patrick Vermersch—RELATED: Grant: Biogen Idec*; Consulting Fee or Honorarium: Biogen Idec; Support for Travel to Meetings for the Study or Other Purposes: Biogen Idec; UNRELATED: Board Membership: Biogen Idec, Teva, Sanofi, Almirall, Merck-Serono, Novartis; Consultancy: Biogen Idec, Novartis, Bayer, Sanofi, Almirall, Merck-Serono, Teva. Olivier Outteryck—UNRELATED: Grants/Grants Pending: Biogen Idec, Novartis, Bayer-Schering, Comments: both direct payment and payment to the institution (grant for research); Payment for Lectures (including service on Speakers Bureaus): Biogen Idec; Travel/Accommodations/Meeting Expenses Unrelated to Activities Listed: Novartis,* Biogen Idec,* Merck-Serono,* Sanofi,* Teva.* Arnaud Lacour—UNRELATED: Board Membership: Octapharma*; Expert Testimony: LFB (both direct payment and payment to the institution); Payment for Lectures (including service on Speakers Bureaus): LFB, Pfizer, Octapharma, Merz; Travel/Accommodations/Meeting Expenses Unrelated to Activities Listed: Biogen Idec,* Novartis,* Pfizer,* Teva,* LFB.* *Money paid to the institution.
REFERENCES
- Received January 23, 2015.
- Accepted after revision April 10, 2015.
- © 2015 by American Journal of Neuroradiology


Jump to section
Related Articles
Cited By...
- Progressive multifocal leukoencephalopathy after fingolimod treatment
- Current and Emerging Therapies in Multiple Sclerosis: Implications for the Radiologist, Part 2--Surveillance for Treatment Complications and Disease Progression
- REPLY:
- Low Signals on T2* and SWI Sequences in Patients with MS with Progressive Multifocal Leukoencephalopathy