
Abstract
BACKGROUND AND PURPOSE: Acute markers of spinal cord injury are essential for both diagnostic and prognostic purposes. The goal of this study was to assess the relationship between early MR imaging biomarkers after acute cervical spinal cord injury and to evaluate their predictive validity of neurologic impairment.
MATERIALS AND METHODS: We performed a retrospective cohort study of 95 patients with acute spinal cord injury and preoperative MR imaging within 24 hours of injury. The American Spinal Injury Association Impairment Scale was used as our primary outcome measure to define neurologic impairment. We assessed several MR imaging features of injury, including axial grade (Brain and Spinal Injury Center score), sagittal grade, length of injury, maximum canal compromise, and maximum spinal cord compression. Data-driven nonlinear principal component analysis was followed by correlation and optimal-scaled multiple variable regression to predict neurologic impairment.
RESULTS: Nonlinear principal component analysis identified 2 clusters of MR imaging variables related to 1) measures of intrinsic cord signal abnormality and 2) measures of extrinsic cord compression. Neurologic impairment was best accounted for by MR imaging measures of intrinsic cord signal abnormality, with axial grade representing the most accurate predictor of short-term impairment, even when correcting for surgical decompression and degree of cord compression.
CONCLUSIONS: This study demonstrates the utility of applying nonlinear principal component analysis for defining the relationship between MR imaging biomarkers in a complex clinical syndrome of cervical spinal cord injury. Of the assessed imaging biomarkers, the intrinsic measures of cord signal abnormality were most predictive of neurologic impairment in acute spinal cord injury, highlighting the value of axial T2 MR imaging.
ABBREVIATIONS:
- AIS
- American Spinal Injury Association Impairment Scale
- BASIC
- Brain and Spinal Injury Center
- MCC
- maximum canal compromise
- MSCC
- maximum spinal cord compression
- NL-PCA
- nonlinear principal component analysis
- PC
- principal component
- SCI
- spinal cord injury
Early biomarkers of spinal cord injury (SCI) are essential during the acute phase of injury, a time when crucial management decisions are made and a period of great prognostic anxiety for patients and families.1⇓–3 As emerging experimental therapies translate to the clinic, early biomarkers will also be important for patient selection and monitoring in clinical trials. Multiple potential MR imaging biomarkers exist to evaluate acute SCI.1,4⇓⇓⇓⇓⇓⇓⇓⇓⇓⇓⇓⇓⇓⇓⇓–20 These measures primarily focus on the sagittal imaging plane, examining factors such as length of T2-hyperintense signal within the cord, whether abnormal signal is confined or spans multiple vertebral levels, presence of hemorrhage, and secondary markers of cord injury such as spinal cord compression and spinal canal compromise.1,5⇓⇓⇓⇓⇓⇓⇓⇓⇓⇓⇓⇓⇓⇓⇓⇓–22 The internal structure of the spinal cord, with predominantly longitudinally oriented WM tracts, suggests that the axial injury extent and WM sparing should also be strong predictors of outcome. This concept has been demonstrated in preclinical studies and recently in human studies introducing an axial scoring system known as the Brain and Spinal Injury Center (BASIC) score.4,23⇓⇓⇓⇓⇓⇓–30 However, until now, it has been unclear how the axial grading relates to other imaging biomarkers of the sagittal plane and extrinsic compression measures.
The various MR imaging–based metrics have been shown to be reproducible, and all have some individual degree of predictive validity for clinical outcome.1,4⇓⇓⇓⇓⇓⇓⇓⇓⇓⇓⇓⇓⇓⇓⇓–20 Here, we evaluated the relationships of these MR imaging metrics to each other and to neurologic impairment. We applied a data-driven tool, nonlinear principal component analysis (NL-PCA), to understand the relationship between different MR imaging biomarkers and assess their ability to predict neurologic impairment. NL-PCA detects statistical patterns, incorporating multiple variables independent of their scale and decomposing them into a smaller set representing multidimensional clusters of variables (principal components [PCs]) that covary.31,32 We then used nonlinear regression approaches to benchmark different MR imaging assessments against each other for predicting neurologic impairment at discharge. We hypothesized that MR imaging measures of acute cervical SCI would group together as a coherent multivariate PC ensemble and that distinct PCs (PC1, PC2, etc) would predict neurologic impairment. We intended 1) to provide insight into relationships between early MR imaging biomarkers after acute cervical SCI and 2) to provide an evaluation of the predictive validity of each individual measure of neurologic impairment.
Materials and Methods
Study Cohort
This study was HIPAA and institutional review board compliant. We performed a retrospective cohort study of patients with acute blunt cervical SCI evaluated at a Level I trauma center (Zuckerberg San Francisco General Hospital) from 2005 to 2014. Inclusion criteria were 1) blunt acute cervical SCI, 2) age ≥18 years, 3) presurgical cervical spine MR imaging performed within 24 hours after injury, and 4) documented American Spinal Injury Association Impairment Scale (AIS) at both admission and discharge. Exclusion criteria were 1) penetrating SCI, 2) surgical decompression and/or fusion before MR imaging, 3) MR imaging that was too degraded by motion or other artifact such that images were nondiagnostic, and 4) preexisting surgical hardware. Of 212 patients initially identified, 95 patients met all inclusion and exclusion criteria and were included in the study. The data collected included sex and age, AIS at admission and discharge (as documented in the chart and performed by appropriately trained physiatrists and neurosurgeons), hours to MR imaging from time of injury, days to discharge, and whether surgical decompression of the cervical spine was performed before discharge. Fifty-two of the 95 patients included in this study were included in a cohort of patients as part of a previously published study.4 This prior, smaller study involved initial development and interrater reliability testing of the BASIC score, whereas the current study tests multiple MR imaging grading schemes against each other, and against neurologic outcome, by using multivariate statistical analysis.
MR Imaging
All MR imaging examinations were acquired on the same 1.5T Genesis Signa scanner (GE Healthcare, Milwaukee, Wisconsin). We assessed sagittal T2 FSE, sagittal T1, and axial T2 FSE sequences performed as part of our routine imaging protocol, with these sequences not substantially changing over the study interval. Additional sequences performed as part of our trauma imaging protocol were not evaluated. Sequences were performed with the following parameters (presented as mean ± standard deviation from 10 randomly selected examinations): 1) for axial T2 FSE through the entire cervical spine: TR, 3798 ms ± 586 ms; TE, 102 ms ± 6 ms; section thickness, 3 ms; echo-train length, 17 ± 3.4; in-plane FOV, = 160 × 160 mm with a 512 × 512 matrix for nominal in-plane resolution of 0.31 mm2; 2) for sagittal T2 FSE: TR, 3585 ms ± 563 ms; TE, 105 ms ± 5 ms; section thickness, 3 mm; echo-train length, 17.1 ± 3; in-plane FOV, 200 × 200 mm; and 3) for sagittal T1: TR, 528 ms ± 103 ms; TE, 16 ms ± 1.3 ms; section thickness, 3 mm; echo-train length, 2.6 ± 0.8; and in-plane FOV, 200 × 200 mm with a 512 × 512 matrix for nominal in-plane resolution of 0.39 mm2.
Image Analysis
A neuroradiology fellow (M.C.M.) and attending physician (J.F.T.) performed consensus MR imaging ratings for all metrics while blinded to clinical outcome. The interrater reliability and BASIC axial MR imaging grading have been previously described as follows4,30: grade 0, no cord signal abnormality; grade 1, T2 hyperintensity confined to GM; grade 2, intramedullary T2 hyperintensity extends beyond expected gray matter margins to involve spinal white matter, but does not involve entire transverse extent of the spinal cord; grade 3, T2 hyperintensity involving GM and some but not all of WM; grade 4, T2 hyperintensity involving the entire axial plane of the spinal cord; grade 5, grade 3 injury with the addition of foci of T2 hypointensity consistent with hemorrhage. Sagittal grading was assigned as previously described: grade 1, no spinal cord signal abnormality; grade 2, single-level T2 hyperintensity; grade 3, >1 vertebral level T2 signal hyperintensity; grade 4, T2 signal hyperintensity with areas of hypointensity representing hemorrhage.1,19 The greatest length (mm) of injury on sagittal T2 was measured as described in the National Institutes of Health/National Institute of Neurologic Disorders and Stroke SCI common data elements version 1.0.3 Maximum canal compromise (MCC) and maximum spinal cord compression (MSCC) assessed midsagittal images by dividing the anteroposterior diameter of the canal (on sagittal T1 for MCC) and the anteroposterior diameter of spinal cord (on sagittal T2 for MSCC) by the average of the canal or spinal cord above and below as previously described.8,15,16,22
Multidimensional Analysis Workflow and Statistical Analysis
NL-PCA assessed the relationship among MR imaging measures by incorporating pattern detection with optimal-scaling transformations to accommodate nonparametric, ordinal, and nonlinear relationships that are common in clinical assessment tools such as MR imaging scoring by a radiologist.33,34 Established decision rules defined the final dimensionality: Kaiser rule criterion of eigenvalue >1 and Cattell rule (ie, scree plot).33⇓⇓–36 Validity of MR imaging and PC scores for predicting AIS at discharge involved linear mixed model, Spearman rank correlation, and an optimal-scaled regression.
Receiver operating characteristic curves assessed sensitivity and specificity of MR imaging measures for predicting AIS at discharge by using a sliding scale (ie, AIS A versus B, C, D, E; AIS A, B versus C, D, E; AIS A, B, C versus D, E; and AIS A, B, C, D versus E), resulting in 4 separate receiver operating characteristic curves. In addition, we completed a supplementary analysis where we compared adjacent groups. Because of the low number of patients in the AIS B subgroup (n = 3), AIS A and B were grouped together as a motor complete group. We compared the areas under the curve of the different MR imaging biomarkers.
In a next step, we used discriminant function analysis to assess within the BASIC measure the optimal combination of scores to discriminate the different AIS groups. BASIC score was recoded as: 1) a simple lesion/no lesion score (BASIC 0 = no lesion, and BASIC 1–4 = any lesion) and 2) into a 3-point scale merging BASIC score subcategories 1–3 into 1 category. All MR imaging variables and the 2 recoded BASIC score variables were fed into a discriminant function analysis test for discrimination of AIS at discharge. Statistical significance for all tests was set at α = .05. All statistical analyses were performed in SPSS v.23 (IBM, Armonk, New York). Syndromic plots for the PC loadings were generated in custom-designed software in R (http://www.r-project.org/).37
Results
Patient characteristics are listed in Table 1. MR imaging measurements are outlined in Table 2 and Fig 1. The relationships between the BASIC score and AIS at discharge are listed in Table 3. NL-PCA demonstrated all imaging parameters loaded highly on PC1. PC2 discriminated MR imaging measures, with only MSCC and MCC showing high loadings (On-line Fig 1A). Statistical decision rules pruned the initial 5-dimensional NL-PCA solution to 2 dimensions (On-line Fig 1B). The optimal-scaled transformation matrix revealed a high correlation between the lesion length, sagittal grade, and the BASIC score and, to a lesser extent, between the compression variables (MSCC and MCC) (Fig 2A). The loading patterns of the 2-dimensional NL-PCA solution are displayed in Fig 2B. PC1–2 accounted for 88.6% of the total variance in the dataset (PC1, 58.6%; PC2, 30%). All imaging variables loaded highly on PC1. Variance explained by PC1 represents convergence across all MR imaging variables. In contrast, PC2 mainly captures compression variables MSCC and MCC, representing divergence of the MR imaging variables of intrinsic cord signal abnormality.
Patient characteristicsa
MRI scoring schemes

MR imaging-based metrics. A and B, Sagittal T2-weighted MR imagings of the cervical spine of patients with acute SCI were used to measure the length of T2 signal hyperintensity in mm (A, white line) and to calculate MSCC (B, 1 − {di/[(da + db)/2]} × 100%). di indicates distance of the spinal cord at the injury site; db, one segment below the injury site; da, one segment above the injury site. C, Sagittal T1-weighted image of the cervical spine demonstrating how we used this sequence to measure MCC (1 − {Di/[(Da + Db)/2]} × 100%). Di indicates distance of the spinal canal at the injury site; Db, one segment below the injury site; Da, one segment above the injury site. D, The axial T2-weighted MR imaging of the cervical spine at the level of the epicenter of injury was used to define the BASIC score. Areas of macroscopic T2-hypointense hemorrhage are surrounded by hyperintense edema with no normal cord signal, consistent with BASIC grade 4. BASIC axial grade cartoons are depicted in the lower panel. E, Shows cartoons of the sagittal grading system. Sag indicates sagittal.
BASIC score in relation to AIS at dischargea
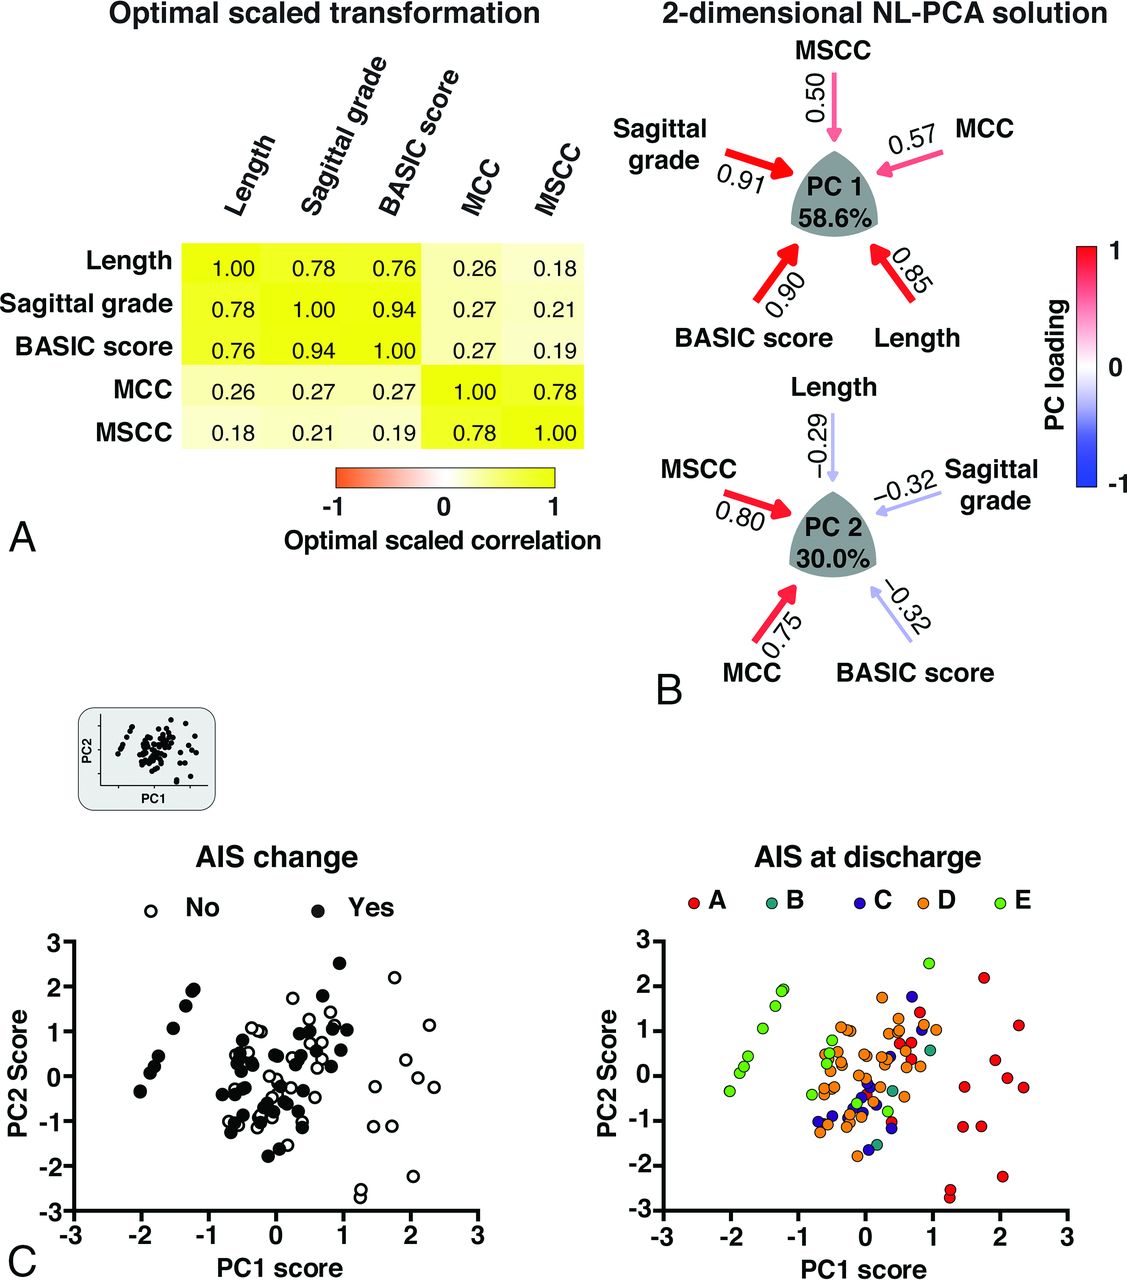
Results of the 2-dimensional NL-PCA. A, Heat map of the optimal-scaled transformation matrix of all MR imaging measures included in the NL-PCA. The matrix indicates all bivariate cross-correlations: yellow indicates a positive relationship and orange indicates a negative relationship. B, 2-dimensional NL-PCA solution. PCs reflect the clustered variance shared by the MR imaging measures and are represented by a convex triangle. The arrow gauge and the intensity of the color (red indicates a positive relationship and blue indicates a negative relationship) show the magnitude (ie, loading weights) of the correlation between each MR imaging measure and the PC. C, Bi-plots of individual patients (n = 95) in the 2-dimensional space described by PC1 and PC2. In the top left corner, the extracted bi-plot is displayed. In the left graph, the same bi-plot is color-coded by AIS change (ie, AIS change from admission to discharge) and is color-coded in the right graph by AIS at discharge. PCA indicates principal component analysis.
In Fig 2C, individual PC scores are projected into PC1 and PC2 space, with each patient color-coded by AIS change and by AIS grade at discharge. Patients with higher scores on the PC1 axes have worse AIS at discharge. Confirming this, a linear mixed model revealed that PC1, but not PC2, significantly predicted AIS at discharge (PC1: F = 33.79, P < .001; PC2: F = 2.11, P = .086).
To compare predictive validity of PC1 and PC2 versus univariate MR imaging measures, we applied univariate nonparametric Spearman rank correlations for prediction of AIS at discharge (Table 4 and Fig 3). Based on Spearman rank correlation, variables of intrinsic cord signal abnormality (lesion length, sagittal grade, BASIC score) and both PC1 and PC2 predicted AIS at discharge. Neither MSCC nor MCC significantly correlated with AIS at discharge. Lesion length (ρ = −0.66), sagittal grade (ρ = −0.70), BASIC score (ρ = −0.85), and PC1 (ρ = −0.69) all negatively correlated with AIS at discharge, whereas PC2 showed a weak positive correlation with AIS at discharge (ρ = 0.22).
Predicting AIS at discharge—Spearman rank correlation and optimal scaling regression results

Multivariate (PCs) and univariate prediction of AIS at discharge. A, PC1 was negatively correlated with AIS at discharge, and PC2 showed a weak positive correlation. B, The length of the lesion, the sagittal grade, and the BASIC score showed a negative correlation with AIS at discharge. Note that because of the ordinal scale of the BASIC score and the sagittal grade, some subjects coincide on the same value. The number of subjects within each sphere is represented by the size of the spheres. Only scatterplots of the statistically significant correlations between the MR imaging measures and AIS at discharge are displayed.
We used optimal-scaled regression to benchmark the predictive validity of MR imaging measures against each other. An advantage of the optimal-scaled regression is that it takes into account different analysis levels (ordinal versus continuous) in a single model. PC scores were not included in this analysis because of multicollinearity. BASIC was the only significant predictor of AIS at discharge (P < .01).
We next benchmarked how individual MR imaging measures perform in predicting AIS at discharge compared with AIS at admission. Not surprisingly, AIS at admission showed a strong positive correlation with AIS at discharge by Spearman rank correlation (ρ = 0.82, P < .01). Optimal-scaling regression revealed that BASIC score and AIS at admission were the only significant predictors of AIS at discharge (both P < .01) (On-line Table 1).
We were concerned that BASIC prediction of AIS at discharge may be confounded by the decision to perform surgical decompression, which could also influence outcome. To test this, we performed 2 additional waves of analysis. First, we tested whether BASIC score significantly predicted the decision to perform surgical decompression by using a generalized linear model. BASIC score significantly predicted surgical decompression decision-making (Wald χ2 = 9.00, P = .003). To test whether this confounded BASIC's predictive validity for AIS at discharge, we reran the generalized linear model with an interaction term, testing whether BASIC and surgical decompression were statistically entangled. This analysis maintained the significant predictive main effect of BASIC on AIS (Wald χ2 = 34.92, P < .001). Furthermore, undergoing decompression surgery was not a significant predictor of AIS at discharge (Wald χ2 = 0.17, P = .68), nor was there a significant interaction between BASIC and decompression surgery (Wald χ2 = 1.58, P = .66). Similarly, we wanted to assess if BASIC significantly predicts AIS at discharge after correcting for MSCC. Using the same analysis tools, the predictive validity of BASIC was maintained (F = 30.69, P < .001), and there was no interaction effect between AIS at discharge and MSCC (F = 0.79, P = .53).
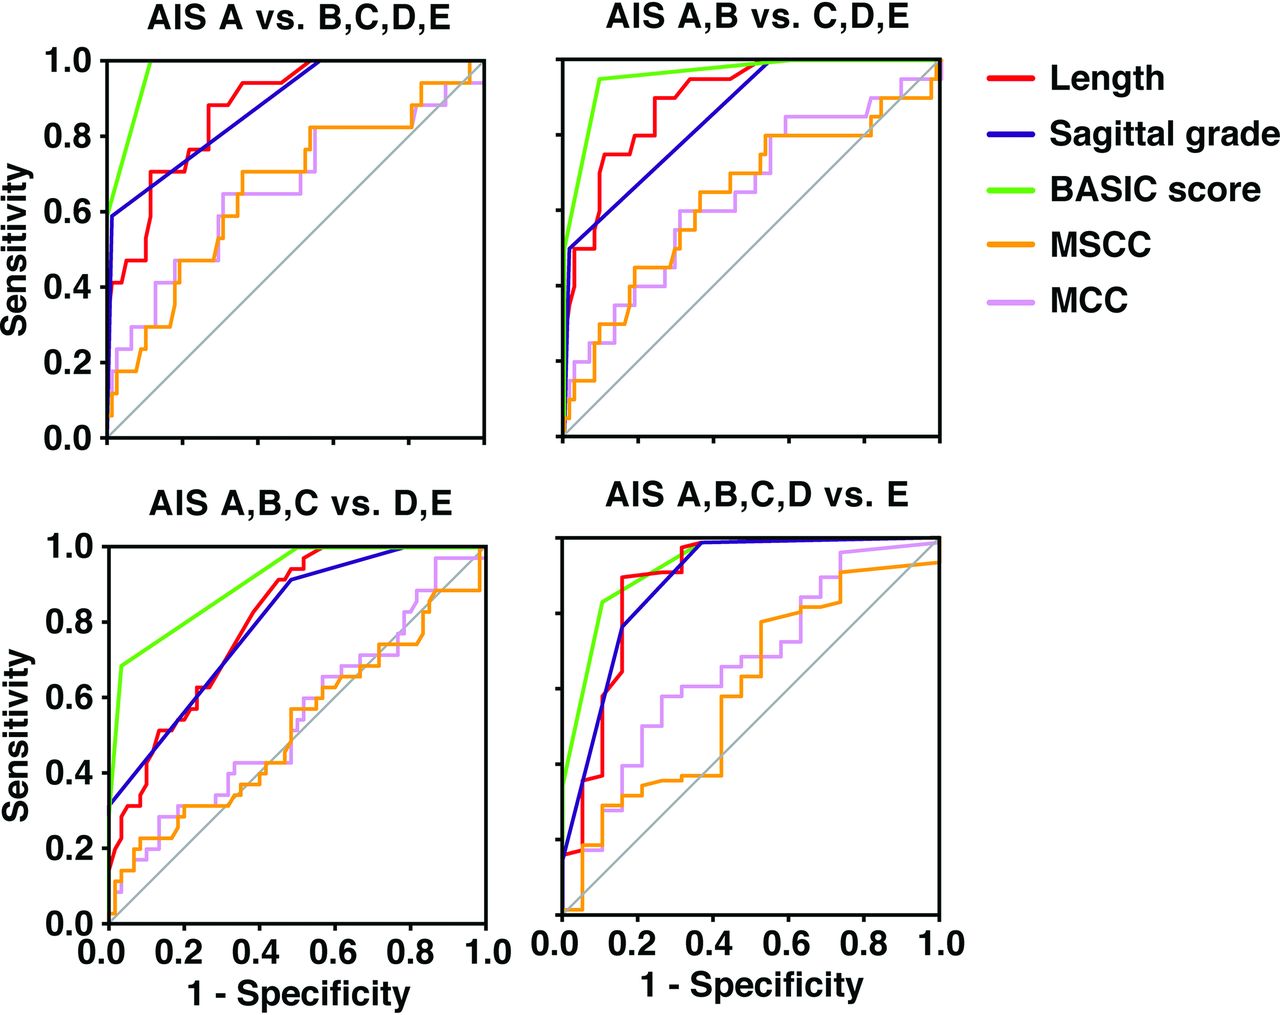
The sensitivity and specificity (receiver operating characteristic and area under the curve) of the MR imaging measures in predicting AIS at discharge are shown in Fig 4 (AIS sliding scale). Supporting previous analysis, the length, sagittal grade, and BASIC score predicted AIS at discharge, with their areas under the curve statistically superior to random guessing (Table 5). BASIC consistently had the highest area under the curve in comparison with the other MR imaging measures. In a supplementary analysis, we tested how well the MR imaging measures can discern adjacent AIS categories. The results are shown in On-line Table 2. Similar to the sliding scale results, BASIC consistently had the highest area under the curve for distinguishing both severe and mild AIS categories in comparison with the other MR imaging measures.

Receiver operating characteristic curves for the different MR imaging measures. The curves show the sensitivity and specificity of the different measures to predict AIS at discharge. AIS at discharge was dichotomized by using a sliding scale, resulting in 4 separate receiver operating characteristic curves (AIS A versus B, C, D, E; AIS A, B versus C, D, E; AIS A, B, C versus D, E; and AIS A, B, C, D versus E). The diagonal gray line represents a reference line that corresponds to random guessing. The further the receiver operating characteristic curves are located to the top left corner, the higher is the sensitivity and specificity of the measure in predicting the dichotomized AIS at discharge.
Receiver operating characteristic analysis results
Finally, to assess discriminative value score subcategories, we applied a linear discriminant function analysis. This supervised pattern detection approach discovers the optimal combination of scores to discriminate the different AIS groups. The full BASIC score had the largest absolute correlation with the canonical discriminant function for AIS, suggesting that the full 5-point BASIC score performs better than truncated scoring schemes (0.962). The full BASIC score outperformed both the simple dichotomous score (lesion versus no lesion, with BASIC 0 = no lesion and BASIC 1–4 = any lesion; 0.388) and a 3-point scale merging BASIC score subcategories 1–3 into 1 category (BASIC 0 = no lesion, BASIC 1–3 = nonhemorrhagic lesion, BASIC 4 = hemorrhagic lesion; 0.639). A second discriminant function analysis included only patients with a BASIC score of 1–3 (ie, those patients with nonhemorrhagic intramedullary T2 signal abnormality) to define the prognostic value of BASIC in this specific subpopulation. BASIC had the largest absolute correlation with the discriminative function (0.991), followed by the length of the lesion (0.416).
Discussion
We applied data-driven multivariate analytic techniques to evaluate how multiple MR imaging–derived metrics relate to each other and to short-term impairment when applied to a group of 95 patients with acute blunt cervical SCI. We identified 2 principal components (PC1 and PC2) that explained 88.6% of the total variance in the dataset. Measures of intrinsic spinal cord signal abnormality had the highest positive loading on PC1, whereas measures of extrinsic cord compression had more modest positive loading. Both the BASIC score and sagittal grade had greater correlation with outcome than PC1, whereas BASIC score was the only univariate MR imaging measure to correlate with outcome when correcting for differences in data measurement scales. The present results support the prognostic relevance of the BASIC score compared with other MR imaging measures of SCI.
Although all imaging variables loaded positively on PC1, PC2 was more discriminatory in nature, segregating structural measures of compression from variables reflecting intrinsic cord signal abnormality. PC2 had a weakly positive correlation with AIS (ρ = 0.22, P = .03), whereas measures of extrinsic compression had no significant correlation with outcome. These findings demonstrate the discriminant validity of NL-PCA and highlight the split between MR imaging measures of intrinsic cord signal abnormality and structural measures of compression.30 Structural measures of compression thus have a complex relationship with outcome. The present data do not necessarily conflict with prior work examining the predictive validity of MSCC in acute SCI.8,15,16,21,22 Miyanji and colleagues8 showed that MSCC was a key predictor of neurologic recovery after traumatic SCI. In that study, outcome for patients with SCI was dichotomized into complete and incomplete categories, whereas we have used the more granular 5-point AIS grading scale. In addition, after correcting for baseline neurologic status, only intrinsic measures of SCI significantly correlated with neurologic recovery, findings consistent with the present results.8
Receiver operating characteristic analysis confirmed that of the imaging variables examined, the BASIC score was the most accurate for predicting short-term impairment. We were concerned that other factors may confound the prognostic validity of the BASIC score. For example, the decision to perform surgical decompression may be influenced by the presence and pattern of signal abnormality in the spinal cord, which could influence outcome.38⇓–40 In addition, the extent of spinal cord compression with associated cord deformation may potentially confound BASIC grading. Our analysis confirms that the predictive validity of the BASIC score was maintained after correcting for potential interactions from surgical decompression and spinal cord compression.
Prior studies suggest MR imaging is most accurate at predicting outcomes when patients have evidence for very mild (normal cord signal) or very severe (intramedullary hemorrhage) injury.1,6,7,10,13,14,20 In contrast, tremendous variability in clinical outcomes has been described in the setting of intermediate degrees of injury.1 To specifically evaluate MR imaging measures and outcomes in this subgroup of patients from our cohort, we applied discriminant function analysis to patients with a BASIC score of 1–3 (patients with nonhemorrhagic intramedullary T2 signal hyperintensity; n = 72). Even in this subpopulation, the BASIC score had a very high absolute correlation with the discriminant function (0.991), followed by the length of the lesion (0.416). Therefore, the prognostic capabilities of the BASIC score are not simply attributable to the ease of prognosis at the ends of the injury severity spectrum.
Limitations of our study primarily relate to the retrospective, single-institution study design. We are actively pursuing this subject further in a prospective fashion with longer clinical follow-up at multiple time points and more detailed outcome measures. Our technique was designed to look at the relationships of the various imaging metrics to each other and to clinical outcome (AIS at discharge). Although we believe that the current study is adequate for investigating these relationships, we realize that there are changes in neurologic impairment expected over a longer time course. In addition, in a future prospective study, more detailed outcome measures need to be included to more comprehensively capture neurologic function.
Conclusions
This study demonstrates the utility of applying NL-PCA for defining the relationship between MR imaging biomarkers in a complex clinical syndrome of cervical SCI. Independent, prospective studies are needed to validate our conclusion that intrinsic measures of spinal cord pathology on acute MR imaging, particularly the BASIC score, best predict neurologic impairment in acute SCI compared with measures of extrinsic compression. This analytic pipeline is suited for future patient-level investigation and is amenable to inclusion of emerging potential biomarkers. Multidimensional approaches may also be useful for future prospective validation of imaging metrics derived from advanced quantitative techniques such as DTI, which are under active investigation for spinal cord pathology.26,41⇓–43
Footnotes
M.C.M. and J.H. contributed equally to this research and to the manuscript and are considered co–first authors.
Disclosures: Jenny Haefeli—RELATED: Grant: Craig H. Neilsen Foundation, Comments: Craig H. Neilsen postdoctoral scholar*; UNRELATED: Grants/Grants Pending: Craig H. Neilsen Foundation, Comments: Craig H. Neilsen postdoctoral scholar. William Whetstone—RELATED: Grant: Department of Defense, Comments: grant 2013–2016.* Sanjay Dhall—UNRELATED: Other: DePuy Spine, Globus Spine, Comments: speaking honoraria. Pavan Upadhyayula—RELATED: Grant: National Institutes of Health.* Jacqueline Bresnahan—RELATED: Grant: Department of Defense*; Support for Travel to Meetings for the Study or Other Purposes: Department of Defense*; UNRELATED: Grants/Grants Pending: National Institutes of Health, Department of Defense, Craig H. Neilsen Foundation.* Michael Beattie—RELATED: Grant: Department of Defense Congressionally Directed Medical Research Programs - Spinal Cord Injury Research Program, Comments: grant SC120259, principal investigator.* Adam Ferguson—RELATED: Grant: National Institutes of Health/National Institute of Neurologic Disorders and Stroke, Wings for Life Foundation, Craig H. Neilsen Foundation, Comments: principal investigator on multiple grants cited in the paper that supported the work*; UNRELATED: Grants/Grants Pending: National Institutes of Health, Department of Defense, Veterans Affairs, Craig H. Neilsen Foundation, Wings for Life Foundation, Comments: principal investigator or co-investigator on many grants unrelated to the reported work.* Jason Talbott—UNRELATED: Other: StemCells, Inc, Comments: member of data monitoring committee for clinical trial which is now ended. *Money paid to the institution.
This work was supported by R01NS067092 (A.R.F.), R01NS088475 (A.R.F.), the Craig H. Neilsen Foundation (A.R.F., J.C.B.), Wings for Life Foundation (A.R.F.), and Department of Defense grant SC120259 (M.S.B., J.C.B.). M.C.M. was supported by a National Institutes of Health T32 Fellowship, 5T32EB001631-10. J.H. was supported by a Craig H. Neilsen Foundation fellowship (313739).
Indicates open access to non-subscribers at www.ajnr.org
References
- Received August 1, 2016.
- Accepted after revision October 4, 2016.
- © 2017 by American Journal of Neuroradiology


Jump to section
Related Articles
Cited By...
- Contrast-enhanced ultrasound for assessing tissue perfusion and predicting functional recovery following acute traumatic spinal injury: translation from rat model to humans
- Convolutional Neural Network-Based Automated Segmentation of the Spinal Cord and Contusion Injury: Deep Learning Biomarker Correlates of Motor Impairment in Acute Spinal Cord Injury