
Abstract
BACKGROUND AND PURPOSE: T1ρ imaging is a new quantitative MR imaging pulse sequence with the potential to discriminate between malignant and benign tissue. In this study, we evaluated the capability of T1ρ imaging to characterize tissue by applying T1ρ imaging to malignant and benign tissue in the nasopharynx and to normal tissue in the head and neck.
MATERIALS AND METHODS: Participants with undifferentiated nasopharyngeal carcinoma and benign hyperplasia of the nasopharynx prospectively underwent T1ρ imaging. T1ρ measurements obtained from the histogram analysis for nasopharyngeal carcinoma in 43 participants were compared with those for benign hyperplasia and for normal tissue (brain, muscle, and parotid glands) in 41 participants using the Mann-Whitney U test. The area under the curve of significant T1ρ measurements was calculated and compared using receiver operating characteristic analysis and the Delong test, respectively. A P < . 05 indicated statistical significance.
RESULTS: There were significant differences in T1ρ measurements between nasopharyngeal carcinoma and benign hyperplasia and between nasopharyngeal carcinoma and normal tissue (all, P < . 05). Compared with benign hyperplasia, nasopharyngeal carcinoma showed a lower T1ρ mean (62.14 versus 65.45 × ms), SD (12.60 versus 17.73 × ms), and skewness (0.61 versus 0.76) (all P < .05), but no difference in kurtosis (P = . 18). The T1ρ SD showed the highest area under the curve of 0.95 compared with the T1ρ mean (area under the curve = 0.72) and T1ρ skewness (area under the curve = 0.72) for discriminating nasopharyngeal carcinoma and benign hyperplasia (all, P < .05).
CONCLUSIONS: Quantitative T1ρ imaging has the potential to discriminate malignant from benign and normal tissue in the head and neck.
ABBREVIATIONS:
- AHP
- adiabatic half passage
- AUC
- area under the curve
- NPC
- nasopharyngeal carcinoma
- rAHP
- reverse adiabatic half passage
- TSL
- time of spin-lock
- PSNR
- peak signal-to-noise ratio
The spin-lattice relaxation time in the rotating frame known as T1ρ is sensitive to biologic processes associated with alterations in the macromolecular content of tissue. Quantitative T1ρ imaging has been used to study normal tissue and nonmalignant diseases in cartilage, discs, and ligaments,1⇓-3 brain,4⇓⇓-7 liver,8,9 heart,10 muscles,11 and parotid glands.11⇓-13 However, T1ρ imaging also has the potential to characterize benign and malignant processes, but only a few studies have preliminarily evaluated T1ρ for human cancer imaging. These studies showed differences of T1ρ values between high- and low-grade gliomas14 and between benign and malignant tissue in the brain,15,16 breast,17 and prostate.18
We are interested in quantitative MR imaging sequences that can be used to discriminate nasopharyngeal carcinoma (NPC) from benign hyperplasia in the nasopharynx because these entities may overlap on anatomic MR imaging sequences.19,20 Our hypothesis is that the T1ρ value of malignancy is different from that of benign tissue and can be used to discriminate these 2 entities. In this preliminary study, we also applied T1ρ imaging to a range of normal tissue in the head and neck (brain, pterygoid muscle, and parotid gland) to compare the T1ρ values of normal tissue with those of NPC.
MATERIALS AND METHODS
Participants
This prospective study was performed with local institutional board approval. Written informed consent was obtained from ethnically Chinese participants who underwent MR imaging between September 2018 and August 2019 in the Prince of Wales Hospital, Hong Kong, SAR.
Participants with NPC had newly diagnosed biopsy-proved undifferentiated carcinoma and a primary tumor of >5 mm. The primary tumor was staged according to the 8th edition of the AJCC Cancer Staging Manual.21 Participants with benign hyperplasia had been referred for MR imaging for suspected NPC because of persistently raised plasma Epstein-Barr virus DNA and benign hyperplasia of >5 mm on MR imaging without evidence of NPC on MR imaging, endoscopic examination, and clinical follow-up at a minimum of 6 months.
MR Imaging Acquisition
MR imaging was performed with an Achieva TX 3T scanner (Philips Healthcare). T1ρ imaging was performed using an adiabatic continuous wave constant amplitude spin-lock approach,22 followed by a single-shot turbo spin-echo acquisition. Fat signal was suppressed using spectral attenuated inversion recovery. The spin-lock radiofrequency pulse cluster consisted of a constant amplitude spin-lock radiofrequency pulse sandwiched by an adiabatic half passage (AHP) and a reverse adiabatic half passage (rAHP). Hyperbolic secant pulses were used as the AHP and rAHP with the B1 amplitude of the AHP and rAHP set equal to that of the spin-lock radiofrequency pulse.22,23 Details of the pulse sequence are reported previously,24 but in summary, the imaging parameters were the following: TR/TE, 2500/15 ms; FOV, 230 × 216 mm; resolution, 1.2 × 1.2 mm; section thickness, 4 mm; number of slices, 9; sensitivity encoding factor, 2; AHP and rAHP duration, 25 ms; maximum amplitude of frequency waveform modulation of the AHP and rAHP, 400 Hz; coefficient factor β for AHP and rAHP, 4; frequency of spin-lock, 400 Hz; and time of spin-lock (TSL), 0, 10, 30, 55, and 90 ms. The total T1ρ imaging scan time was 1 minute 50 seconds.
Anatomic MR imaging consisted of a minimum of the following: 1) an axial fat-suppressed T2-weigthed turbo spin-echo sequence (TR/TE, 4000/80 ms; FOV, 230 × 230 mm; section thickness, 4 mm; echo-train length, 15–17; sensitivity encoding factor, 1; number of signals acquired, 2); and 2) an axial T1-weighted turbo spin-echo sequence (TR/TE, 500/10 ms; FOV, 230 × 230 mm; section thickness, 4 mm; echo-train length, 4; sensitivity encoding factor, 1; number of signals acquired, 2). The patients with NPC were also scanned using a T1-weighted turbo spin-echo sequence following a bolus injection of 0.1 mmol of gadoteric acid (Dotarem; Guerbet) per kilogram of body weight.
Imaging Analysis
T1ρ images were reconstructed at a matrix size of 288 × 288. These images were used for T1ρ quantification using an in-house Matlab (MathWorks) program. The images were smoothed by a sliding 2 × 2 window throughout the image before quantification. At each pixel, the image intensity was fitted to the relaxation model  to calculate the T1ρ value, where A and B are 2 unknown constants. We used a variant of the dichotomy method25 to fit the data to this relaxation model to quantify T1ρ values. For on-resonance spin-lock, the B term is positive. This condition was incorporated into the fitting algorithm to improve fitting accuracy. The peak signal-to-noise ratio (PSNR) was calculated to evaluate the goodness of fit. The definition of PSNR is
 where
where  ,
,  ,
N, and
,
N, and  are the raw data, their mean, their number, and their fitted values, respectively. Criteria were set to exclude pixels with obvious errors or possible unreliable fitting results. A pixel was excluded from final analysis if it had a PSNR of < 30 or an extreme T1ρ value (<15 ms or >200 ms).
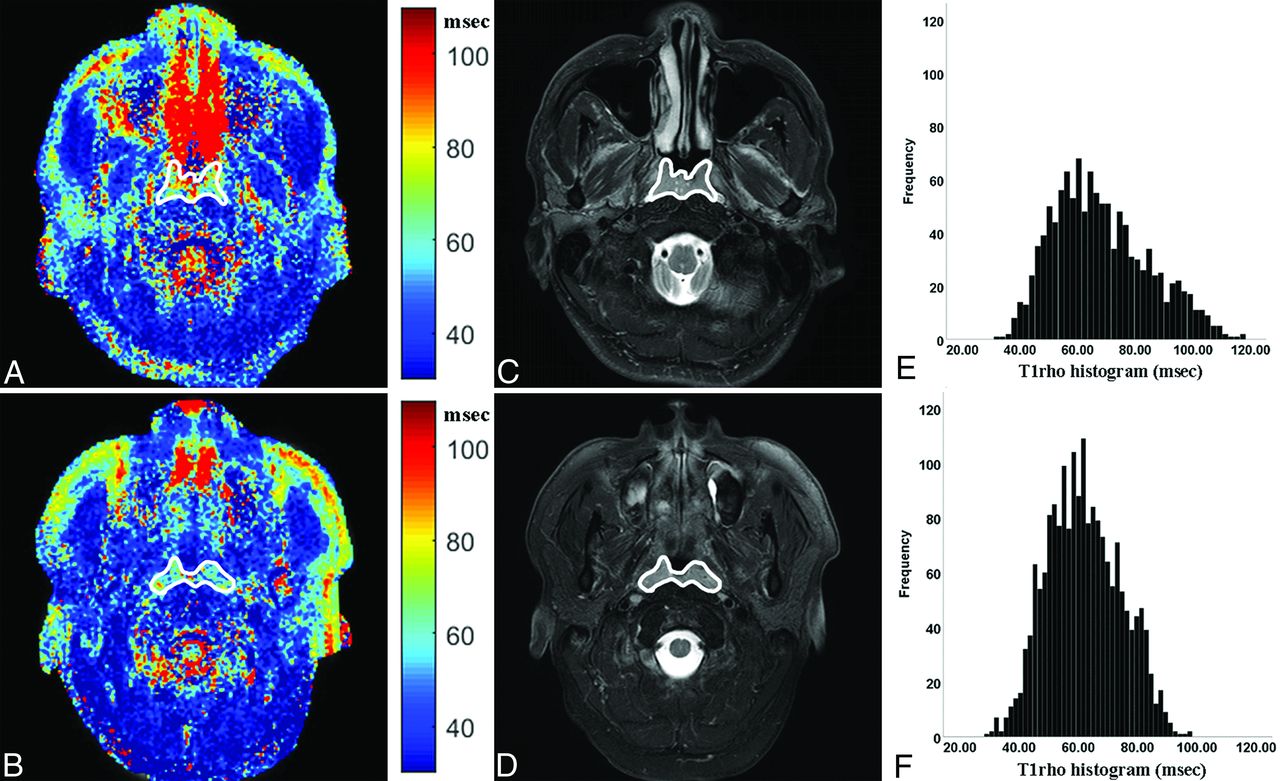
The walls and/or adenoid of benign hyperplasia (Fig 1A) and the primary NPC (Fig 1B) were contoured manually, excluding obvious necrotic, cystic, or hemorrhagic areas, with reference to the corresponding anatomic images (Fig 1C, -D). The normal brain (cerebellum), muscle (lateral pterygoid muscle), and parotid gland were also manually contoured in 41 participants with benign hyperplasia. Contouring was performed by a researcher with 5 years’ experience in MR imaging of NPC and repeated after an interval of 2 weeks (observer 1) and by a diagnostic radiologist with 1-year postfellowship experience in head and neck imaging (observer 2). The mean, SD, skewness, and kurtosis were calculated from the histogram of the T1ρ map (Fig 1E, -F).

The T1rho maps (A and B) and histograms (C and D) of a participant with benign hyperplasia (A and C) and a participant with NPC (B and D), respectively. Compared with participant with benign hyperplasia, the participant with NPC had a lower T1rho mean (70.92 versus 61.96 ms), T1rho SD (16.75 versus 13.30 ms), and T1rho skewness (0.62 versus 0.47).
Statistical Analysis
T1ρ measurements of NPC were compared with those of benign hyperplasia in the nasopharynx and with those of normal tissue using the Mann-Whitney U test. Subgroup analysis was performed to assess the differences in T1ρ measurements between stage T1 NPC and stage T2–4 NPC using the Mann-Whitney U test. Receiver operating characteristic curve analysis and area under the curve (AUC) calculations of statistically significant T1ρ measurements were used to identify the optimal thresholds for discriminating NPC and benign hyperplasia by maximizing the sensitivity plus specificity; the statistically significant of these optimal thresholds was re-evaluated with the χ2 test. The sensitivity, specificity, positive predictive value, negative predictive value, and accuracy of the optimal thresholds were calculated, and the AUCs were compared using the Delong test.26 Differences in the T1ρ measurements of normal brain and muscle and the parotid gland were compared using the analysis of variance test, and for statistically significant differences, the Fisher least significant difference test was then used for post hoc multiple comparisons. These analyses used the average values of the measurements obtained from the 2 observers.
Intraclass correlation coefficients with 95% confidence intervals were calculated to assess the intra- and interobserver agreement for T1ρ measurements. Intraclass correlation coefficients of ≤0.20, 0.21–0.40, 0.41–0.60, 0.61–0.80, and 0.81–1.00 indicated slight, fair, moderate, substantial, and almost perfect agreement, respectively.27 All of the statistical tests were 2-sided, and a P value < .05 was considered a statistically significant difference. Analyses were performed using MedCalc statistical software (Version 14.8.1; MedCalc Software) and SPSS (Version 25.0; IBM).
RESULTS
Participants
Forty-three participants with NPC and 41 participants with benign hyperplasia were recruited for analysis. The characteristics of each group are shown in Table 1. NPCs were staged to T1, T2, T3, and T4 in 14, 12, 12, and 5 participants, respectively. Participants with benign hyperplasia showed no evidence of NPC at follow-up (median, 15.0 months; range, 7.5–19.4 months).
Characteristics of 43 participants with NPC and 41 participants with benign hyperplasia in the nasopharynx
T1ρ Imaging in Normal Tissue, NPC, and Benign Hyperplasia in the Head and Neck
T1ρ measurements of NPC, benign hyperplasia, and normal tissue (brain, muscle, and parotid gland) are shown in On-line Table 1. Compared with benign hyperplasia, the T1ρ mean, SD, and skewness of NPC were lower (all, P < . 01) (On-line Table 1 and Fig 2A–C), but there was no difference in kurtosis (P = . 18) (On-line Table 1 and Fig 2D). T1ρ maps with the contours and histograms of a participant with benign hyperplasia and NPC are shown in Fig 1. There were no differences in T1ρ mean, SD, skewness, and kurtosis between stage T1 and T2–T4 NPCs (all, P > . 05) (Table 2). Compared with normal tissue, the T1ρ means of NPC were lower than those of brain and higher than those of muscle and the parotid gland (all, P < . 001), and the T1ρ SD of NPC was higher than all 3 normal tissues (all P < . 001) (On-line Table 1). For the normal tissues, differences in T1ρ measurements between any of the 2 normal tissues were statistically significant (all, P < . 05).

Boxplots of the T1rho mean (A), T1rho SD (B), T1rho skewness (C), and T1rho kurtosis (D) in participants with benign hyperplasia and NPC. Boundaries of boxes closest to and furthest from 0 ms indicate the 25th and 75th percentiles, respectively. The line within each box indicates median values. Error bars indicate the smallest and largest values within 1.5 box lengths of the 25th and 75th percentiles. Individual points indicate outliers. Compared with participants with benign hyperplasia, participants with NPC had a lower T1rho mean (A), T1rho SD (B), and T1rho skewness (C) (all, P < . 01). There were no differences between the 2 groups for T1rho kurtosis (D) (P = . 18).
T1ρ measurements in stage T1 and T2–4 NPCa
The intra- and interobserver agreement for T1ρ measurements is shown in On-line Table 2. The highest intra- and interobserver agreement was found for the T1ρ mean (intraclass correlation coefficients = 0.99 and 0.99, respectively) and for the T1ρ SD (intraclass correlation coefficients = 0.98 and 0.96, respectively).
Diagnostic Performance of T1ρ Measurements for Discriminating NPC and Benign Hyperplasia
The AUC, optimal threshold, and diagnostic performance of statistically significant T1ρ measurements for discriminating between NPC and benign hyperplasia are shown in Table 3. The T1ρ SD showed the highest AUC of 0.95 compared with the T1ρ mean (AUC = 0.72) and T1ρ skewness (AUC = 0.72) (all, P < . 001, Table 3 and Fig 3). The T1ρ SD of ≤14.50 ms achieves a sensitivity of 88.4%, specificity of 95.1%, positive predictive value of 95.0%, negative predictive value of 88.6%, and accuracy of 91.7% for discriminating NPC from benign hyperplasia.

The receiver operating characteristic curves of T1rho mean (blue curve), T1rho SD (red curve), and T1rho skewness (green curve) for discriminating NPC and benign hyperplasia in the nasopharynx. The T1rho SD showed the highest AUC of 0.95 compared with the T1rho mean (AUC = 0.72) and T1rho skewness (AUC = 0.72) (P < . 05) for distinguishing NPC from benign hyperplasia.
Diagnostic performance of T1ρ imaging for detecting malignancy of NPC from nasopharyngeal benign hyperplasiaa
DISCUSSION
In this preliminary study, we evaluated the capability of this new quantitative T1ρ MR imaging sequence for head and neck cancer imaging to discriminate malignant tissue, specifically NPC from benign tissue in the nasopharynx and from surrounding normal tissue. In keeping with a previous study published in 1998,11 the T1ρ mean varied between different normal tissues, being higher in brain, followed by in the parotid gland and muscle. Compared with these normal tissues, the T1ρ mean of NPC was lower than that of the brain but higher than that of the parotid gland and muscle. Moreover, the T1ρ mean of NPC was statistically significantly lower than that of the benign hyperplasia. Factors in the head and neck that influence T1ρ values are unclear, but previous phantom and in vivo musculoskeletal studies have reported that the T1ρ value is negatively associated with the macromolecule content and positively associated with water content.28⇓-30 Therefore, the overexpression of macromolecular proteins could be contributing to the low T1ρ mean values in NPC, while higher water content in the inflammation could be contributing to the high mean T1ρ values in benign hyperplasia.
We further analyzed measurements other than the T1ρ mean from the T1ρ histogram and found that T1ρ SD and skewness were lower in NPC than in benign hyperplasia, with low values indicating NPC but higher values being unable to discriminate these 2 entities. Of all these measurements, the SD achieved the highest AUC. The lower T1ρ SD in NPC compared with benign hyperplasia suggests that this cancer is less heterogeneous than inflammation. The use of the optimal T1ρ SD showed a high positive predictive value, suggesting that the potential role of T1ρ imaging could be to minimize false-positive findings and hence reduce the number of patients referred unnecessarily for further examinations. The intraclass correlation coefficients were high for all T1ρ measurements with the exception of kurtosis, which had a low intraclass correlation coefficient and was the only T1ρ measurement that did not show a difference between the 2 groups.
A potential future role for T1ρ imaging in the nasopharynx is for MR imaging screening of NPC. MR imaging detects 10%–17% more NPCs than an endoscopic examination,31⇓-33 but discrimination of early-stage NPCs is confined to the nasopharynx (stage T1), and benign hyperplasia can be problematic on anatomic-based MR imaging sequences when the cancer involves both sides of the nasopharynx symmetrically.19,20,34 The results of the current study are encouraging because we found differences in T1ρ measurements between NPC and benign hyperplasia. Furthermore, there were no differences in the T1ρ values of stage T1 and T2–4 NPCs, so it is probable that these results could be applied to a screening population with early-stage disease. However, future studies are needed to validate the findings, evaluate optimal thresholds, and determine whether T1ρ imaging can improve on the diagnostic performance of anatomic MR imaging sequences in NPC detection.
One advantage of using T1ρ imaging in MR imaging screening is that it does not require extra hardware or an intravenous injection of contrast. These advantages also apply to diffusion-weighted imaging, which is another functional MR imaging sequence that has shown promise in the discrimination of malignant and benign tissue in the head and neck.35⇓-37 However, susceptibility artifacts can limit the application of diffusion-weighted imaging.35 This image distortion can be mitigated by a fast spin-echo acquisition, but this results in significant loss of signal-to-noise-ratio efficiency compared with an echo-planar imaging acquisition, often leading to a longer scan time. On the other hand, there is less image distortion from B0 field inhomogeneities in T1ρ imaging. This is achieved using an adiabatic continuous wave constant amplitude spin-lock to ensure that all spins are well-locked along the effective spin-lock field, even in the presence of B1 radiofrequency and B0 field inhomogeneities.22,23
This study had several limitations. First, it did not correlate T1ρ imaging with biologic characteristics, so the underlying biologic factors contributing to the T1ρ values in the head and neck remain unclear. Second, most participants with NPC referred to MR imaging for staging had already undergone a nasopharyngeal biopsy. This scenario is unavoidable, but to minimize the potential influence of a biopsy on the T1ρ measurement, any foci of hemorrhage were excluded when contouring the primary tumor. Third, while obvious cysts can be excluded from the contoured region, very small cysts of 1–2 mm, which are more commonly seen in benign hyperplasia, cannot be excluded from the analysis. Fourth, this study did not analyze the reproducibility of T1ρ imaging in the head and neck, but previous studies have reported high reproducibility of T1ρ imaging in other tissue.38,39 Furthermore, with an adiabatic continuous wave constant amplitude spin-lock, the spins are locked at a tilted angle from the transverse plane during the spin-lock, which results in T1 contamination of the T1ρ measurements.23 The level of T1 contamination depends on the B0 field inhomogeneities and the B1 amplitude of the spin-lock radiofrequency pulse or the frequency of the spin-lock. In our previous study,23 we reported that the maximum error of T1ρ quantification due to this effect is within 4% at a frequency of spin-lock of 500 Hz and a maximum B0 field inhomogeneity of 100 Hz, but the maximum error at this site is unknown.
CONCLUSIONS
There are quantitative differences in the T1ρ measurements of normal, malignant, and benign tissue in the head and neck. T1ρ imaging, therefore, has the potential to be used to identify malignant tumors. This is a new area for cancer research, and further studies are needed to validate these findings.
Footnotes
Disclosures: Weitian Chen—UNRELATED: Employment: The Chinese University of Hong Kong; Grants/Grants Pending: The Chinese University of Hong Kong*; Patents (Planned, Pending or Issued): a pending US patent and a pending Chinese patient, W. Chen and B. Jiang; System and Method for Continuous Wave Constant Amplitude On-Resonance and Off-resonance Spin-Lock for Magnetic Resonance Imaging, US 15/663,254, US patent, pending; CN 201710649663.X, pending, Comments: no money received.; OTHER RELATIONSHIPS: I am a shareholder of the company lluminatio Medical Technology limited. Wai Kei Jacky Lam—UNRELATED: Patents (Planned, Pending or Issued): patent on clinical applications of circulating DNA*; Stock/Stock Options: Grail. Queenie Chan—UNRELATED: Employment: Queenie Chan is an employee of Philips Healthcare, but she had no control over inclusion of any data or information that might have presented a conflict of interest. There are no actual or potential conflicts of interest to declare in relation to this article. Edwin P. Hui—UNRELATED: Consultancy: Merck Sharp & Dohme, Comments: Advisory Board; Payment for Lectures Including Service on Speakers Bureaus: Merck Sharp & Dohme, Merck Serono, Comments: speakers honoraria. K.C. Allen Chan—RELATED: Consulting Fee or Honorarium: Grail; UNRELATED: Board Membership: Take2, DRA; Consultancy: Grail; Grants/Grants Pending: Grail, Cirina*; Patents (Planned, Pending or Issued): I am an inventor of over 70 patents; parts of the portfolio have been licensed to Illumina, Grail, Xcelom, DRA; Royalties: Grail, Sequenom, Illumina, Take2, Xcelom; Stock/Stock Options: Grail, DRA, Take2; Travel/Accommodations/Meeting Expenses Unrelated to Activities Listed: Bio-Rad Laboratories. *Money paid to the institution.
Paper previously presented, in part, at: European Society Head and Neck Society Refresh, October 3–5, 2019; Sicily, Italy.
References
- Received January 16, 2020.
- Accepted after revision August 7, 2020.
- © 2020 by American Journal of Neuroradiology


Jump to section
Related Articles
Cited By...
- No citing articles found.