
Abstract
BACKGROUND AND PURPOSE: Nigrostriatal dopaminergic function in patients with Parkinson disease can be assessed using 123I-2β-carbomethoxy-3β-(4-iodophenyl)-N-(3-fluoropropyl)-nortropan dopamine transporter (123I-FP-CIT) SPECT, and a good correlation has been demonstrated between nigral status on SWI and dopaminergic denervation on 123I-FP-CIT SPECT. Here, we aim to correlate quantified dopamine transporter attenuation on 123I-FP-CIT SPECT with nigrosome-1 status using susceptibility map-weighted imaging (SMWI).
MATERIALS AND METHODS: Between May 2017 and January 2018, consecutive patients with idiopathic Parkinson disease (n = 109) and control participants (n = 29) who underwent 123I-FP-CIT SPECT with concurrent 3T SWI were included. SMWI was generated from SWI. Two neuroradiologists evaluated nigral hyperintensity from nigrosome-1 on each side of the substantia nigra. Using consensus reading, we compared the 123I-FP-CIT–specific binding ratio according to nigral hyperintensity status and the 123I-FP-CIT specific binding ratio threshold to confirm the loss of nigral hyperintensity was determined using receiver operating characteristic curve analysis.
RESULTS: The concordance rate between SMWI and 123I-FP-CIT SPECT was 65.9%. The 123I-FP-CIT–specific binding ratios in the striatum, caudate nucleus, and putamen were significantly lower when nigral hyperintensity in the ipsilateral substantia nigra was absent than when present (all, P < .001). The 123I-FP-CIT–specific binding ratio threshold values for the determination of nigral hyperintensity loss were 2.56 in the striatum (area under the curve, 0.890), 3.07 in the caudate nucleus (0.830), and 2.36 in the putamen (0.887).
CONCLUSIONS: Nigral hyperintensity on SMWI showed high positive predictive value and low negative predictive value with dopaminergic degeneration on 123I-FP-CIT SPECT. In patients with Parkinson disease, the loss of nigral hyperintensity is prominent in patients with lower striatal specific binding ratios.
ABBREVIATIONS:
- PD
- Parkinson disease
- SBR
- specific binding ratio
- SMWI
- susceptibility map-weighted imaging
- SN
- substantia nigra
- 123I-FP-CIT
- 123I-2[β]-carbomethoxy-3[β]-(4-iodophenyl)-N-(3-fluoropropyl)-nortropan dopamine transporter
- MMSE
- Mini-Mental State Examination
- MoCA
- Montreal Cognitive Asses
- UPDRS
- Unified Parkinson’s Disease Rating Scale
- ROC
- receiver operating characteristic
- AUC
- area under the curve
The second most common neurodegenerative disorder,1,2 Parkinson disease (PD) is characterized by dopaminergic cell loss within the substantia nigra (SN) of the midbrain that reportedly progresses from structures called nigrosomes,1 beginning with the largest subdivision of nigrosome-1.3,4 The presence of nigrosome-1 can be assessed using high-resolution MR imaging, and its absence can serve as a powerful diagnostic tool for PD.5⇓⇓⇓⇓⇓⇓⇓-13
The standardized assessment of nigrostriatal dopaminergic function in patients with PD has been performed using SPECT, including 123I-2β-carbomethoxy-3β-(4-iodophenyl)-N-(3-fluoropropyl)-nortropane (123I-FP-CIT) SPECT as its more common variation.14⇓-16 Although research has demonstrated a good correlation between nigral status determined with SWI and the status of dopaminergic denervation revealed with 123I-FP-CIT SPECT,5,7 the 2 methods lack absolute agreement. In addition, denervation can reportedly be observed on 123I-FP-CIT SPECT, but nigral hyperintensity is maintained on MR imaging,5,7 possibly informing a false-negative diagnosis of PD. To the best of our knowledge, no study has evaluated the relationship between the degree of dopaminergic denervation on 123I-FP-CIT SPECT and the status of nigral hyperintensity on SWI.
The present study aims to determine the degree of the dopaminergic denervation on 123I-FP-CIT SPECT according to the presence or loss of nigral hyperintensity on 3T MR imaging in patients with PD. We evaluated the striatal specific binding ratios (SBRs) of the 123I-FP-CIT and used susceptibility map-weighted imaging (SMWI) to enhance the visibility of nigrosome-1.17,18 The purpose of this study was to correlate quantified dopamine transporter attenuation on SPECT with the status of nigral hyperintensity on MR imaging.
MATERIALS AND METHODS
This study was approved by the institutional review board of our institution (institutional review board no. B-1610–368-303). Informed consent was obtained from all study participants.
Patients and Clinical Assessment
Consecutive patients who visited our hospital with suspected parkinsonism were enrolled between May 2017 and January 2018. All patients were evaluated by a neurologist (J.-M.K.) with 17 years of experience in diagnosing and treating patients with movement disorders, and the patients who were clinically diagnosed with de novo idiopathic PD were included in this study. Clinical diagnoses of idiopathic PD were made in accordance with UK Parkinson’s Disease Society Brain Bank clinical diagnostic criteria, including bradykinesia and at least 1 of muscular rigidity, resting tremor and postural instability, and clinical findings.19 The exclusion and the supporting criteria were also followed.19 Cognition was assessed with the Mini-Mental State Examination (MMSE)20 and the Montreal Cognitive Assessment (MoCA),21 and motor functioning was assessed with the Unified Parkinson’s Disease Rating Scale-III (UPDRS-III) scores22 and Hoehn and Yahr scales.23 All patients underwent both 123I-FP-CIT SPECT and 3T SWI within a maximum period of 3 months. The clinical diagnosis of PD was consolidated by the results of the 123I-FP-CIT SPECT, 3T MR imaging, and follow-up. Patients were excluded if they were diagnosed with atypical parkinsonism including multiple system atrophy or progressive supranuclear palsy, normal-pressure hydro-cephalus, or idiopathic REM sleep behavior disorder or if more than 3 months elapsed between the 123I-FP-CIT SPECT and SWI. Particularly, the patients who were compatible with idiopathic REM sleep behavior disorder according to the corresponding diagnostic criteria24 and polysomnographic examination were excluded. The patients whose SWI was unsuitable for the reconstruction of SMWI because of severe motion artifact were excluded as well. Last, the patients who demonstrated any ischemic lesions on the striatum and occipital cortex on MR imaging were excluded to avoid false-positive result from 123I-FP-CIT SPECT. During the study period, the participants who did undergo neurologic examination, 123I-FP-CIT SPECT, and 3T SWI with suspicion of parkinsonism but who were not diagnosed with idiopathic PD after work-up were enrolled as a control group. The control group was composed of the participants who were diagnosed with frontal gait disorder, essential tremor, and drug-induced parkinsonism. Clinical diagnoses of respective diseases were made according to the established diagnostic criteria25⇓-27 and the results of 123I-FP-CIT SPECT visual inspection. The patients who were suspected to have idiopathic REM sleep behavior disorder24 and the patients who demonstrated striatal or occipital cortical ischemic lesions on MR imaging were excluded from the study.
123I-FP-CIT SPECT
Patients were orally administered 6 mL of Lugol solution before receiving the 123I-FP-CIT injection. Scans were acquired 3 hours after the IV injection of 185 MBq of 123I-FP-CIT (DATrace-123M, Samyoung Unitech). Scans were performed with a triple-headed rotating gamma camera system (Trionix XLT, Trionix Research Laboratory) with low-energy, ultra-resolution, parallel hole collimators. Scans were in 40 steps spanning 120°, with 40 seconds per step, via the step-and-shoot method. Image reconstruction was performed by filtered back-projection with a Butterworth filter (cutoff frequency 0.4 cycle/cm; order, 13), and attenuation correction with the Chang method (coefficient of 0.12/cm). A nuclear medicine physician (Y.S.S.) with 15 years of experience visually interpreted the 123I-FP-CIT SPECT results. The reader was blinded to the clinical information and the MR imaging finding at the time of the interpretation. The interpretation of SPECT results for the diagnosis was done by visual inspection. For the quantification analysis, images were analyzed with a dedicated software program (DATquant with the software package Xeleris 3.1, GE Healthcare). VOIs were defined automatically with DATquant over the striatum (caudate nucleus and putamen), caudate nucleus, putamen, and occipital cortex. The SBRs of the striatal regions were calculated as follows: (mean counts in striatal regions – mean counts in the occipital cortex)/(mean counts in the occipital cortex).
SWI Protocol and SMWI Processing
SWI was obtained using a 3T MR imaging scanner (Ingenia, Philips) with a 32-channel SENSE head coil (Philips Healthcare). To observe the nigrosome-1 structure, the imaging plane was oriented perpendicular to the midbrain structure. All SWI procedures were conducted using a 3D multiecho fast-field-echo sequence with the following parameters: TR, 88 msec; total 5 echoes; first TE, 10 msec; echo interval, 10 msec; flip angle, 10°; FOV, 192 × 192 mm2; voxel size, 0.5 × 0.5 × 1 mm2.
After SWI acquisition, SMWI was generated from the SWI protocol by combining the magnitude images and quantitative susceptibility mapping mask images to enhance the visibility of nigrosome-1.17,18 The reconstruction of SMWI was performed following a previously reported protocol.17
SMWI Analysis
Blinded to the clinical diagnosis and 123I-FP-CIT SPECT findings, 2 neuroradiologists (Y.J.B. and B.S.C., with 10 and 20 years of experience, respectively) independently evaluated the status of the bilateral striatal nigral hyperintensity on the generated SMWI. The normal nigral hyperintensity was defined as a focal oval or linear hyperintense area in the dorsolateral aspect of the SN surrounded by hypointensity.5,6,10⇓-12,17,28 The right and left sides were read separately in each participant. After completing 2 independent readings, all discrepancies between the 2 raters were resolved by consensus.
Statistical Analysis
Demographic data and clinical scores were compared using the Fisher exact test, chi-square test, Student t test, and Kruskal-Wallis test. Interobserver agreement concerning the nigral hyperintensity on SMWI was tested using the Cohen κ, with κ > 0.75, excellent agreement; κ = 0.40–0.75, fair to good agreement; and κ < 0.40, poor agreement.29 The diagnostic performance of SMWI was calculated presuming that the loss of unilateral or bilateral nigral hyperintensity on SMWI indicated PD. The 123I-FP-CIT SBRs were compared according to clinical diagnosis using the Student t test. The concordance rate between SMWI and 123I-FP-CIT SPECT was then calculated, and the McNemar test was performed. The 123I-FP-CIT SBR was compared according to the status of nigral hyperintensity in a region-based approach using the Student t test. Particularly in patients with PD, the clinical scores and the averaged bilateral 123I-FP-CIT SBR were compared between those who showed intact bilateral nigral hyperintensities and those who did not on a per-patient basis as well. Last, the efficacy of using a threshold of the 123I-FP-CIT SBR to determine the loss of nigral hyperintensity was evaluated using a receiver operating characteristic (ROC) curve analysis. P values < .05 were considered to indicate significant differences. All statistical analyses were performed using SPSS v. 25.0 (IBM) and MedCalc 17.9 (MedCalc).
RESULTS
Clinical Characteristics
A total of 138 patients (82 women and 56 men; mean age, 68.4 ± 9.2 years; age range, 42–87 years), including 109 patients with PD and 29 control participants (frontal gait disorder, n = 14; essential tremor, n = 12; drug-induced parkinsonism, n = 3), were included in this study. The demographic findings and clinical characteristics are summarized in Table 1.
Clinical characteristics
Nigral Hyperintensity on SMWI and 123I-FP-CIT SBR on SPECT According to Clinical Diagnosis
Interobserver agreement on the status of nigral hyperintensity between the 2 readers was excellent for both the right (κ = 0.91; 95% CI, 0.846–0.981; agreement rate, 95.7%) and left sides (κ = 0.97; 95% CI, 0.931–1.000; agreement rate, 98.6%). According to the results from the consensus reading (Table 2), the use of unilateral or bilateral loss of the nigral hyperintensity on SMWI to diagnose PD achieved a sensitivity of 67.0%, specificity of 89.7%, positive predictive value of 96.1%, negative predictive value of 41.9%, and accuracy of 71.7%. The results of visual inspection and 123I-FP-CIT SBR analyzed according to the clinical diagnosis are present in Table 3.
Nigral hyperintensity on SMWI according to clinical diagnosis
123I-FP-CIT SBR according to clinical diagnosis
Correlation Between Nigral Hyperintensity on SMWI and 123I-FP-CIT SBR on SPECT
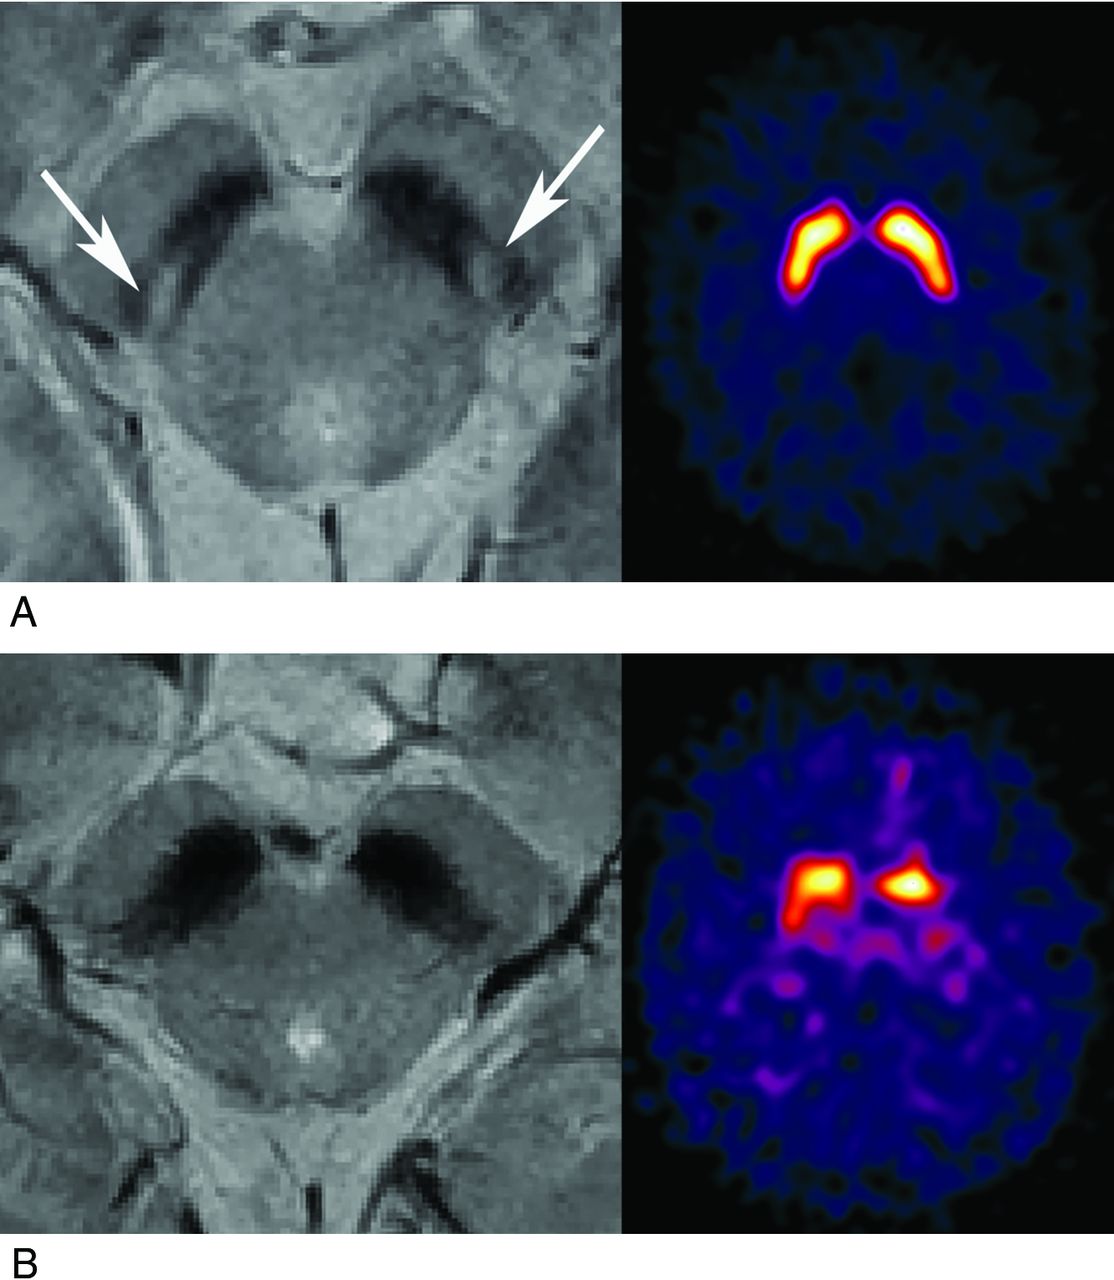
The status of nigral hyperintensity on SMWI and the result of visual inspection from 123I-FP-CIT SPECT are presented in Table 4. When we matched the loss of nigral hyperintensity on SMWI with abnormal findings on 123I-FP-CIT SPECT, the concordance rate was 65.2% and 66.7% for the right and left sides of the nigrostriatal tract, respectively. The overall concordance rate was 65.9% (Fig 1).

SMWI and accordant 123I-FP-CIT SPECT findings. A, SMWI of a 56-year-old female control participant with intact bilateral striatal nigral hyperintensity (white arrow). The specific binding ratio values were 4.93 (right) and 5.01 (left) on 123I-FP-CIT SPECT. B, SMWI of a 65-year-old male patient with PD and loss of bilateral striatal nigral hyperintensity. The SBR values were 1.25 (right) and 1.10 (left) on 123I-FP-CIT SPECT.
Nigral status on SMWI and visual inspection result on 123I-FP-CIT SPECT
In a region-based comparison, the 123I-FP-CIT SBRs measured in each right and left striatum, caudate nucleus, and putamen were significantly lower when the nigral hyperintensity in the SN on the same side was lost than when present (Table 5). On a per-patient basis, the averaged 123I-FP-CIT SBRs in bilateral striatum, putamen, and caudate were all significantly lower in patients with PD those who presented unilateral or bilateral loss of nigral hyperintensity than those who presented bilateral intact nigral hyperintensity (Table 5). However, the clinical scores including MMSE (27.5 ± 7.34; 25.3 ± 2.66, P = .079), MoCA (23.06 ± 5.13; 22.47 ± 6.04, P = .642), UPDRS-III scores (18.37 ± 9.63; 16.20 ± 8.06, P = .251), and Hoehn and Yahr scale (2.02 ± 0.64; 2.02 ± 0.63, P = .971) did not differ significantly between both groups.
123I-FP-CIT SBRs according to the nigral hyperintensity status on SMWI
The ROC curve analysis revealed optimal threshold values of the 123I-FP-CIT SBR for the determination of the loss of nigral hyperintensity on SMWI to be 2.56 in the striatum (area under the curve [AUC], 0.890; 95% CI, 0.847–0.924; P < .001; sensitivity, 85.1%; specificity, 80.2%), 3.07 in the caudate nucleus (AUC, 0.830; 95% CI, 0.780 – 0.872; P < . 001; sensitivity, 69.4%; specificity, 78.8%), and 2.36 in the putamen (AUC, 0.887; 95% CI, 0.843–0.922; P < . 001; sensitivity, 90.3%; specificity, 73.9%) (Fig 2).

ROC curves for determining the loss of nigral hyperintensity on SMWI using the 123I-FP-CIT SBRs. ROC curves used for determining the loss of nigral hyperintensity with 123I-FP-CIT SBRs measured in the striatum (red), putamen (green), and caudate nucleus (blue) are shown. The detailed data are presented in the Results section.
DISCUSSION
The present study performed a correlation analysis between the SBR values of 123I-FP-CIT SPECT and the presence of nigral hyperintensity. We have previously shown that the loss of nigral hyperintensity corresponds to dopaminergic denervation as-sessed with 123I-FP-CIT SPECT image findings.5 In the current study, we have carefully included patients diagnosed with de novo PD and control participants according to the dedicated clinical criteria with an aid from MR imaging and 123I-FP-CIT SPECT. We also only included patients who did not take any medication that might affect the 123I-FP-CIT SPECT findings, and we excluded patients who demonstrated pathologic findings such as ischemia in the striatum and occipital cortex on MR imaging to prevent possible false-positive SPECT findings. Thereby, we aimed to avoid possible confounders and to provide solid results for the determination of the 123I-FP-CIT uptake level on the basis of the nigral status on MR imaging.
Presynaptic dopaminergic scans are considered more sensitive diagnostic indicators of PD than clinical examination.30⇓-32 We observed decreased 123I-FP-CIT uptake in all the striatal regions of patients with PD and the loss of nigral hyperintensity on SMWI in 67% of patients. Moreover, our previous study of patients with idiopathic REM sleep behavior disorder showed that 61% exhibited the loss of nigral hyperintensity, which is a lower prevalence than among patients with PD.28 Considering the fact that a substantial portion of patients with idiopathic REM sleep behavior disorder develop PD and >50% of the whole dopaminergic neurons are already lost during the prodromal stage of PD,33⇓-35 the decrease of striatal FP-CIT binding might precede the loss of nigral hyperintensity in a sequential process, which is an important implication of our present study because it suggests that the diagnosis of PD based only on the status of nigrosome-1 on MR imaging may result in a false-negative result.
Indeed, our result demonstrated that loss of nigral hyperintensity can strongly support the diagnosis of PD from its high positive predictive value, but intact nigral hyperintensity may not exclude PD because the negative predictive value was low. Therefore, we can suggest that further diagnostic procedures such as 123I-FP-CIT SPECT might not be necessary in patients with the loss of nigral hyperintensity. On the contrary, normal nigral hyperintensity cannot rule out the diagnosis of PD, which may necessitate the further 123I-FP-CIT SPECT evaluation for the concrete diagnosis. Thus, the assessment of nigral hyperintensity on SMWI could assist the diagnostic process of PD on a routine clinical basis.
In this regard, the determination of the quantified 123I-FP-CIT uptake level on the basis of the nigral status on MR imaging can have an important clinical impact. Especially in the present study, we used SMWI to enhance the visibility of nigrosome-1 and to improve the detectability of the nigral hyperintensity. SMWI is a postgenerated image from conventional multiecho SWI. Specifically, a reconstruction algorithm generates a high susceptibility contrast between nigrosome-1 and the neighboring SN structures.17,18 Because it incorporates the information related to the iron overload in the SN by quantitative susceptibility mapping, SMWI significantly improves the detectability of nigral hyperintensity relative to the use of SWI alone and may thus increase the diagnostic accuracy for PD.17
Based on SMWI, we suggest threshold 123I-FP-CIT SBRs of 2.56, 3.07, and 2.36 for determining the loss of nigral hyperintensity in the striatum, caudate nucleus, and putamen, respectively, with high diagnostic performance. The high threshold of the caudate nucleus relative to that of the putamen reflects the anteroposterior gradient of 123I-FP-CIT binding in patients with PD.36 However, the presently observed overlap between SBR values in the intact and the nonintact nigral hyperintensity groups suggests the presence of greater unexplainable causes of nigral hyperintensity loss during the progression of PD. Because the loss of nigral hyperintensity reflects the accumulation of iron in the SN, which is regulated by various genetic predispositions and environmental factors,37 the lack of a direct correlation between iron accumulation and dopaminergic denervation may be 1 such cause.6,9
Among the control participants, 3 of 29 participants, who were diagnosed with frontal gait disorder (n = 1) and essential tremor (n = 2), showed loss of nigral hyperintensity in 5 regions of the SN (2, bilateral loss; 1, unilateral loss). The mean putaminal SBRs of the 5 corresponding regions with loss of nigral hyperintensity were 1.6 ± 0.24, which were reduced to the level comparable to the patients with PD met in routine clinical practice (data not shown). Thus, we can speculate that the striatal SBRs on the same side of the SN that shows loss of nigral hyperintensity may be reduced compared with the normal side. We can also presume that the initial visual assessment of 123I-FP-CIT SPECT of these patients was concluded as normal based on the bilateral symmetric 123I-FP-CIT uptakes without anteroposterior gradients. These 3 participants still do not present parkinsonian features compatible with the clinical diagnostic criteria for PD during follow-up. Therefore, the interpretation of 123I-FP-CIT SPECT should be cautiously performed while taking account of relevant practical issues for both visual assessment and quantitative analysis.38
When defining a false-positive result as the absence of nigral hyperintensity on 3T SMWI on either side but with normal 123I-FP-CIT findings, the false-positive rate was lower than that of diagnoses informed by SWI findings in a previous study.5 To date, it remains unclear whether iron accumulation is a primary initiating or secondary event of dopaminergic denervation.39 However, because iron accumulation in the SN is known to increase with age40 and most of the control participants showed intact nigral hyperintensity, we surmise that dopaminergic denervation precedes iron accumulation in the SN. Furthermore, the 123I-FP-CIT SBRs in patients with PD who presented loss of nigral hyperintensity on at least 1 side of the SN were significantly lower than those of patients who presented intact bilateral nigral hyperintensity, but the clinical scores between the 2 groups did not differ significantly. Based on this result, we can assume that patients with PD may present normal bilateral nigral hyperintensity when SBRs on 123I-FP-CIT SPECT are slightly decreased, and the nigral hyperintensity becomes lost with further decrease in SBRs. This hypothesis requires investigation by future research.
In our study, we only adopted the qualitative visual assessment for SMWI without quantitative measurement of nigral hyperintensity or susceptibility. A recent study has adopted the quantitative analytic method for nigrosome-1,41 but the result was preliminary, and the quantitative measurement is not yet widely applied in the clinical practice. Moreover, there has been no study on the precise segmentation of the nigrosome on SMWI, which is the essential prerequisite for correct quantification. Thus, further study for the standardized quantification method for nigrosome-1 is warranted.
Our study has several limitations. First, our PD group lacked the inclusion of participants in either the prodromal or late phases. Because the neurodegenerative process of PD occurs across decades, this omission precluded the elucidation of a more specific relationship between dopaminergic denervation and the loss of nigral hyperintensity. Second, the number of control participants was rather small compared with the number of patients with PD. However, because we included the control participants who underwent both 123I-FP-CIT SPECT and 3T SWI, the number of control participants was unavoidably small. Third, because we focused on visual determination of the nigral hyperintensity, we did not perform quantitative susceptibility analysis of SMWI data. For quantitative analysis, further study on the segmentation of the nigrosome on SMWI is needed. Based on this established method, future studies of the susceptibility quantification in nigrosome-1 on SMWI in correlation with 123I-FP-CIT SBRs are warranted. Fourth, the diagnostic performances of SMWI for PD in our study were different from those in the previous studies using SWI.13,42 This is probably because of the enhanced visibility of nigrosome-1 on SMWI with higher contrast-to-noise ratio than SWI, which may contribute to the higher specificity and positive predictive value of our study. In addition, the differences in the study population and MR imaging protocol between the studies could be another factor resulting in the difference in diagnostic performance. Future multicenter studies with a larger number of patients will be needed to set the optimized imaging protocol for nigrosome-1 assessment.
CONCLUSIONS
Nigral hyperintensity on SMWI showed good concordance with dopaminergic degeneration on 123I-FP-CIT SPECT in patients with PD and control participants. In the PD group, the loss of nigral hyperintensity was dependent on the SBR values of 123I-FP-CIT images. Our results thus suggest that dopaminergic denervation and the loss of nigral hyperintensity might occur in a sequential manner. Future studies on the correlation of clinical characteristics and nigral hyperintensity may help overcome the limitations of 123I-FP-CIT to predict disease severity.43
Acknowledgments
We thank Editage (www.editage.co.kr) for English language editing. We thank the Medical Research Collaborating Center at Seoul National University Bundang Hospital for consultation on the statistical analyses.
Footnotes
Y.J.B. and Y.S.S. contributed equally to the manuscript.
Source of Funding: This work was supported by a National Research Foundation of Korea (NRF) grant funded by the Korean government (MSIT) (No. 2019R1F1A1063771, 2019M3C7A1032718) and a grant (No. 09-2019-003) from the Seoul National University Bundang Hospital Research Fund.
Disclosures: Yun Jung Bae—RELATED: Grant: National Research Foundation of Korea (NRF) grants funded by the Korean government (MSIT) (No. 2019R1F1A1063771, 2019M3C7A1032718) and a grant (No. 09-2019-003) from the Seoul National University Bundang Hospital Research Fund, Comments: These grants provided only financial support. These funding sources have been described in the title page of manuscript.* *Money paid to institution
Indicates open access to non-subscribers at www.ajnr.org
References
- Received June 15, 2021.
- Accepted after revision October 21, 2021.
- © 2021 by American Journal of Neuroradiology


Jump to section
Related Articles
Cited By...
- No citing articles found.