
Abstract
BACKGROUND AND PURPOSE: Patients with neurofibromatosis 1 are at increased risk of developing brain tumors, and differentiation from contrast-enhancing foci of abnormal signal intensity can be challenging. We aimed to longitudinally characterize rare, enhancing foci of abnormal signal intensity based on location and demographics.
MATERIALS AND METHODS: A total of 109 MR imaging datasets from 19 consecutive patients (7 male; mean age, 8.6 years; range, 2.3–16.8 years) with neurofibromatosis 1 and a total of 23 contrast-enhancing parenchymal lesions initially classified as foci of abnormal signal intensity were included. The mean follow-up period was 6.5 years (range, 1–13.8 years). Enhancing foci of abnormal signal intensity were followed up with respect to presence, location, and volume. Linear regression analysis was performed.
RESULTS: Location, mean peak volume, and decrease in enhancing volume over time of the 23 lesions were as follows: 10 splenium of the corpus callosum (295 mm3, 5 decreasing, 3 completely resolving, 2 surgical intervention for change in imaging appearance later confirmed to be gangliocytoma and astrocytoma WHO II), 1 body of the corpus callosum (44 mm3, decreasing), 2 frontal lobe white matter (32 mm3, 1 completely resolving), 3 globus pallidus (50 mm3, all completely resolving), 6 cerebellum (206 mm3, 3 decreasing, 1 completely resolving), and 1 midbrain (34 mm3). On average, splenium lesions began to decrease in size at 12.2 years, posterior fossa lesions at 17.1 years, and other locations at 9.4 years of age.
CONCLUSIONS: Albeit very rare, contrast-enhancing lesions in patients with neurofibromatosis 1 may regress over time. Follow-up MR imaging aids in ascertaining regression. The development of atypical features should prompt further evaluation for underlying tumors.
ABBREVIATIONS:
- FASI
- focus of abnormal signal intensity
- NF-1
- neurofibromatosis type 1
- CE
- contrast-enhanced
Neurofibromatosis type 1 (NF-1) is an autosomal dominant tumor predisposition syndrome characterized by optic pathway gliomas, neurofibromas, skin manifestations, iris hamartomas, and bone lesions, affecting approximately 1 in 3000 individuals.1,2 Foci of abnormal signal intensity, previously known as unidentified bright objects or neurofibromatosis bright objects of the brain, are not among the diagnostic criteria but can be found in 43%–95% of pediatric patients with NF-1.3⇓⇓⇓-7 On MR imaging, FASI appear as T2/FLAIR hyperintense lesions of the brain with a predilection for the basal ganglia, cerebellum, and brain stem. Although FASI are not completely understood, myelin vacuolization is commonly considered as an underlying feature of these lesions.1,4,5,7⇓-9
Patients with NF-1 are at an increased risk of developing low- and high-grade brain tumors, including cerebral and cerebellar astrocytomas, ependymomas, and brain stem gliomas, many of which can mimic FASI on MR imaging.3,10⇓⇓⇓-14 On the other hand, FASI are known for their dynamic properties and may increase or decrease in size or resolve over time.8 Although the reference standard for differentiating brain lesions is transcranial biopsy with its own inherent risks, brain signal abnormalities in patients with NF-1 are primarily followed up by MR imaging to screen for possible tumors.15⇓⇓-18 Contrast enhancement after administration of a gadolinium-based contrast agent is usually considered atypical for FASI and likely to indicate the presence of a brain tumor. Reports considering contrast enhancement in FASI are sparse, limited to case reports and small numbers in cohort studies.3,6,19⇓⇓⇓⇓⇓⇓⇓⇓⇓-29 We therefore aimed to characterize lesions considered to represent enhancing FASI based on location, volume of enhancement, and demographics to advance the understanding of these rare lesions.
MATERIALS AND METHODS
Patients
This retrospective study was approved by the institutional review board (REB 1000065561). Informed consent was waived because of the retrospective nature of the study. Electronic MR imaging reports stored in the PACS at our institution (The Hospital for Sick Children, Toronto, Canada) were searched for patients with NF-1 with the term “enhancing FASI” between 1993 and 2019. Inclusion criteria were 1) patients with NF-1 with a contrast-enhancing lesion within the brain parenchyma considered to be an enhancing focus of abnormal signal intensity in the report and 2) MR imaging studies with axial FLAIR sequences and postcontrast axial and coronal T1-weighted images available. Studies containing images not of diagnostic quality were excluded. A maximum of 1 MR imaging study per year per patient was taken if multiple yearly acquisitions were present.
MR Imaging
Brain MR imaging was acquired on 1.5 and 3T Achieva systems (Philips Healthcare), a 3T Magnetom Skyra (Siemens), and a 1.5T Signa (GE Healthcare) using a standardized departmental protocol including axial FLAIR and contrast-enhanced (CE) axial and coronal T1-weighted sequences. Sequence parameters were as follows:
FLAIR sequence: range of in-plane resolutions, 0.43 mm × 0.43 mm to 0.75 mm × 0.75 mm; section thickness, 3–5 mm; TE, 85–148.5 ms; TR, 7000–9825 ms
3D CE-T1 sequence: in-plane resolution, 0.42 mm × 0.42 mm to 0.52 mm × 0.52 mm; section thickness, 0.42–0.52 mm; TE, 2.7–3.2 ms; TR, 6.8–1970 ms
2D CE-T1 sequence: axial and coronal in-plane resolution, 0.82 mm × 0.82 mm; section thickness, 6 mm (axial) and 5 mm (coronal); TE/TR, 20/666.7 (axial) and 650 (coronal) ms
As per our institutional protocol, the time delay for acquisition of the CE brain sequences was constant. Acquisition of the axial T1-weighted sequence was started 3 minutes after the IV administration of a gadolinium-based contrast agent. The coronal T1-weighted sequence was acquired thereafter. If spine sequences were performed, the CE spine sequences were generally acquired after the brain sequences. All nonenhancing and enhancing FASI were documented for each patient in consensus by a board-certified neuroradiologist with 5 years of neuroradiology experience and a fellowship-trained pediatric neuroradiologist with 6 years of neuroradiology research experience (N.H. and M.W.W.). Disputes were resolved by a senior pediatric neuroradiologist (S.B.) with more than 30 years of experience in pediatric neuroradiology. Enhancing FASI were defined as T2/FLAIR hyperintense, contrast-enhancing lesions on T1-weighted images without cystic, necrotic, or hypercellular features. Lesions that demonstrated diffusion restriction or residual lesions on FLAIR sequences after cessation of contrast enhancement were not considered enhancing FASI. Regression of enhancement was seen as confirmatory of enhancing FASI. Nonregressing lesions lost to follow-up but otherwise fulfilling these criteria were considered enhancing FASI. The outermost edge of enhancement was used to define the diameter. Diameters of the contrast-enhancing aspect of FASI were measured on axial and coronal planes of CE T1-weighted sequences using 2D sequences only when 3D sequences were not available. The volume was estimated for each time point using the ellipsoid formula below in which a, b, and c represent radius in the right–left, anteroposterior, and craniocaudal orientations, as was done in a previous publication focusing on volumetric assessment of nonenhancing FASI.6

Data Analysis
For the purpose of cross-sectional analysis of nonenhancing and enhancing FASI, the cohort was divided into 8 groups of 2-year intervals based on patient age, from 2 to 3.9 years to 16 to 17.9 years. These groups were further subdivided based on lesion location, either in the posterior fossa (brain stem and cerebellum) or supratentorial. Differences between nonenhancing and enhancing FASI in terms of temporal evolution, including first appearance and peak number of lesions, were assessed using the cross-sectional analysis described earlier.
For analysis of enhancing FASI, timelines of all individual enhancing FASI were created based on patient age at beginning and end of the observation period (ie, from first to last MR imaging in our PACS). Volume increase and decrease were documented for every MR imaging study. Nonenhanced T1-weighted images and diffusion-weighted images were reviewed when available. Linear regression analysis of relative volume change with respect to maximum lesion volume, correlated to patient age, was performed for 3 groups of lesion locations (splenium, posterior fossa, and other locations).
RESULTS
Patients
A total of 146 MR imaging examinations from 19 patients diagnosed with NF-1 with a total of 23 contrast-enhancing lesions were included. The mean age was 8.6 years (range, 2.3–16.8 years). Seven patients were male, with a mean age of 7.8 years (range, 2.3–13.5 years); the 12 female patients had a mean age of 9.1 years (range, 2.6–16.8 years) (Fig 1). The mean follow-up period was 6.5 years (range, 1–13.8 years). All MR imaging studies were performed upon referral of a provider directly involved in the patient’s care; indications for initial MR imaging included suspected optic glioma, plexiform neurofibromas of the neck or face with additional brain imaging, headaches, new-onset hemifacial and extremity weakness, and developmental difficulties. Two patients developed tumors of the splenium, which were ascertained by biopsy (gangliocytoma and astrocytoma WHO II). Both lesions had been initially thought to represent enhancing FASI based on imaging. Images from 1 patient were unavailable for review; thus, information regarding enhancing FASI (1 cerebellar and 1 globus pallidus) for the timeline was obtained from the radiologic reports. Contrast enhancement completely resolved over time for both of this patient’s lesions. This patient was only included in the longitudinal evaluation of location of enhancement because neither measurement of lesions nor correlation with other imaging sequences was possible. A further 16 studies missing axial FLAIR images, 6 studies missing CE T1-weighted sequences, and 2 studies not retrievable from long-term PACS storage were excluded. In summary, a total of 109 MR imaging studies of 23 lesions were included, 2 of which were later proved to be tumors, and 2 lesions from 1 patient were not available for viewing in PACS.
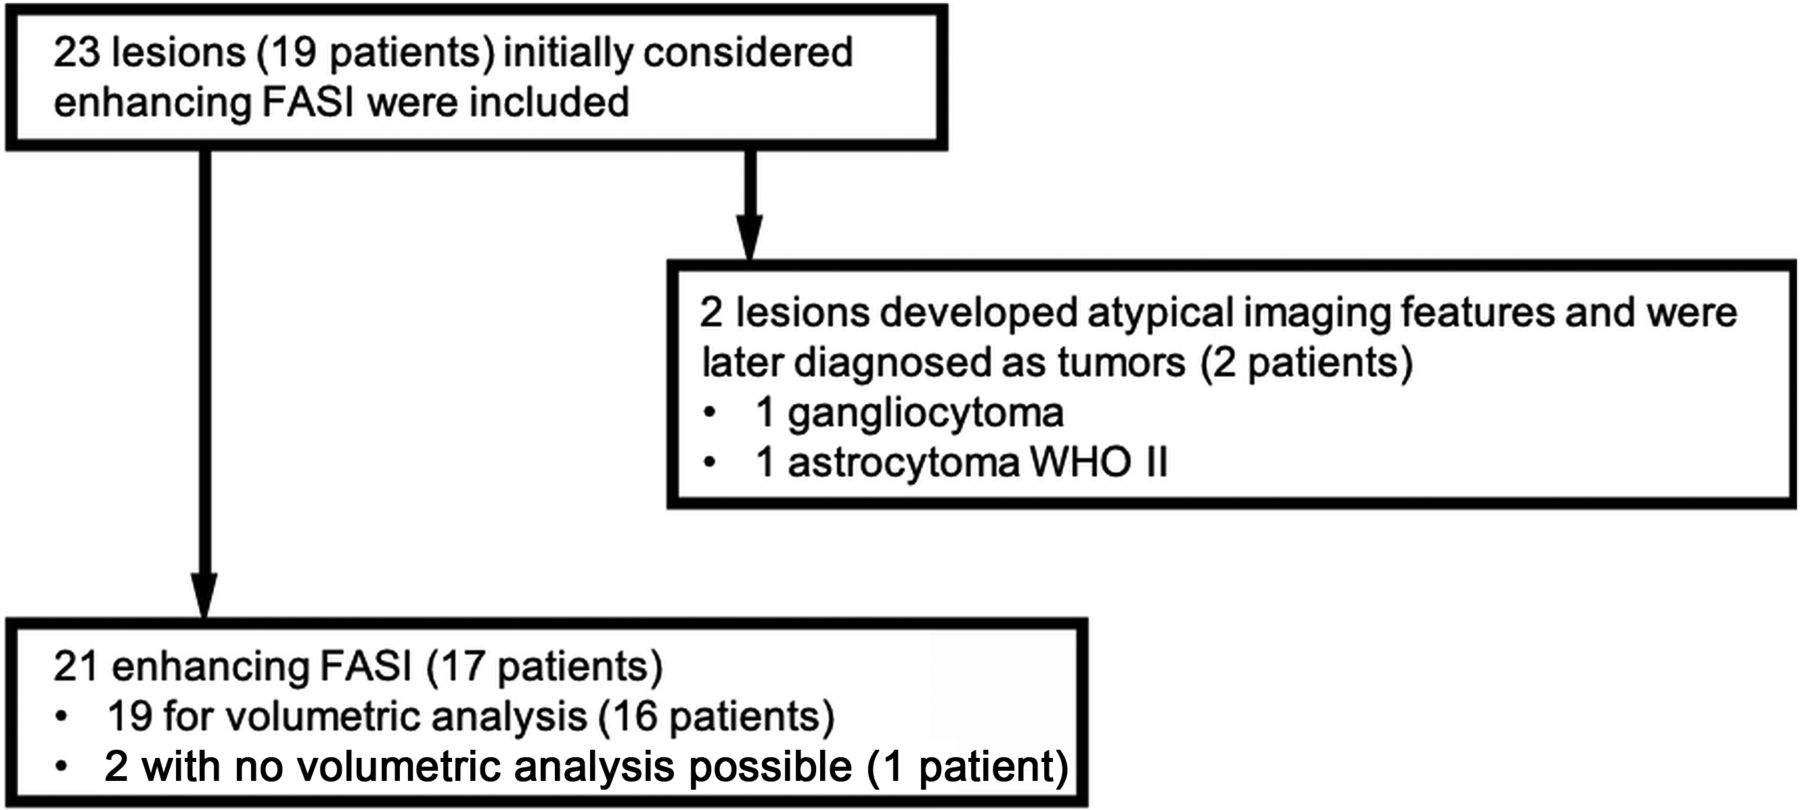
Diagram showing the number of patients with NF-1 included in the study.
FASI
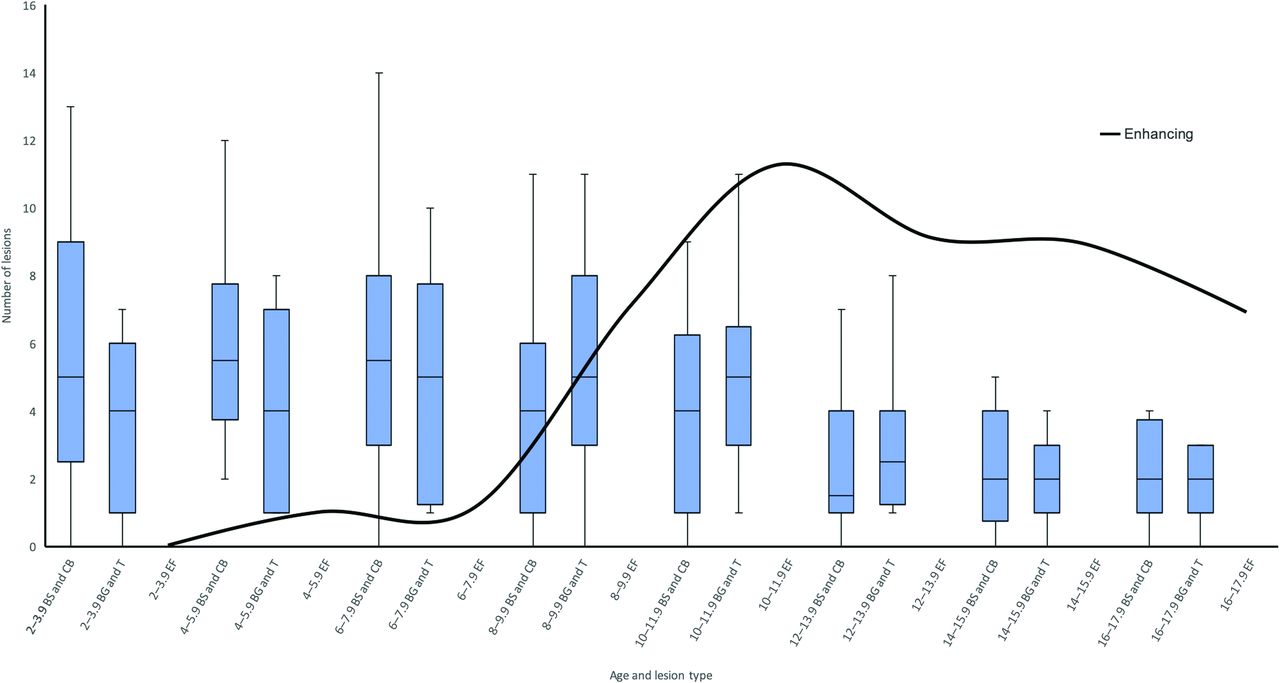
Patient age group data for nonenhancing and enhancing FASI are listed in Table 1 as total, mean, and range. Notably, age at peak number of nonenhancing FASI within the basal ganglia and thalamus group was 8 to 9.9 years (mean, 5.3 lesions) and in the brain stem and cerebellum group was 2 to 3.9 years (mean, 6.5 lesions) (Fig 2). These lesions demonstrated high ADC (ie, facilitated diffusion) and variable signal intensities on nonenhanced T1-weighted images, ranging from hypo- to hyperintense. Of note, hyperintense lesions on T1-weighted images were found predominantly in the basal ganglia and cerebellum.
Patient age group data for enhancing FASI (total) and nonenhancing FASI according to subgroup

Combined box-and-whisker plot of the temporal evolution of FASI in the brain stem and cerebellum (BS and CB) group (left box-and-whisker plot in the doublet), basal ganglia and thalamus (BG and T) group (right box-and-whisker plot in the doublet), and enhancing FASI (EF, total of all patients, continuous curved black line), grouped in 2-year patient-age intervals, beginning at 2–3.9 years. Contrast-enhancing FASI appear later and peak later (11 lesions, 10- to 11.9-year-old age group) compared with nonenhancing FASI (BS/CB peak in 6- to 7.9-year-old age group and BG/T peak in 8- to 9.9-year-old age group).
Of the 21 contrast-enhancing FASI, 8 (38%) were found in the splenium of the corpus callosum, 1 (5%) in the body of the corpus callosum, 2 (10%) in the white matter of the frontal lobe, 3 (14%) in the globus pallidus, 6 in the cerebellum (28%), and 1 (5%) in the midbrain. For the 19 contrast-enhancing FASI accessible in PACS, lesions were round to ovoid in shape and demonstrated enhancement patterns ranging from homogeneous and well-defined to inhomogeneous or irregular with predominantly peripheral enhancement. Fourteen lesions had DWI sequences available for correlation. All of these lesions demonstrated increased ADC. Of the 5 lesions for which no DWI sequence was available, 1 lesion demonstrated a continuous increase in size until final follow-up (cerebellum). Of the remaining 4 lesions without DWI sequences, 1 completely resolved (globus pallidus), and 3 decreased in size (2 splenium, 1 cerebellum), paralleling the natural evolution of their nonenhancing FASI counterparts. Nonenhanced T1-weighted images were available for 16 of 19 lesions and demonstrated a spectrum of findings. One globus pallidus lesion was hyperintense, 2 cerebellar lesions contained areas of hyperintensity, and 2 splenium lesions contained areas of isointensity relative to white matter. Mass effect, a finding previously described in enhancing FASI,23,27,29 was seen in 1 cerebellar lesion and 4 splenium lesions, which persisted on final MR imaging.
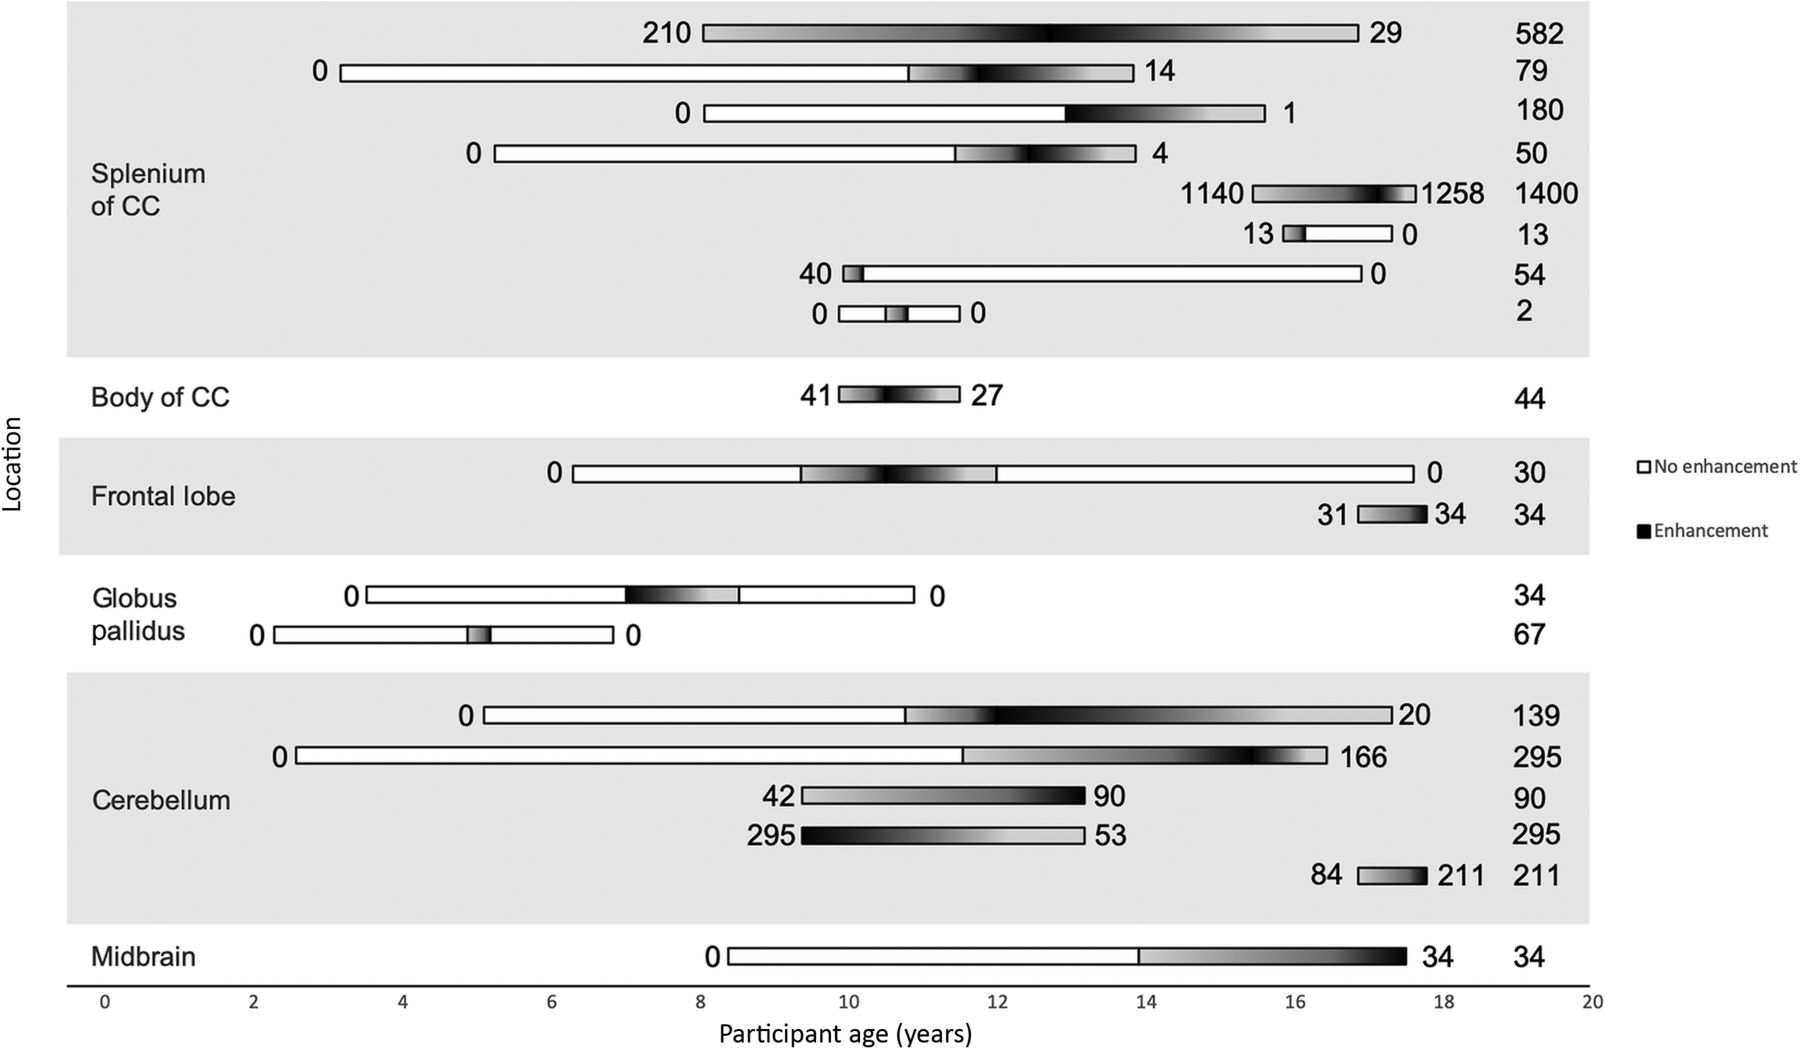
Patients with splenium lesions had an average of 5.5 MR imaging studies per patient (range, 2–9). Apart from the 2 biopsy-proven tumors, all 8 lesions demonstrated a decrease in enhancing lesion volume over the course of follow-up (Fig 3), with 3 lesions (38%) completely resolving. Mean age at first depiction of an enhancing splenium lesion was 11.5 years (range, 8.0–15.8), and mean age at maximum lesion volume was 12.9 years (range, 10.2–17.1). Median enhancing lesion volume at first depiction was 26 mm3 (range, 1–1140 mm3), and median peak lesion volume was 66 mm3 (range, 2–1400 mm3). The 3 enhancing FASI demonstrating complete resolution of contrast enhancement were among the 4 smallest peak enhancing lesion volumes (54, 13, and 2 mm3). Further data on enhancing volumes are shown in Fig 3.

Horizontal plot of all volumetrically assessed contrast-enhancing FASI. White bars represent imaging studies where no contrast enhancement was noted. The white-to-black (left to right) gradient represents increasing enhancing volume; the black-to-white (left-to-right) gradient represents decreasing enhancing volume. The numbers to the left and right of the bars indicate the enhancing FASI volume on first and last MR imaging. The numbers on the far right indicate the largest measured enhancing volume for the respective lesion; all values are in cubic millimeters. All 8 lesions within the splenium are seen to either decrease in size or completely resolve before age 18 years (not including the 2 lesions later proved to be tumors). Both globus pallidus lesions completely resolved before age 11 years. Only 3 of 6 posterior fossa (cerebellum and midbrain) lesions were seen to decrease in size on final MR imaging. Body of corpus callosum (1 lesion) and frontal lobe lesions (2 lesions) did not show any conceivable trends. The 2 contrast-enhancing FASI not available for viewing in the PACS are not included in this figure.
Of the remaining (nonsplenium) 13 enhancing FASI, 11 could be assessed volumetrically. Patients had an average of 6.2 studies (range, 2–10). Six lesions decreased in enhancing volume: 1 in the body of the corpus callosum, 1 in the frontal lobe white matter (completely resolved), 1 in the globus pallidus (completely resolved), and 3 in the cerebellum. Three of 6 posterior fossa lesions decreased in volume. Four lesions (1 frontal lobe lesion, 2 cerebellar lesions, and the midbrain lesion) increased in enhancing volume before being lost to follow-up. In 3 of these 4 patients, the last MR imaging was performed just before the age of 18 years (mean, 17.5 years; range, 17.5–17.7 years), after which the patients were followed up at adult hospitals. Mean age at first depiction of the enhancing lesion was as follows: cerebellum, 10.7 years (range, 9.4–16.8); globus pallidus, 6 years (range, 4.9–7); and other locations (1 body of corpus callosum, 1 midbrain, 2 frontal lobe), 12 years (range, 9.3–16.8). Median lesion volume at first depiction of all 11 enhancing FASI was 44 mm3 (range, 30–295 mm3), and median maximum depicted lesion volume was 67 mm3 (range, 30–295 mm3).
Regression analysis revealed the age at which lesions transitioned from an overall increase in size to a decrease in size (Fig 4). Splenium lesions began decreasing in size at 12.2 years (R2 coefficient, 0.12); posterior fossa at 17.1 years (R2 coefficient, 0.04); and globus pallidus, frontal, and body of corpus callosum lesions were grouped together as “other” at 9.4 years of age (R2 coefficient, 0.03).
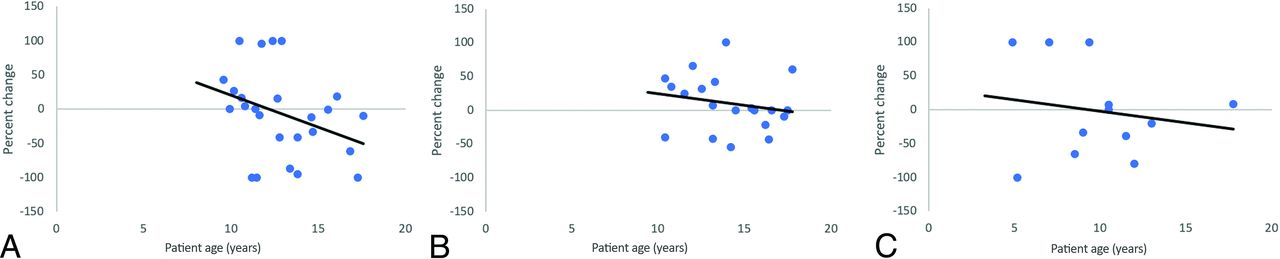
Linear regression analysis of splenium lesions (A); posterior fossa lesions, including the cerebellum and midbrain (B); and other lesions, including the globus pallidus, body of the corpus callosum, and frontal lesions (C). Enhancing FASI lesion volumes are expressed as ratios of interval change divided by maximum lesion volume. The x-intercept represents the transition point at which lesions begin to decrease in size. Splenium lesions began decreasing in size at 12.2 years, posterior fossa at 17.1 years, and other lesions at 9.4 years of age.
Biopsy-Proven Tumors
Two biopsy-proven tumors were included in our study, both located in the splenium and initially indistinguishable from enhancing FASI. One of these lesions developed cystic components after a follow-up period of 2 years 1 month and was thus resected (at patient age of 12 years); histology confirmed gangliocytoma. This lesion was hypointense on nonenhanced T1-weighted imaging; DWI was not performed before resection. The second lesion, also located in the splenium, initially demonstrated an imaging appearance and time course indistinguishable from FASI; it increased in size and enhancement, peaking at the age of 15 years before beginning to regress (Fig 5). After 2 further follow-up studies, however, an enhancing focus within the lesion again began to increase in size at age 17 years. At this point, the lesion was resected; histology confirmed a WHO II astrocytoma. This lesion was hypointense on T1-weighted imaging and demonstrated high ADC (increased diffusivity). Mass effect was seen in both lesions.

Typical (A–D) and atypical (E–H) evolutions of enhancing FASI. A–D demonstrate, a lesion in the splenium or right forceps major increasing in size to age 13 years (B) and decreasing thereafter with near complete resolution of contrast enhancement on final imaging (D). E–H represent an atypical contrast enhancement pattern in a histologically proved WHO II astrocytoma. This lesion initially demonstrated evolution identical to FASI, increasing in size up to age 15 years (F) before beginning to regress (G). At this point, however, the small right periventricular enhancing aspect again began increasing in size at age 17 years (H). At this point, the lesion was resected because this was considered to be atypical for an enhancing FASI. Mass effect was noted in both lesions.
DISCUSSION
In this study, we characterized the natural evolution of 23 rare, contrast-enhancing lesions initially thought to represent enhancing FASI in patients with NF-1. Two lesions developed atypical features on follow-up and were demonstrated to be tumors by biopsy. The temporal evolution of contrast-enhancing FASI appeared to begin later compared with nonenhancing FASI: no contrast-enhancing FASI were observed before the age of 4 years, but nonenhancing FASI were already found at the age of 2 years with a mean number of 6.5 lesions in the brain stem or cerebellum and 3.6 lesions in the basal ganglia or thalamus. The peak number of enhancing FASI in our cohort was also seen at a later age compared with nonenhancing FASI.
Enhancing FASI
In our study, regional differences in the evolution of enhancing FASI are noted. Apart from the 2 lesions later proved to be tumors, all 8 (100%) contrast-enhancing FASI in the splenium decreased in enhancing volume before the age of 18 years. By contrast, 3 of 6 (50%) contrast-enhancing FASI located in the posterior fossa increased in size up to the final MR imaging, with 2 of these patients imaged just before the age of 18 years. This difference was also reflected in regression analysis because lesions in the splenium demonstrated a transition to overall decrease in size at the age of 12.2 years, but this transition was observed much later at the age of 17.1 years in lesions located in the posterior fossa.
In the largest previous study involving contrast-enhancing FASI, Salman et al23 describe 14 enhancing FASI in 8 patients. Of 5 cerebellar lesions, 3 demonstrated resolution of enhancement (at ages 13.5, 11.2, and 5.5 years, respectively), and 2 demonstrated persistent enhancement on their last MR imaging scan (at ages 19 and 19.9 years), which is similar to our findings. Other publications on contrast-enhancing FASI have been limited to case reports and very small numbers in cohort studies, and only a few of these provide details on follow-up and age.3,6,19⇓⇓⇓⇓⇓⇓⇓⇓⇓-29
Considerations Regarding MR Imaging Follow-up
In a study focusing on the splenium of the corpus callosum, Mimouni-Bloch et al30 argue that baseline MR imaging should be considered in all patients with NF-1. Although lesions in the splenium are typically asymptomatic, current recommendations state MR imaging to be mandatory only in symptomatic patients.31 Brain lesions may spontaneously regress in patients with NF-1. Our study demonstrated that both enhancing and nonenhancing FASI can regress and disappear over time. Studies focusing on optic pathway and hypothalamic gliomas have documented spontaneous regression of these lesions, and a single case report describes the rare, spontaneous involution of a histologically proved pilocytic astrocytoma of the internal capsule.32⇓⇓⇓-36 The subclinical manifestation and spontaneous regression of brain lesions in NF-1 make follow-up decisions including reimaging and possible intervention a challenge.
Two lesions in our study first thought to be enhancing FASI of the splenium began demonstrating atypical features on follow-up, prompting resection; both turned out to be histologically proven tumors. One lesion, ultimately demonstrated to be a gangliocytoma, developed a cystic component, a finding considered atypical for FASI and likely indicative of a tumor.3,23 The second lesion, ultimately shown to be a WHO grade II astrocytoma, demonstrated a second wave of increasing volume and contrast enhancement after near complete resolution. Although small areas of this lesion did not fully stop enhancing, it is conceivable that lesions in patients with NF-1 exist that completely resolve before recommencing enhancement.
DWI and nonenhanced T1-weighted sequences were not able to differentiate biopsy-proven tumors from enhancing FASI or differentiate among the enhancing FASI found at different locations in our study. Signal hyperintensity on T1-weighted imaging has been previously described in FASI37 and could help to differentiate FASI from generally T1-hypointense low-grade tumors. In our study, many FASI (both enhancing and nonenhancing) were found to be hypointense on T1-weighted imaging as well, though. Moreover, both FASI and low-grade tumors demonstrated facilitated diffusivity on ADC in our study. These findings reiterate the uncertain nature of FASI. Contrast-enhancing FASI and low-grade glioma may be impossible to distinguish even on follow-up imaging because they may share similar imaging features and may regress over time.32⇓⇓⇓-36 Our study demonstrated that enhancing FASI tend to regress, paralleling the evolution of the more prevalent nonenhancing FASI. The underlying pathophysiology, however, remains uncertain, and low-grade gliomas and contrast-enhancing FASI cannot be differentiated with final certainty.
Although rare, radiologists should be aware of contrast-enhancing FASI, their possible initial increase in size, and their potential to regress with location dependent timelines because this may help prevent unnecessary biopsy or resection. Awareness regarding atypical follow-up behavior (ie, a second wave of contrast enhancement or development of atypical features) is warranted, and follow-up examinations after cessation of contrast enhancement are recommended.
Limitations
Some limitations of our study need to be taken into account. Our relatively small cohort precluded statistical analysis of contrast-enhancing FASI with respect to differences between age groups and locations. Variable durations of follow-up also limited the longitudinal characterization of contrast-enhancing lesions, especially of those that demonstrated continued enhancing volumes on their final studies and were lost to follow-up. As a further limitation of this retrospective study, MR acquisition protocols varied, and nonenhanced T1-weighted sequences and DWI were not acquired in all patients. Variable section thicknesses may have influenced the measurements of small lesions and minor variations in volume are possible. Apart from the biopsy-proven tumors, no histologic correlation for the enhancing FASI was obtained, and the term “enhancing FASI” was used for lack of better terminology. Finally, referral bias may play a role because our institution is a tertiary care center and may experience a different spectrum of patients compared with what is seen elsewhere.
CONCLUSIONS
In this study, we characterize the natural evolution of 23 rare, contrast-enhancing lesions initially thought to represent enhancing FASI in patients with NF-1, with 2 of these lesions developing atypical features on follow-up and later proved to be tumors. The largest subgroup of these lesions occurred in the splenium of the corpus callosum and followed a benign course. MR imaging follow-up of size-increasing, contrast-enhancing lesions in patients with NF-1 differentiates between a benign course (decrease or resolution of enhancement) and new findings (cysts, recurrent increase of enhancement), prompting further evaluation for underlying tumors.
Footnotes
N.H. and M.W.W. contributed equally to the manuscript.
References
- Received June 8, 2020.
- Accepted after revision October 23, 2020.
- © 2021 by American Journal of Neuroradiology


Jump to section
Related Articles
Cited By...
- No citing articles found.