
Abstract
SUMMARY: Patients with glutaric aciduria type 1, without early diagnosis and initiation of preventive treatment, often develop movement disorders and various degrees of motor disability due to striatal area–specific damage induced by an acute episode of metabolic decompensation. The neuroimaging phenotype of patients with glutaric aciduria type 1 includes characteristic cyst-like bilateral enlargement of the Sylvian fissures and anterior subarachnoid spaces and signal abnormalities including supratentorial white matter and deep gray matter structure T2 hyperintensities, frequently associated with restricted diffusion. In this retrospective study, we add to the neuroimaging spectrum of glutaric aciduria type 1, a novel imaging finding present regardless of a previous metabolic crisis: the enlargement of the optic chiasm associated with signal abnormalities in the anterior intracranial visual structures observed in 6 of 10 patients. These optic pathway abnormalities are suggested as useful diagnostic clues for glutaric aciduria type 1, and possible pathophysiologic mechanisms are discussed.
ABBREVIATION:
- GA-1
- glutaric aciduria type 1
Glutaric aciduria type 1 (GA-1) is a rare autosomal recessive neurometabolic disorder caused by a deficiency of the mitochondrial enzyme glutaryl-CoA dehydrogenase, which is involved in the catabolic pathway of the amino acids lysine and tryptophan.1,2 Enzyme deficiency results in accumulation of glutaric and glutaconic acids, responsible for a brain cytotoxic effect, particularly in the basal ganglia.1,2 The clinical course of the disease varies from asymptomatic, for a minority of patients, to a severe disabling movement disorder that usually occurs early in life following an acute encephalopathic crisis in the setting of catabolic situations such as childhood febrile infections.1,2
Despite phenotypic heterogeneity, typical brain imaging findings have been described, including widening of the Sylvian fissures and subarachnoid frontotemporal spaces and signal abnormalities within the corpus striatum and white matter.3⇓-5
In this study, we aimed to broaden the neuroimaging phenotype of GA-1 in children and describe novel MR imaging findings.
Case Series
We retrospectively reviewed 10 brain MR imaging studies from 10 children (3 girls and 7 boys from 5 months to 8 years of age with a median age of 1.5 years) with GA-1 to describe the brain morphologic and signal abnormalities. MR imaging examinations were performed in different medical centers with different sequence parameters and were collected in our institution as patients were referred for further investigations and treatment.
Inclusion criteria were a definite diagnosis of GA-1 confirmed on the basis of biochemical (urine organic acids and plasma acylcarnitines) and molecular diagnoses and the availability of a brain MR imaging study of diagnostic quality, including at least axial or coronal T2WI and T1WI and a diffusion-weighted sequence (b = 0 and 1000). For symptomatic children having >1 brain MR imaging, the first examination performed after the diagnosis of GA-1 was analyzed for the study. Clinical reports were available for all patients, and specifically, data on visual disturbances were retrieved from clinical charts.
Six children were symptomatic, having already experienced an encephalopathic crisis, and presented with various degrees of dystonia and motor disability at the time of brain MR imaging. Four children of 6 had macrocephaly, and 5 children of 6 presented with mild or moderate intellectual disability. The mean time interval between the encephalopathic crisis, further referred to as a “metabolic crisis,” and the brain MR imaging was 9 months (range, 1–42 months).
At the time of brain MR imaging, 4 children did not present with episodes of metabolic decompensation. Two of them were siblings with macrocephaly and were diagnosed by family screening, 1 child was diagnosed during routine evaluation of macrocephaly, and the last one was evaluated for moderate intellectual disability.
MR images were reviewed in consensus for quality and were interpreted by 2 pediatric radiologists (M.E.-B. and A.A.N.) with experience in neuroradiology.
The lack of a standardized 3D acquisition for all brain MRI in our cohort did not allow us to make reproducible optic chiasm measurements; thus, the observation of optic chiasm enlargement was subjective.
Gray matter and white matter signal abnormalities were defined as areas of hyperintensity on T2WI. White matter signal intensity was considered abnormal if the T2 hyperintensity did not correspond to the normal pattern of myelination according to the age.
Interpretation of DWI was performed qualitatively by visual assessment. When abnormal signal was depicted on conventional sequences, the b-value images and ADC maps were analyzed and compared with normal brain area, to assess restricted diffusion. The calculation of ADC values and a comparative study with an age-matched control group were avoided, taking into account the ongoing process of white matter myelination in the first years of life and the wide age range of children included in the study.
MR Imaging Interpretation
The results are summarized in detail in the Table.
MR imaging features and frequency of regional abnormalities observed in patients with and without previous metabolic crises
All patients (n = 10) presented with a bilateral cyst-like dilation of the Sylvian fissures, the so-called “bat wing appearance” associated with enlargement of the anterior temporal and frontal subarachnoid spaces (Figs 1 and 2).

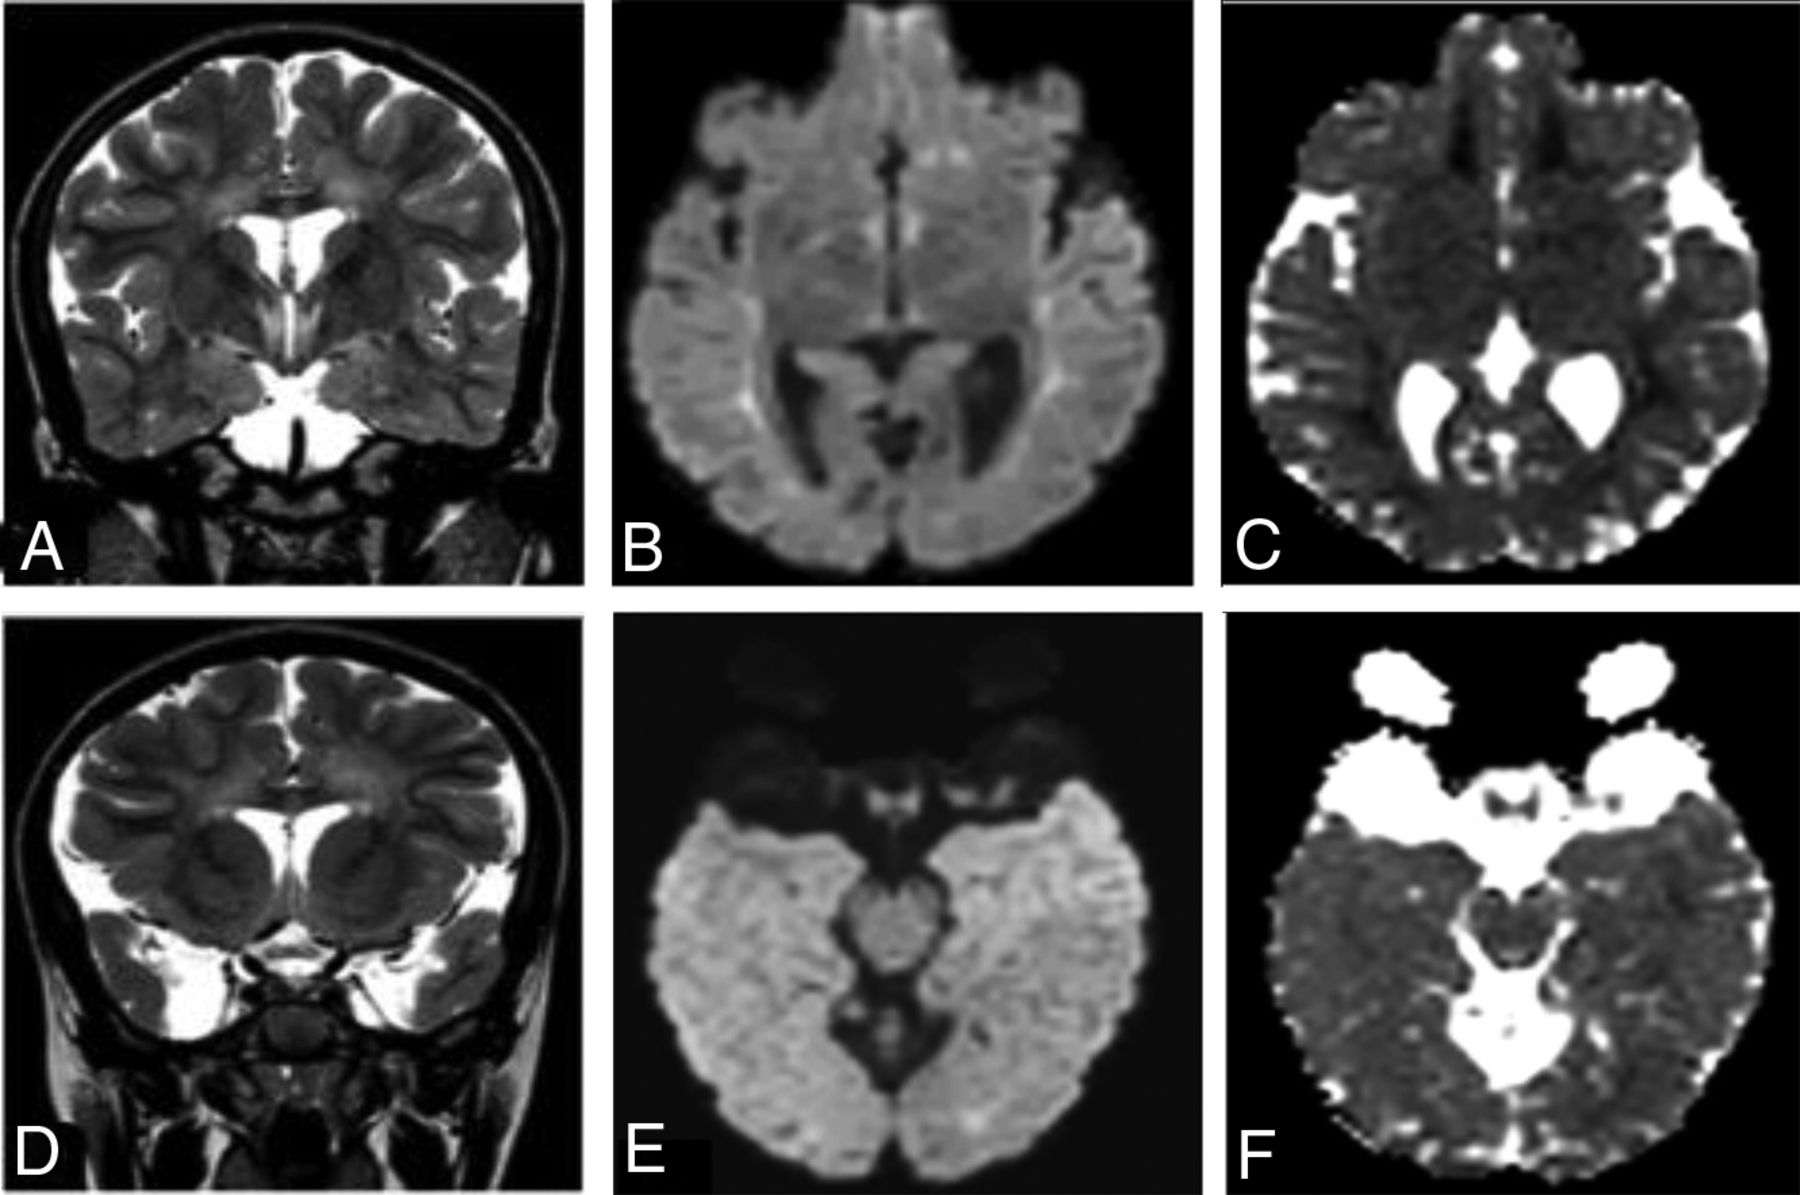
A 16 -month-old patient with GA-1, having experienced a metabolic crisis. A and D, Axial FLAIR and coronal T2-weighted images. B and E, Axial diffusion sequences. C and F, Axial ADC maps. Characteristic bat wing widening of the Sylvian fissures and enlargement of subarachnoid temporal spaces are shown. Lateral ventricular moderate dilation is also shown. Bilateral symmetric atrophy and abnormal T2-FLAIR hyperintense signal in striatal area show increased diffusion on ADC maps, suggesting striatal necrosis related to the history of metabolic decompensation. The globus pallidi and thalami also demonstrate bilateral abnormal hyperintensity associated with restricted diffusion away from the acute metabolic crisis. Patchy areas of hyperintense T2-FLAIR signal abnormalities without restricted diffusion are found in the superficial bilateral white matter, persisting on the follow-up for up to 6 years. The optic chiasm is thickened, displaying abnormal hyperintense T2 signal and restricted diffusion also involving the intracranial optic nerves.

A 7-year 10-month-old patient with GA-1, free from a history of previous metabolic crisis. A and D, Coronal T2-weighted images. B and E, Axial diffusion sequences. C and F, Axial ADC maps. Characteristic Sylvian fissure enlargement and anterior arachnoid temporal cysts are shown. Note the absence of signal abnormalities in the deep gray matter structures, especially in the striatum; however, abnormal hyperintense T2 signal is observed bilaterally in the periventricular white matter displaying restricted diffusion. Abnormal areas of T2 signal with restricted diffusion are also demonstrated in the bilateral medial wall of the hypothalamus and in the markedly enlarged optic chiasm.
All children with previous metabolic crises (n = 6) demonstrated striatal atrophy with bilateral, symmetric T2 hyperintensity and increased diffusion in the putamen, and in 4 children, in the caudate nuclei (Fig 1). Bilateral globus pallidus T2 hyperintensity was observed in all patients who had experienced a metabolic crisis (n = 6), showing restricted diffusion in half of the patients (n = 3) as well as in 3 of 4 patients free from any history of metabolic crisis.
Signal abnormalities were also observed in deep gray matter structures apart from the basal ganglia, affecting children irrespective of the presence of a previous metabolic crisis. Abnormal T2 hyperintensity with or without restricted diffusion was occasionally demonstrated in the bilateral posteromedial aspect of thalami, in the brainstem nuclei including the substantia nigra the central tegmental tracts, and, finally, in bilateral dentate nucleus.
Supratentorial white matter diffuse hyperintensity on T2WI was invariably observed, with a predominant pattern of periventricular distribution in 9 of 10 patients. White matter hyperintensities displayed restricted diffusion on DWI in 7 children, 4 of them with previous episodes of metabolic crisis (Figs 1 and 2). A single child with only subcortical white matter affected was noticed.
In 6 of 10 children, including 2 patients without previous metabolic crisis, we noticed enlargement of the optic chiasm displaying an abnormal T2 hyperintensity with restricted diffusion in all except 1 child (Figs 3 and 4). In 4 of 10 patients, including 2 without a previous encephalopathic crisis, the signal abnormalities extended bilaterally in the prechiasmatic intracranial segment of the optic nerves and posteriorly along the optic tracts (Figs 1E, -F and 2E, -F), despite visual disturbances not being noticed according to the available clinical data.

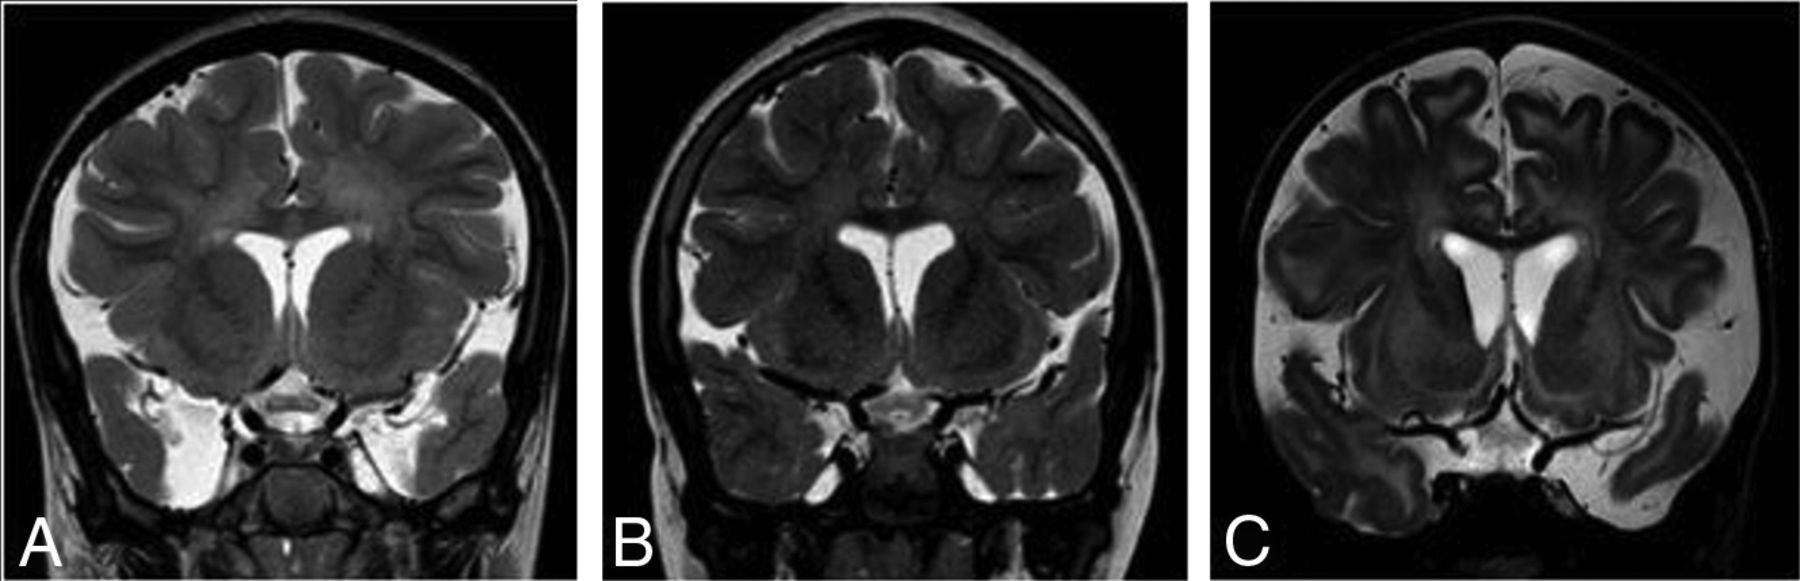
Coronal T2-weighted images showing enlargement of the optic chiasm and displaying an abnormal T2 hyperintensity in 3 different patients. A, A 7-year 10-month-old patient without a history of a previous metabolic crisis. B, An 8-year-old patient not having experienced a metabolic decompensation. C, A 10-month-old patient with a history of encephalopathic crisis at 8 months of age.

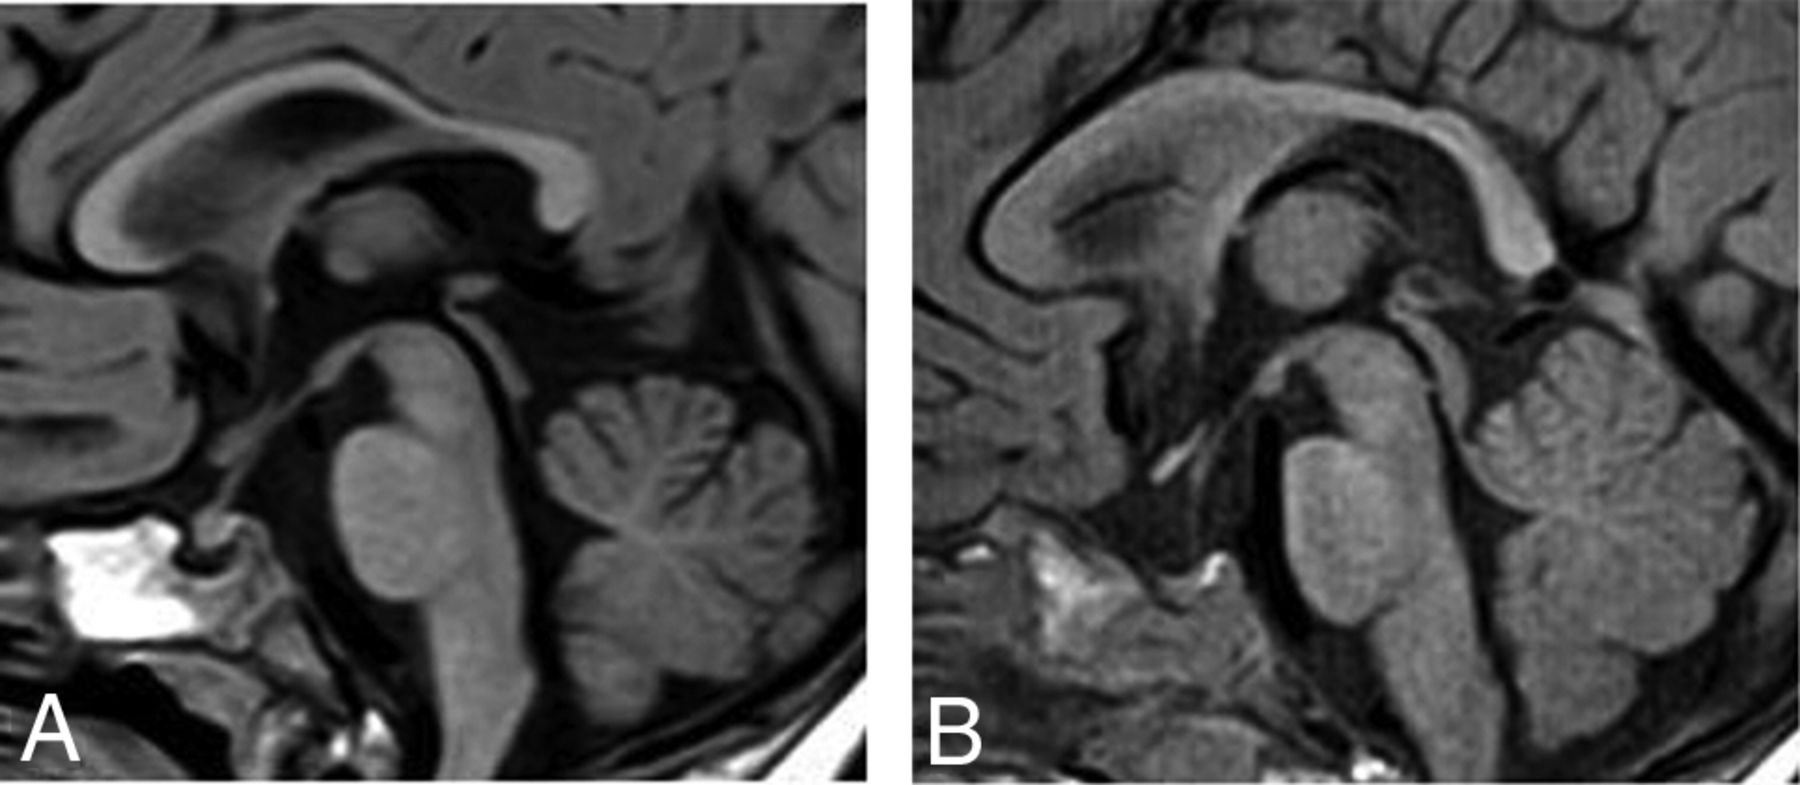
Midline sagittal T1-weighted images showing enlargement of the optic chiasm. A, A 10-month-old patient with GA-1 and a history of encephalopathic crisis, compared with B, a healthy child of a similar age.
Additionally, in the same patients, abnormal hyperintense T2 signal with restricted diffusion was found in the lower medial surface of the third ventricle, corresponding to the area of the anterior hypothalamic component (Fig 2A, -B).
DISCUSSION
Neuroradiologic findings of GA-1 with emphasis on brain MR imaging have been adequately described in the literature. Despite the variability in the clinical phenotype, patients with GA-1 share some similar characteristic brain imaging findings that should facilitate the diagnosis in the absence of neonate screening.3⇓-5 The data presented herein show novel GA-1 neuroimaging findings, including enlargement of the optic chiasm and intracranial visual pathway signal abnormalities.
Six of 10 patients in our cohort had abnormalities in the anterior intracranial visual pathway and the lower medial surface of the third ventricle. Enlargement of the optic chiasm and abnormal hyperintensity on T2WI, extending in the intracranial segment of the optic nerves and along the optic tracts, was observed. In 5 of 6 children, restricted diffusion was also noticed. None of the affected patients had known visual disturbances at the time of brain MR imaging; however, full ophthalmologic evaluation was not available.
Eye abnormalities including cataract, strabismus, pigmentary retinopathy, and intraretinal hemorrhages have rarely been reported in patients with GA-1.6 A single case of bilateral optic atrophy has also been reported in a child diagnosed with GA-1 by neonate screening.7
Optic neuropathy is a well-known complication in the course of several organic acidurias. Several neuroimaging reports have described atrophy and signal abnormalities in the optic nerves and chiasm in individual subjects with propionic and methylmalonic acidurias.8,9 Although the exact pathophysiology of optic neuropathy in organic acidurias has not been adequately elucidated, it is believed that it is due to the neurotoxic effect of the accumulated organic acids, with subsequent impairment of mitochondrial energy metabolism.8,9
Atrophy of the optic nerves or chiasm was not observed in our patients. Conversely, the optic chiasm was found enlarged, and signal abnormalities were found even in asymptomatic patients without striatal lesions, suggesting a pathophysiologic mechanism not related to a previous episode of metabolic crisis. As a possible explanation, we suggest that lesions of the optic nerves and chiasm might be related to the same pathophysiologic mechanism proposed for the white matter abnormalities. Neurotoxic spongiform myelinopathy might affect the myelinated nerve fibers in the visual pathway, resulting in cytotoxic edema and restricted diffusion on MR imaging. This suggestion is supported by a postmortem report in a child with GA-1 having experienced acute encephalopathy in which the neuropathology demonstrated spongiform myelinopathy in the white matter and the optic nerves.10
Patients with lesions of the optic chiasm also demonstrated signal abnormalities around the lower medial surface of the third ventricle, corresponding to the anatomic region of the anterior hypothalamic nuclei. The hypothalamic portion of the third ventricle is composed of a number of nuclei and fiber tracts and represents a region of increased energy demands, with increased susceptibility to energy imbalance.11
Based on imaging findings, in the pediatric population, the differential diagnosis of optic nerve and chiasm enlargement should invariably include optic nerve glioma, frequently seen in the context of neurofibromatosis type 1. Leukemia, histiocytic or granulomatous infiltration, and inflammatory and postviral optic neuritis are also possible differential diagnoses to consider. In a clinical context suggestive of metabolic disorder, the enlargement of the optic chiasm should raise the suspicion of a lysosomal storage disorder. Optic chiasm hypertrophy and enhancement have been described in Krabbe disease, thought to be due to accumulation of the globoid cells that are diagnostic for the disease.12 Recently, the presence of optic nerve hypertrophy in a patient with early metachromatic leukodystrophy has been reported, and the authors have postulated that it might represent the early stage of optic involvement in metachromatic leukodystrophy, which is expected to lead to optic atrophy.13 Finally, a tumorlike enlargement of the optic chiasm has also been described in a child with infantile Alexander disease.14
In accordance with the literature, all our patients had neuroradiologic findings previously described in GA-1.
The particular morphology of enlarged bat wing Sylvian fissures was invariably found in our cohort and has been widely described as an almost constant imaging finding, highly suggestive of GA-1 when associated with macrocephaly.3⇓-5
Furthermore, bilateral and symmetric striatal lesions have been described as the most peculiar imaging finding related to the occurrence of the metabolic crisis in patients with GA.3⇓-5 Although the exact pathophysiology of these region-specific abnormalities is not fully understood, they are believed to represent cytotoxic edema induced by the brain accumulation and trapping of GA-1 metabolites.15,16 There is increasing evidence that glutaric acid and 3-hydroxyglutaric acid induce neurotoxicity, mainly by disturbing the intracellular mitochondrial energy metabolism and impairing the balance in the GABAergic brain neurotransmission process.15,16 In our cohort, all striatal lesions observed in patients with previous metabolic crisis had increased diffusion on the ADC maps representing rather the chronic stage of the disease, related to the long time interval between the episode of acute encephalopathy and the MR imaging examination.
Extrastriatal deep gray matter lesions, including mainly the globus pallidus and the thalamus, were observed in our study coexisting with striatal lesions in patients with a previous history of metabolic crisis but also as isolated lesions in children free from metabolic crisis. Previous reports have mentioned the presence of extrastriatal deep gray matter abnormalities in patients with GA-1 without encephalopathy, and a correlation with the presence of prominent white matter lesions has been described, reflecting the fact that globus pallidus, thalamus, and brainstem gray matter nuclei are rich white matter structures and thus are affected by changes in white matter microstructure.16,17
It has been proposed that white matter abnormalities in GA-1 represent spongiform myelinopathy, independent of the acute encephalopathic brain injury, probably attributed to intramyelinic edema caused by the toxic effects of accumulating metabolic substances.15 Intramyelinic edema with myelin vacuolation decreases the extracellular space, resulting in restricted diffusion. White matter signal abnormalities were invariably described in patients included in our study, displaying restricted diffusion in 8 children. Periventricular white matter distribution was the predominant pattern observed.
This study has limitations that should be addressed. It is retrospective, including a relatively small sample size; however, in rare diseases such as GA-1, the small number of patients enrolled is a limitation difficult to overcome. Another limitation is the lack of a clinicoradiologic association for MR imaging abnormalities observed in the anterior visual pathway.
CONCLUSIONS
We report, for the first time, 6 children with GA-1 presenting with enlargement of the optic chiasm and signal abnormalities in the anterior intracranial visual pathway and the medial surface of the third ventricle, regardless of a previous metabolic crisis. The pathophysiologic mechanism for these lesions is unknown, and correlation with clinical symptoms should be further investigated.
Acknowledgments
The authors thank Dr Hélène Ogier de Baulny for providing her great clinical expertise in the management of most of the patients.
References
- Received February 5, 2021.
- Accepted after revision April 19, 2021.
- © 2021 by American Journal of Neuroradiology


