
Abstract
BACKGROUND AND PURPOSE: Dorsal root ganglion MR imaging (MR gangliography) is increasingly gaining clinical-scientific relevance. However, dorsal root ganglion morphometry by MR imaging is typically performed under the assumption of ellipsoid geometry, which remains to be validated.
MATERIALS AND METHODS: Sixty-four healthy volunteers (37 [57.8%] men; mean age, 31.5 [SD, 8.3] years) underwent MR gangliography of the bilateral L4–S2 levels (3D-T2WI TSE spectral attenuated inversion recovery–sampling perfection with application-optimized contrasts by using different flip angle evolution, isotropic voxels = 1.1 mm³, TE = 301 ms). Ground truth dorsal root ganglion volumes were bilaterally determined for 96 dorsal root ganglia (derivation cohort) by expert manual 3D segmentation by 3 independent raters. These ground truth dorsal root ganglion volumes were then compared with geometric ellipsoid dorsal root ganglion approximations as commonly practiced for dorsal root ganglion morphometry. On the basis of the deviations from ellipsoid geometry, improved volume estimation could be derived and was finally applied to a large human validation cohort (510 dorsal root ganglia).
RESULTS: Commonly used equations of ellipsoid geometry underestimate true dorsal root ganglion volume by large degrees (factor = 0.42–0.63). Ground truth segmentation enabled substantially optimizing dorsal root ganglion geometric approximation using its principal axes lengths by deriving the dorsal root ganglion volume term of  . Using this optimization, the mean volumes of 510 lumbosacral healthy dorsal root ganglia were as follows: L4: 211.3 (SD, 52.5) mm³, L5: 290.7 (SD, 90.9) mm³, S1: 384.2 (SD, 145.0) mm³, and S2: 192.4 (SD, 52.6) mm³. Dorsal root ganglion volume increased from L4 to S1 and decreased from S1 to S2 (P < .001). Dorsal root ganglion volume correlated with subject height (r = . 22, P < .001) and was higher in men (P < .001).
CONCLUSIONS: Dorsal root ganglion volumetry by measuring its principal geometric axes on MR gangliography can be substantially optimized. By means of this optimization, dorsal root ganglion volume distribution was estimated in a large healthy cohort for the clinically most relevant lumbosacral levels, L4–S2.
ABBREVIATIONS:
- DRG
- dorsal root ganglion
- DRGvol
- dorsal root ganglion volume
- DRGvol (r)
- real dorsal root ganglion volume
The dorsal root ganglia (DRGs) are embedded in the posterior spinal nerve root and contain the cell somata of all primary afferent sensory neurons.1 DRGs are located within or laterally adjacent to the intervertebral neural foramina and represent an interface between the peripheral nervous system and CNS, participating in somatosensory and pain-signal processing. The DRG is increasingly coming into focus as a therapeutic target for interventional pain therapy by local electrical neuromodulation.2,3 These procedures would benefit from direct imaging determination of local DRG anatomy and morphometry.
MR neurography allows the improved imaging resolution of peripheral nerves down to their fascicular level and has the capability of deriving novel quantitative estimates of microstructural integrity.4,5 MR gangliography is an extension of MR neurography and detects the DRG contour, which is challenging because the DRG shape is highly variable. The first observations of DRG volume by MR gangliography were promising by revealing surprisingly strong clinical-radiologic associations between disease phenotypes and pathologically altered DRG volume.6⇓⇓⇓-10 As a result, DRG volume (DRGvol) as estimated in vivo by MR gangliography has emerged as a promising novel disease marker in pain research and for studying pain already at the peripheral nervous system level where most pain syndromes originate.11 Already, DRGvol is serving as a novel biomarker in schwannomatosis,7 oxaliplatin-induced painful sensory polyneuropathy,8 Fabry disease,9 and diabetic polyneuropathy.10 To reliably measure, reproduce, and compare DRGvol in larger cohorts and to be able to also reliably detect smaller degrees of volume change, validation of DRG morphometry by MR imaging is required, which so far is lacking.
Specifically, it is a prerequisite for future research to validate whether true DRGvol can be estimated with sufficient accuracy by approximation using measurements of the principal geometric axes of the DRG. Finally, the variation of DRGvol between individuals and over spinal segments in a larger representative healthy human cohort would be of interest. Because automated quantitative volumetric 3D analysis of DRGvol is not yet feasible, DRGvol so far has usually been estimated by calculations using the manually determined maximal diameters in coronal (A), axial (B), and sagittal (C) reformations. These parameters were then heuristically used to fill the typical equation of a perfect geometric ellipsoid body ( ). Even stronger simplifications of this equation were adopted to further enhance the ease of use for scientific or clinical purpose.12⇓-14
We hypothesized that the assumption of the DRG as a perfect ellipsoid represents an oversimplification, which would render volumetric estimates substantially inaccurate. This hypothesis is supported by known anatomic observations describing a vast variety in DRG morphologic shapes and also peculiar variations such as biganglia or even tri- or multipartite ganglia.15 These challenging variations of basic DRG anatomy have only now, with the application of 3D isotropic MR gangliography such as proposed here, become observable and measurable in a reliable manner.
MATERIALS AND METHODS
Study Design
This investigation was designed as a prospective study consisting of 3 consecutive parts.
Part 1: Ground truth segmentation and volumetry (derivation/training cohort)
Part 2: Observation of ground truth deviation from ellipsoid body geometry (derivation/training cohort)
Part 3: Optimization with determination of DRGvol and variations in an independent, large cohort of healthy subjects (validation cohort).
Ethics approval was obtained from the ethics committee of the University of Würzburg (89/19-me). All healthy participants provided written informed consent.
Participants
Sixty-four healthy volunteers without any previously known neurologic diseases were recruited, regardless of any other restriction or requirement (37 [57.8%] men; mean age, 31.5 [SD, 8.3] years). For our derivation cohort, 12 healthy volunteers (7 [58.3%] women; mean age, 25.9 [SD, 3.5] years) of the overall cohort underwent MR gangliography of the bilateral L4–S2 levels.
Imaging Protocol
All MR gangliography examinations were conducted on the same MR imaging 3T scanner (Magnetom Prisma Fit; Siemens) between April 2019 and October 2020 at our facility. All participants underwent MR imaging, including using a high-resolution 3D T2WI FSE sequence (sampling perfection with application optimized contrasts by using different flip angle evolution [SPACE]) with spectral fat saturation of the lumbosacral plexus and spine (scanning parameters: FOV = 300 × 295 × 106 mm³, voxel size = 1.1 × 1.1 × 1.1 mm³, ΔTE = 4.4 ms, TE = 301 ms, TR = 2000 ms). The imaging slab was aligned perpendicular to the L4 vertebral body.
Image Analysis
DRGs were analyzed using the MERLIN Diagnostic Workcenter (Phoenix-PACS) and FSLeyes (McCarthy, Paul; http://doi.org/10.5281/zenodo.3937147).
Part 1.
The derivation cohort was chosen as a representative sample group with a balanced sex and age ratio from the total cohort. Ground truth estimation was performed by voxel-based volumetric analysis for 96 DRGs (L4: 24, L5: 24, S1: 24, S2: 24) by 3 expert raters. Real DRGvol (DRGvol [r]) was defined as the mean average value over the ground truth results from the 3 independent expert raters with at least 4 years of neuroradiology and image analysis experience. Furthermore, the principal geometric axes (axial, coronal, sagittal) were also measured in the same fashion using 3D reformations in these standard anatomic orientations (Online Supplemental Data). Axial, coronal, and sagittal section orientations were aligned with the principal axes of each DRG in anatomic space.
Part 2.
DRGvol (r) was then compared with the most frequently used approximations of DRGvol under the basic assumption of ellipsoid geometry (Equations 1–4, [e1–e4]).12⇓-14 We tested the following 6 equations:
Existing equations
 1)
1)
 2)
2)
 3)
3)
 4)
4)
Novel equations
5) Because Equations 1–4 represent the same model:
 we adapted this model for the new Equation 5 (e5) on the basis of this design by linear least squares approximation. DRGvol (e5) was calculated for the 96 DRGs.
6) Furthermore, we extended the existing linear model by adding an intercept to reflect the true volume more accurately. The geometric reason for this intercept is that an ellipse tapers substantially at its proximal and distal ends, in contrast to the real DRG, which does not merge in a pointlike fashion into the adjacent nerve but connects to it over a broader area (Online Supplemental Data). As the simplest approximation, this missing offset volume can be set as a constant, which is represented by this intercept added to the equation. The design of Equation 6 was DRGvol = DRGvol (e6) was calculated for the 96 DRGs.
Part 3.
The principal axes of 510 DRGs (L4: 128, L5: 128, S1: 128, S2: 126) of 64 healthy participants were measured according to Part 1, and DRGvol (e6) =  was obtained by linear least squares regression. Additionally, the length of the nerve roots (defined as the takeoff from the thecal sac to the proximal pole of DRG) and the takeoff the angle of the nerve roots in the coronal plane were measured to incorporate information from local anatomy.
For 1 participant, measurements for both DRGs of level S2 were not possible because of numerous cystic variations along the DRG. These 2 DRGs of level S2 were treated as missing values.
Statistical Analysis
Statistical analyses were performed using SPSS Statistics, Version 26 (IBM). All results were documented as mean (SD) and 95% confidence intervals. The Wilcoxon signed-rank test and Mann-Whitney U test were performed to compare the differences between 2 dependent/independent samples, respectively. Statistical dependence between the rankings of the 2 variables was tested using the Spearman rank correlation coefficient. Interrater reliability was examined using the intraclass correlation coefficient. Bland-Altman plots and intraclass correlation coefficients (2-way mixed, single measures, consistency) were used to compare 2 different methods of volumetric calculation. Correction coefficients and intercepts for improved DRGvol calculation were obtained by linear regression analysis. Probability values of < .05 were considered significant. Adjustment of P values for multiple testing was made using the Bonferroni-Holm method. Data visualization was performed using Amira 2020.2 (Thermo Fisher Scientific).
RESULTS
Anthropometric Data
Sixty-four healthy subjects (women: 27 [42.2%]; men: 37 [57.8%]) participated in the study. The mean age was 31.5 (SD, 8.3) years; range, 19–63 years; mean height, 177.0 (SD, 9.4) cm; mean weight, 76.3 (SD, 14.7) kg; and mean body mass index, 24.2 (SD, 3.7) kg/m2. The mean height of the 27 female subjects was 169.4 (SD, 7.2) cm; the mean weight of the female subjects was 66.8 (SD, 12.1) kg; and the mean body mass index of the female subjects was 23.3 (SD, 4.3 kg/m2). The mean height of the 37 male subjects was 182.6 (SD, 6.5) cm; the mean weight of the male subjects was 83.2 (SD, 12.5) kg; and the mean body mass index of the male subjects was 24.9 (SD, 3.1) kg/m2. Parts 1 and 2 of the study were limited to 12 randomly chosen healthy participants (women: 7/58.3%; men: 5/41.7%). The mean age of these 12 participants was 25.9 (SD, 3.5) years; range, 20–34 years. The mean height was 170.8 (SD, 6.7) cm; the mean weight was 66.08 (SD, 6.9) kg; and the mean body mass index was 22.8 (SD, 3.3) kg/m2.
Part 1.
The intraclass correlation coefficient for volumetric determination based on voxelwise segmentation among the 3 raters was .84. The mean of 3 raters’ voxelwise segmentation of 96 DRGs was defined as DRGvol (r) and showed mean DRG volumes of 202.3 (SD, 64.1) mm³ for L4, 299.7 (SD, 91.9) mm³ for L5, 421.0 (SD, 243.5) mm³ for S1, and 197.2 (SD, 80.7) mm³ for S2. The DRGvol (r) was significantly higher for S1 compared with L5 and for L5 compared with L4 (P < .001, respectively). The analysis showed a significant correlation between height and DRGvol (r) (Spearman correlation coefficient = 0.38, P < .001). The DRGvol (r) of male subjects was significantly higher than the DRGvol (r) of female subjects (P < .001). The Online Supplemental Data show a more detailed overview of DRGvol (r) values.
Part 2.
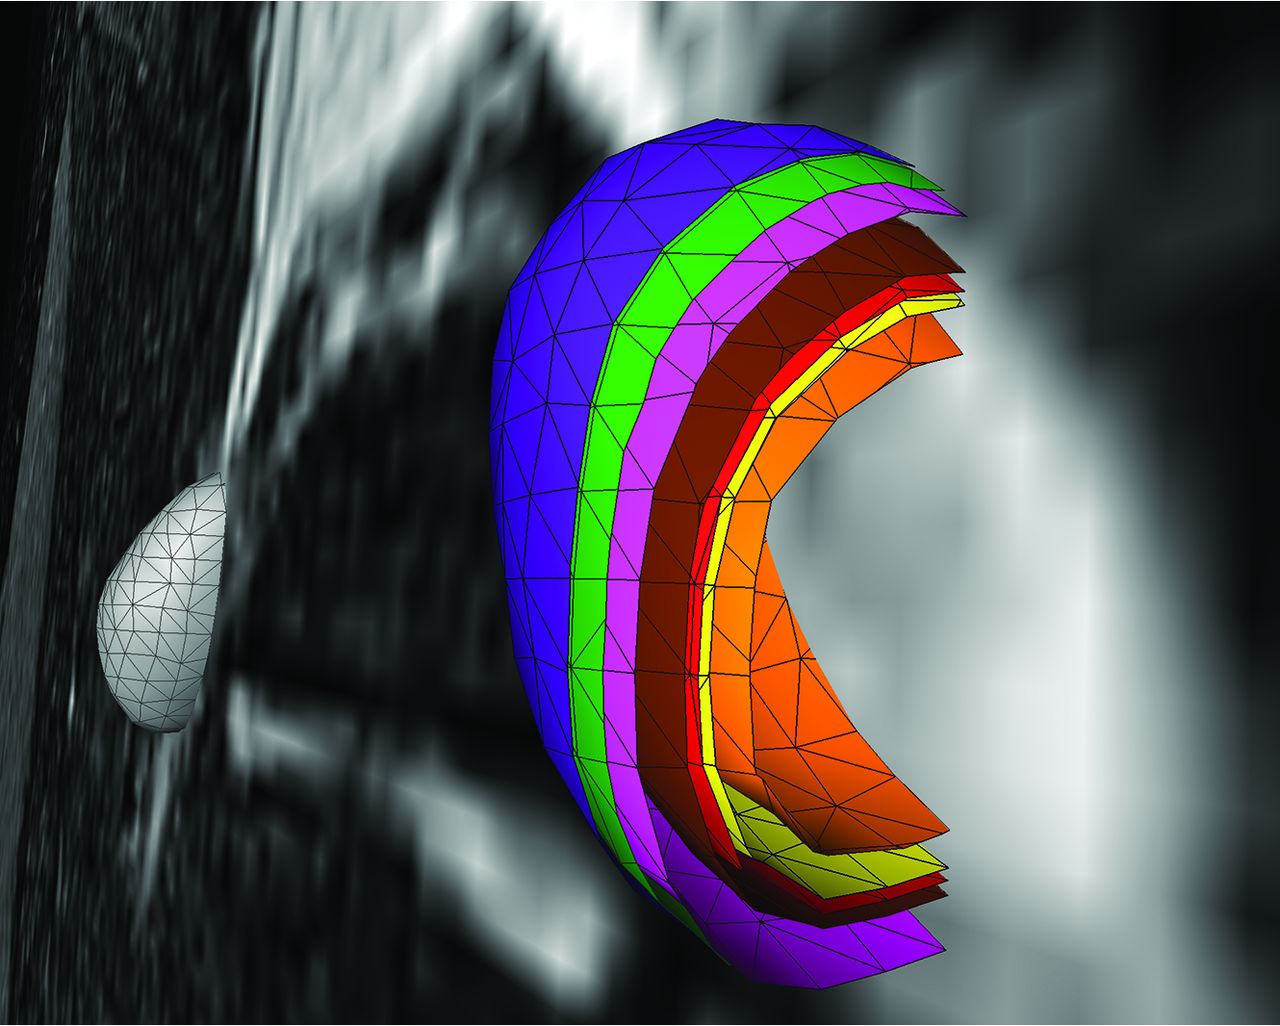
The principal geometric axes of the 96 DRGs were measured in sagittal, coronal, and axial image reformations (Online Supplemental Data) and were used to calculate the estimated DRGvol from the existing equations DRGvol (e1) to DRGvol (e4), respectively. Data are summarized in the Online Supplemental Data. Compared with DRGvol (r), all tested approximating equations showed an underestimation of DRGvol (Fig 1 and Online Supplemental Data). Equation 1 turned out to be the best-fitting approximation, showing a mean underestimation of 42.3%. The other equations showed a mean underestimation among 44.9% (e2), 54.1% (e4), and 63.3% (e3). The different results of DRGvol are visualized in Fig 2.

Evaluation of 6 equations (e1–e6) for estimating DRG volume: Boxplots show deviation of estimated DRGvol (e1–e6) from ground truth volume (DRGvol (r) by calculating the quotient of estimated volume and ground truth volume. The closest approximation to ground truth was attained for Equation 6 (DRGvol [e6], far right): =  . The top of the box represents the 75th percentile, the bottom of the box represents the 25th percentile. The line in the middle represents the 50th percentile (median). The whiskers represent the 5th and 95th percentiles, and values beyond the lower and upper bounds represent outliers and extreme values.

Colored 3D and surface volume-rendered and volume cut visualization of the volumetric results of the 6 different equations for estimation of ipsilateral DRG volume. The green shell represents the ground truth voxelwise segmentation result, DRGvol (r). The purple shell just at and very close to the outside of the ground truth shell (green) corresponds to the best optimization result, which was obtained from the new Equation 6, including an intercept, only slightly overestimating voxelwise ground truth segmentation. The pink shell just at the inside of the green shell corresponds to the new and second-best-performing Equation 5, without an intercept, slightly underestimating DRGvol (r). These 2 equations have provided the best results for estimating DRGvol. For the purpose of visualization, the shells of these 2 optimized equations are slightly offset to allow macroscopic differentiation of the small differences. Significant underestimation of volume was observed for commonly used equations e1–e4; (brown = e1, red = e2, orange = e3, and yellow = e4. The contralateral DRG is surface volume-rendered in gray).
To correct the calculations to the best fitting coefficient for DRGvol (r), we performed linear regression analysis of DRGvol (r) without an intercept. The resulting Equation 5, DRGvol (e5) =  , was used to calculate DRGvol (Equation 5), which is shown in the Online Supplemental Data. The intraclass correlation coefficient between DRGvol (r) and DRGvol (e5) was 0.95.
An extended model for a linear regression analysis with an intercept of DRGvol (r) was performed and resulted in equation Equation 6: DRGvol (e6) =  . DRGvol (e6) was calculated for the 96 DRGs, which is shown in the Online Supplemental Data. The intraclass correlation coefficient between DRGvol (r) and DRGvol (e6) was .95. The comparison between the results of the 2 fitted equations, once with and once without an intercept, is shown in Fig 1 and in the Online Supplemental Data. Figure 3 shows the comparison between the manually segmented ground truth DRGvol (r) and the best ellipsoidal approximation of DRGvol derived from Equation 6. Even though DRGs are not geometrically perfect ellipsoidal objects, both an accurate volumetric approximation and a purely visual, geometric approximation of DRG shape are possible.

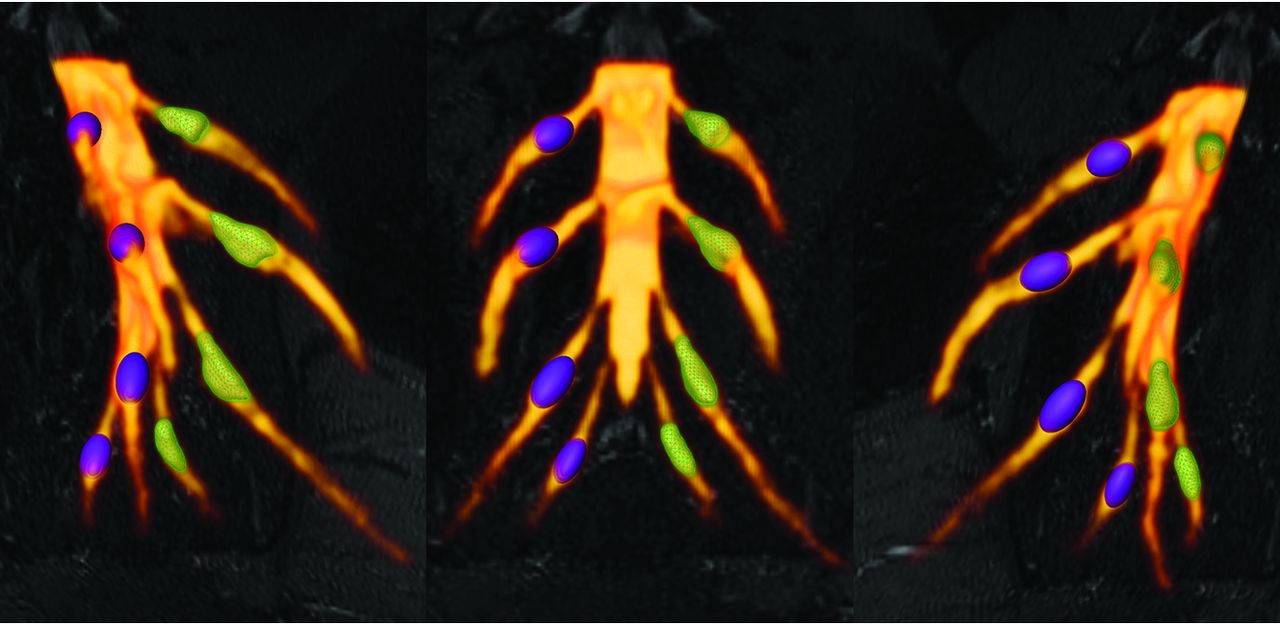
Comparative DRG volume-rendered visualization of ground truth volume DRGvol (r) versus best estimated volume by DRGvol (e6). Left: right-anterior-oblique plane. Middle: frontal plane. Right: left-anterior-oblique. Purple DRGs on the right side with smooth surfaces correspond to estimated volumes using Equation 6 for the most accurate approximation. Green DRGs on the left side with mesh surface correspond to ground truth volumes from expert manual segmentation and contour locations.
Part 3.
The volume of 510 DRGs from level L4 to S2 of 64 healthy volunteers was calculated using Equation 6. Values for mean diameters A, B, and C of the DRG were determined, and estimated volumes DRGvol (e6) are summarized in the Online Supplemental Data. DRGvol increased significantly from L4 to S1 and decreased significantly from level S1 to S2 (P < .001, respectively) as shown in Fig 4. There is a significant correlation between the subject’s height and DRGvol (e6) (Spearman correlation coefficient = 0.22, P < .001). DRGvol (e6) of male subjects was significantly higher than DRGvol (e6) of female subjects (P < .001).

Boxplot of DRGvol (e6) showing the DRGvol (cubic millimeters) for the different lumbosacral heights L4–S2. Equation 6 (DRGvol, e6) provided the best approximation to ground truth. By means of this equation, these boxplots display human MR imaging DRG morphometry over the clinically most relevant segments, L4–S2, in a large validation cohort (n = 510). The top of the box represents the 75th percentile; the bottom of the box represents the 25th percentile. The line in the middle represents the 50th percentile (median). The whiskers represent the 5th and 95th percentiles, and values beyond the lower and upper bounds represent outliers and extreme values. Significances are marked with asterisks (indicating P < . 0001).
The mean values for the nerve root takeoff angle from the dural sac in coronal reformations decreased from level L4 (37.9° [SD, 9.0°]) over levels L5 (35.5° [SD, 8.0°]) and S1 (22.8° [SD, 6.4°]) to level S2 (17.4° [SD, 5.0°]). The mean values for nerve root lengths increased from level L4 (9.2 [SD, 2.1] mm) over levels L5 (13.0 [SD, 2.9] mm) and S1 (14. 6 [SD, 4.0] mm) to level S2 (16.5 [SD, 4.4] mm). Data of nerve root takeoff angles and lengths are summarized in the Online Supplemental Data.
DISCUSSION
We demonstrate that common methods for MR imaging–based DRG volumetry, which, until now, have been grounded on the assumption of simple ellipsoid geometry, substantially underestimate true DRG volume (observed factor of underestimation: 0.42–0.63). Moreover, we demonstrated how to optimize geometric equations for substantially more accurate DRG volume estimation.
Increasing attention to the DRG within the fields of pain research and pain medicine has been paralleled by methodologic progress in human DRG imaging. In particular, recent progress by structural and functional advances in MR gangliography stand out.6⇓-8,16 The DRG microstructure consists of a cell body–rich area, which is oriented toward the DRG rim and is embedded in a uniquely dense microvascular network.17 With more central topography, a nerve fiber–rich area is located within the DRG.17 Pathophysiologic changes in 1 or both compartments are associated with DRGvol change. DRGvol is, therefore, an innovative and novel biomarker promising to become clinically and scientifically useful for a variety of diagnostic and research questions, particularly in the field of pain research, because most pain syndromes originate at the peripheral level of the nervous system.11 In pain and somatosensory afferent signal processing, the DRG organ represents the interface between the peripheral and central nervous systems. Also in the context of degenerative or traumatic processes, the imaging observation of DRGvol seems valuable because it correlates strongly with the number of DRG sensory neurons, allowing conclusions about local neurodegeneration and loss of neurons.18 For example, changes in the quantity of neurons could be observed in experimental diabetes models with a loss of large DRG neurons that, on a functional level, was associated with slowed sensory nerve conduction velocity.19 Another example in which the DRGvol decrease reflects DRG neurodegeneration is Friedreich ataxia. In this disease, severe neurologic deficits are tightly associated with hypoplasia of the DRG neurons, which translates into decreased DRGvol on the macrostructural level.20
The imaging methodical key to substantially improve the accuracy of DRG morphometry by MR gangliography is to increase the resolution and contrast of the DRG and of its local vicinity using high-resolution isotropic voxels. The MR imaging signal is heavily T2-weighted with efficient fat suppression as an established contrast for MR gangliography and MR neurography.21 In this study, the principal protocol component of MR gangliography was an optimized 3D isotropic fast spin-echo sequence (SPACE). It improved the sharp-edged contrast between the DRG contour and surrounding tissue. It visualized more accurately the distinctive shape and contour of the DRG itself and, most important, differentiated it more accurately than possible before, in particular from the proximally and distally adjacent segments of the posterior nerve root.
In this study, the ground truth of DRGvol (r) was obtained as a volume average from extensive voxelwise manual segmentation of 96 single DRGs across a total of 1152 slices by 3 independent expert raters. Interrater reliability among the 3 blinded raters was good22 to very good.23 These ground truth DRG volumes confirm, in vivo and in humans, the previously reported ex vivo studies showing a continuous increase of DRGvol toward the caudal region (L4–S1) with continuous decrease towards the sacral level.24 The DRGs of levels L5 and S1 were significantly more voluminous compared with other vertebral heights. This finding represents the main reason why these 2 functionally important DRG levels can be proposed as index levels to investigate disease-related DRGvol alterations. Finally, these findings were further validated in the largest human cohort so far observed for DRG volume estimation (510 DRGs).
To substantially optimize DRGvol estimation, we tested several equations of ellipsoid body volume against ground truth. In the selection of equations, we applied the following rationale: Model-based approximation of disease target lesions or organ volumes is widely used to facilitate radiologic measurements, eg, for tumor volume estimation. The equation that is typically used for such purposes delivers volume estimation from standard diameter lengths and is typically represented by the term ( ). This term was first described by Kwak et al,13 and it has been verified by Lisk et al25 and found wider establishment through the work of Kothari et al12 as well as Kazui et al.26 It represents a simplification of the complete term of ellipsoid volume, which is
  because
π can be simply approximated to 3. In this pragmatic form, it is widely and easily used as a very simple tool for fast linear measurements that are practically available in virtually every PACS. In contrast, more accurate volume estimation requires fundamental understanding of the target structure shape, is not easily incorporated into PACS, and is considerably more time-consuming. However, more accurate volume estimation can also be relevant clinically as it has been shown by using the example of vestibular schwannoma volume estimation to detect changes earlier.27⇓-29 Also for intracerebral hemorrhage, it was shown that simple volume approximations may substantially overestimate true hemorrhage volume by as much as 45%.30
because
π can be simply approximated to 3. In this pragmatic form, it is widely and easily used as a very simple tool for fast linear measurements that are practically available in virtually every PACS. In contrast, more accurate volume estimation requires fundamental understanding of the target structure shape, is not easily incorporated into PACS, and is considerably more time-consuming. However, more accurate volume estimation can also be relevant clinically as it has been shown by using the example of vestibular schwannoma volume estimation to detect changes earlier.27⇓-29 Also for intracerebral hemorrhage, it was shown that simple volume approximations may substantially overestimate true hemorrhage volume by as much as 45%.30
In the case of the DRG, so far, volumetry has been mainly derived from measurements of its maximum diameter in only 1 or 2 planes.24,31 Only a few studies performed more detailed measurements in which maximum diameters6,7 were determined in 3 orthogonal planes to estimate DRGvol by the typical simplified ellipsoid equation: DRGvol =  , which corresponded to Equation 2 in this study. Equation 1 of this study represented the mathematically precise equation for a perfect ellipsoidal body (
 ). Equations 2, 3, and 4 corresponded to different simplifications of this formula, which have been used in prior research.14 All of these 4 existing equations to estimate DRGvol (e1–e4) led to considerable underestimation of DRGvol in this study compared with ground truth DRGvol (r) (observed factor of underestimation: 0.42–0.63).
According to a prior study on volumetry of the kidneys,32 we performed linear regression of DRGvol (r) without and with the intercept and used the resulting regression equations to derive equations DRGvol (e5) and DRGvol (e6), which were substantially more accurate. The best approximation was achieved for DRGvol (e6) =  . It unifies both the rapidity of measurement and very high accuracy compared with the ground truth. Equation 6, with its additional intercept, also better accounts for nonellipsoid variation in DRG shape, such as the more tubular shape that regularly applies especially to smaller DRGs that are more closely aligned with the posterior nerve root. The performance of all tested equations relative to ground truth is visualized by Fig 2 using cut volume shells.
In the final part of our study, Equation 6, which provided the best approximation (cut purple versus green volume shell in Fig 3), was applied to the largest human DRG cohort so far investigated volumetrically, to the best of our knowledge. In addition, our study also analyzed nerve root length, measured from the origin of the dural sac to the onset of the ellipsoidal structure of the DRG, as well as their angulation relative to the DRG, showing a significant decrease in the root angles from lumbar to sacral. The length of the nerve root, on the contrary, increased continuously from lumbar to sacral (L4–S2). These results, for the most part, correspond closely to a cadaver study of DRG length and root angulation.33
To be able to also observe more subtle therapy or disease-specific changes of DRGvol in larger cohorts in the future, a more accurate assessment and normative reference values of DRGvol are needed and are both provided by this study. Already in the recent past, MR gangliography could show promising results in the observation of disease-related volume change, for example in chemotoxic polyneuropathy, painful diabetic polyneuropathy, and Fabry disease.7,9,10
Our study comes with the following limitations: Imaging coverage had to be limited to the lower spine. Our findings may not be transferrable to the cervical or thoracic spine where significant heart motion or lung- and breathing-related artifacts would have to be considered. At these other levels, other intercepts might have to be used to obtain accurate estimates given the slightly different geometric shape of these DRGs. Our observations were made in a large cohort of healthy subjects. Accuracy might be compromised if DRG shape is grossly altered by disease, which, however, seems unlikely, especially during the early disease course, which represents the typical stage of clinical-scientific focus.
Although rare, there remain anatomic variations such as arachnoid or dural cysts that may involve the proximal nerve roots and, in extreme cases, the DRG. These extreme-but-rare variations will continue to complicate the delineation of DRG boundaries in a few cases.
Finally, and obviously, full automation of DRG morphometry and volumetry need to be long-term goals. This seems achievable through the use of machine learning and/or artificial neural networks. Still, the application of equation-based 3D DRG volume estimation methods to larger cohorts as investigated here will certainly be needed as training datasets for this future purpose of automated image processing and analysis.
CONCLUSIONS
DRGvol is a promising novel imaging biomarker in the fields of pain research and peripheral nervous system–related diseases. Existing ellipsoid-based equations for estimation of DRGvol substantially underestimate true DRGvol to a large degree. The following fitted equation could be derived and validated to avoid underrating DRGvol:  .
.
Footnotes
This work was funded by the German Research Foundation (255156212-SFB 1158) and the University of Würzburg, IZKF Project F-405.
Disclosure forms provided by the authors are available with the full text and PDF of this article at www.ajnr.org.
Indicates open access to non-subscribers at www.ajnr.org
References
- Received October 28, 2021.
- Accepted after revision February 12, 2022.
- © 2022 by American Journal of Neuroradiology


