Abstract
BACKGROUND AND PURPOSE: Whether gray matter impairment occurs in neuromyelitis optica is a matter of ongoing debate, and the association of gray matter impairment with cognitive deficits remains largely unknown. The purpose of this study was to investigate gray matter volume reductions and their association with cognitive decline in patients with neuromyelitis optica.
MATERIALS AND METHODS: This study included 50 patients with neuromyelitis optica and 50 sex-, age-, handedness-, and education-matched healthy subjects who underwent high-resolution structural MR imaging examinations and a battery of cognitive assessments. Gray matter volume and cognitive differences were compared between the 2 groups. The correlations of the regional gray matter volume with cognitive scores and clinical variables were explored in the patients with neuromyelitis optica.
RESULTS: Compared with healthy controls (635.9 ± 51.18 mL), patients with neuromyelitis optica (602.8 ± 51.03 mL) had a 5.21% decrease in the mean gray matter volume of the whole brain (P < .001). The significant gray matter volume reduction in neuromyelitis optica affected the frontal and temporal cortices and the right thalamus (false discovery rate correction, P < .05). The regional gray matter volumes in the frontal and temporal cortices were negatively correlated with disease severity in patients with neuromyelitis optica (Alphasim correction, P < .05). Patients with neuromyelitis optica had impairments in memory, information processing speed, and verbal fluency (P < .05), which were correlated with gray matter volume reductions in the medial prefrontal cortex and thalamus (Alphasim correction, P < .05).
CONCLUSIONS: Gray matter volume reduction is present in patients with neuromyelitis optica and is associated with cognitive impairment and disease severity in this group.
ABBREVIATIONS:
- BLV
- brain lesion volume
- EDSS
- Expanded Disability Status Scale
- GMV
- gray matter volume
- HC
- healthy control
- NMO
- neuromyelitis optica
- NMO-IgG
- neuromyelitis optica immunoglobulin G
- pr
- partial correlation coefficient
Neuromyelitis optica (NMO) is an idiopathic, severe, demyelinating disease of the central nervous system that is characterized by optic neuritis and myelitis.1,2 Although the brain is traditionally considered to be spared in NMO,3 recent studies have identified brain lesions in 60% of patients with this condition.4 In 10% of patients with NMO, the site of brain lesions on MR imaging coincides with high concentrations of the water channel aquaporin 4,5,6 the target of NMO immunoglobulin G (NMO-IgG).
Although several investigations have revealed gray matter impairment in NMO by comparing intergroup differences in the regional homogeneity,7 amplitude of low-frequency fluctuation,8 diffusivity,9⇓–11 perfusion,12 and magnetization transfer ratio,13 whether GM structural impairment is a feature of NMO is an ongoing debate. Several studies have identified reductions in GM volume (GMV)14⇓–16 or cortical thickness17 in patients with NMO; however, 3 additional studies have failed to demonstrate reductions in the GMV18,19 or cortical thickness in patients.20 These conflicting outcomes may result from the low statistical power of the relatively small sample sizes (15–30 patients with NMO in previous studies). Studies with a large sample of patients with NMO may help clarify this issue.
Cognitive impairment has been repeatedly reported in patients with NMO10,17,18,21⇓⇓–24 and is characterized by deficits in multiple cognitive domains, including memory, attention, and speed of information processing. The neural correlates of the cognitive impairment in NMO have been attributed to focal reductions in white matter volume and integrity.10,18 A recent study found no correlation between cognitive impairment and cortical thinning in 23 patients with NMO.17 However, it remains unknown whether GMV reduction is associated with cognitive impairment in these patients.
By recruiting a large sample of patients with NMO (n = 50), we aimed to clarify the GMV changes in NMO and the correlations of GMV changes with cognitive impairment and clinical variables in these patients.
Materials and Methods
Subjects
Fifty right-handed patients with NMO and 50 sex-, age-, handedness-, and education-matched healthy controls (HCs) were included (Table 1). All patients were enrolled from a single center (Department of Neurology, Tianjin Medical University General Hospital) by using a data base for patients with NMO who had visited our hospital for treatment during the past 5 years. During the recruitment phase, we invited these patients to return to our hospital to participate in this experiment. On accepting the invitation, they would be subjected to a series of screening procedures to confirm whether they met the inclusion criteria. The healthy controls were recruited by advertisements from the local community. The inclusion criteria for both patients and controls were age (18–70 years) and right-handedness. All patients also fulfilled the revised Wingerchuk diagnostic criteria for NMO,1 including the 2 absolute criteria of optic neuritis and acute myelitis and at least 2 of the following 3 supportive criteria: brain MR imaging findings negative or nondiagnostic for multiple sclerosis at onset, MR imaging evidence of a spinal cord lesion involving ≥3 vertebral segments, and a positive serologic test for NMO-IgG. The diagnostic basis for each patient with NMO is shown in On-line Table 1. The exclusion criteria for both patients and controls were the following: 1) contraindications against MR imaging; 2) serious visual, auditory, or motor impairment that would influence cognitive tests; 3) history of head trauma or other neuropsychiatric diseases; and 4) poor imaging quality (visible artifacts). Serum NMO-IgG was tested by using a cell-based assay with quantitative flow cytometry.25 The disease severity was assessed by the Expanded Disability Status Scale (EDSS) scores. All of the participants provided written informed consent that met the approval of the local Medical Research Ethics Committee, and the study was approved by the institutional review board.
Demographic and clinical characteristics of the subjectsa
Cognitive Assessment
A battery of cognitive tests was administered to all subjects by a professional psychologist within 1 month after the MR imaging examinations. The California Verbal Learning Test–Second Edition was used to assess verbal learning and memory function.26 In this test, immediate verbal memory was assessed by the Immediate Recall of Trial 2; short-delayed verbal memory was measured by the Short-Delay Free and Cued Recalls; and long-delayed verbal memory was evaluated by the Long-Delay Free and Cued Recalls. The Paced Auditory Serial Addition Tests were used to assess auditory processing speed and working memory.21 The Symbol Digit Technique Test was administered to measure visual spatial processing speed and working memory.21 The Controlled Oral Word Association Test was used to assess phonemic verbal fluency. The Wisconsin Card Sorting Test was used to evaluate executive function. A few subjects were excluded due to failure to complete some items of these cognitive tests, and the number of patients with NMO and HCs finally included in the cognitive-related analyses is displayed in On-line Tables 2–6.
MR Imaging Acquisition
MR imaging data were acquired by using a 3T MR imaging system (Discovery MR750; GE Healthcare, Milwaukee, Wisconsin). Tight but comfortable foam padding was used to minimize head motion; earplugs were used to reduce scanner noise. The T2-weighted images were acquired by using a fast spin-echo sequence with the following parameters: TR = 6816 ms; TE = 103 ms; flip angle = 142°; FOV = 240 × 240 mm; matrix = 512 × 512; section thickness = 6 mm; section gap = 1.5 mm; and 20 axial sections. Sagittal 3D T1-weighted images were acquired by a brain volume sequence with the following parameters: TR = 8.2 ms; TE = 3.2 ms; TI = 450 ms; flip angle = 12°; FOV = 256 × 256 mm; matrix = 256 × 256; section thickness = 1 mm; no gap; and 188 sagittal sections.
Analysis of Brain Lesions
Each brain lesion was identified by consensus of 2 neuroradiologists. According to the criteria of a prior study,4 the brain MR imaging presentation of each patient was classified into 4 categories: normal, nonspecific lesions, MS-like lesions, and atypical lesions. “MS-like lesions” were those that fulfilled the criteria of Barkhof et al27 for the diagnosis of multiple sclerosis. “Nonspecific lesions” were defined as deep white matter lesions with the following features: not ovoid, neither abutted nor perpendicular to the ventricles, or too few to fulfill the criteria of Barkhof et al for multiple sclerosis.4 “Atypical lesions” were defined as large confluent cerebral hemisphere lesions (>3 cm) and confluent diencephalic lesions (involving the thalamus and hypothalamus).4 The brain lesion volumes (BLVs) were independently measured by 2 neuroradiologists. For each patient, each brain lesion was manually outlined section by section on T2-weighted images by using the MRIcro software program (http://www.mccauslandcenter.sc.edu/mricro/mricron/index.html). The BLV of the patient was then automatically estimated by the product of the lesion area and section thickness. The mean value of the BLV of each patient from the 2 investigators was considered the BLV of this patient.
GMV Calculation
The GMV was calculated by using the Statistical Parametric Mapping package (SPM8; http://www.fil.ion.ucl.ac.uk/spm/software/spm8). The structural MR images were segmented into GM, white matter, and CSF by using the standard unified segmentation model. After an initial affine registration of the GM concentration map into the Montreal Neurological Institute space, the GM concentration images were nonlinearly warped by using the Diffeomorphic Anatomical Registration Through Exponentiated Lie Algebra technique28 and then were resampled to a voxel size of 1.5 × 1.5 × 1.5 mm3. The GMV of each voxel was obtained by multiplying the GM concentration map by the nonlinear determinants derived from the spatial normalization step. Finally, the GMV images were smoothed with a Gaussian kernel of 6 × 6 × 6 mm3 full width at half maximum. After spatial preprocessing, the normalized, modulated, and smoothed GMV maps were used for statistical analysis.
Statistical Analysis
First, a general linear model was implemented to compare differences in the cognitive scores between the NMO and HC groups by using SPSS 18.0 (IBM, Armonk, New York) (P < .05). Second, voxel-based comparisons were performed to identify the brain regions with significant group differences in GMV by using a 2-sample 2-tailed t test, and the multiple comparisons were corrected by using the false discovery rate method (P < .05). Third, voxel-based partial correlation analysis was performed to test the relationships of the GMV with clinical parameters and cognitive scores within brain regions that exhibited significant group differences in GMV in the patients with NMO, and the correlation between GMV and BLV was investigated in 37 patients with NMO with abnormal brain MR imaging findings. For these voxel-based correlation analyses, multiple comparisons were corrected by the Alphasim method (single voxel P = .01, 5000 simulations, full width at half maximum = 6 mm, cluster connection radius = 2.5 mm, within a significant GM mask, which resulted in a corrected threshold of P < .05 and a cluster size threshold of >33 voxels). Age, sex, and years of education were entered as covariates of no interest. BLV was also added as an additional nuisance covariate to explore whether it would affect the correlation between GMV and the cognitive test results.
Results
Demographic and Clinical Data of Subjects
Our sample included 50 patients with NMO (42 women and 8 men) and 50 HCs (43 women and 7 men) (Table 1). The mean age of the patients at the time of the study was 47.4 ± 13.4 years (range, 19–68 years). No significant differences were found in sex (χ2 = 0.078, P = .779), age (t = −1.055, P = .294), and years of education (t = −1.312, P = 0.192) between the 2 groups. Thirty-two of the 50 patients (64%) were seropositive for NMO-IgG. The mean onset age of the patients was 41.6 ± 14.1 years (range, 15–66 years). The mean number of relapses per year was 0.8 ± 0.7 (range, 0–4). The mean EDSS score was 3.8 ± 2.3 (range, 0–9). Neuromyelitis optica was monophasic in 4 cases and multiphasic in the other 46 cases, with a mean number of relapses of 4.5 ± 5.1 (range, 1–30). Five patients had other autoimmune diseases (Sjogren syndrome, n = 1; rheumatoid arthritis, n = 2; desmosis, n = 2), 6 patients had endocrinopathy (diabetes mellitus, n = 3; hypothyroidism, n = 2; hyperthyroidism, n = 1), and 1 patient had hyperthyroidism with scleroderma.
Thirty-seven (74%) of these 50 patients with NMO had abnormal brain MRI findings. Brain MRI was categorized into 4 subgroups according to the criteria of a prior study4: normal (13 patients, 26%), nonspecific lesions (6 patients, 12%), MS-like lesions (23 patients, 46%), and atypical lesions (8 patients, 16%). The mean BLV was 3.3 ± 5.1 cm3 (range, 0.02–18.67 cm3). Spinal cord MRI was collected at the initial diagnosis of the disease, and the results showed longitudinally extensive lesions (≥3 vertebral segments) on T2-weighted images in 47 of 50 patients (94%). The other 3 patients had a spinal cord lesion that involved fewer than 3 vertebral segments.
For each cognitive test, the sex, age, and years of education were matched (P > .05) between the patient and control groups (On-line Tables 2–6).
Group Differences in Cognitive Tests
The performance of neuropsychological tests is summarized in Table 2. Patients with NMO performed significantly worse on the Short-Delay Cued Recall (P = .030), Long-Delay Free (P = .017), and Cued (P = .007) Recalls of the California Verbal Learning Test–Second Edition, the Symbol Digit Technique Test (P = .018), and the Controlled Oral Word Association Test (P = .035) compared with the performance of the HCs. However, none of these differences was significant according to the Bonferroni correction (P < .05) for multiple comparisons. There were no significant differences in the Immediate Recall of Trial 2 (P = .075) and Short-Delay Free Recall (P = .176) of the California Verbal Learning Test–Second Edition, the Paced Auditory Serial Addition Tests (P = .152), and the Wisconsin Card Sorting Test (P = .245) between the 2 groups.
Neuropsychological tests for patients with NMO and healthy controlsa
Group Differences in the GMV
The GMV of the whole brain of patients with NMO (602.8 ± 51.03 mL) was significantly reduced compared with that of HCs (635.9 ± 51.18 mL) (P = .002). Compared with the HCs, patients with NMO had reduced GMV in the medial prefrontal cortex, the left inferior temporal gyrus, and the right thalamus (false discovery rate correction, P < .05) (Fig 1). No significantly increased GMV was found in patients with NMO.

Brain regions with GMV differences between patients with NMO and healthy controls (P < .05, false discovery rate correction). Blue represents significant GMV reductions in the patients with NMO. L indicates left; R, right.
Subgroup Differences in the GMV
On the basis of the combination of the 3 supportive criteria (NMO-IgG, brain MR imaging, and spinal MR imaging) for NMO, we further divided patients into 4 diagnostic subgroups: NMO-IgG + spinal MR imaging (n = 21); brain MR imaging + spinal MR imaging (n = 18); NMO-IgG + brain MR imaging (n = 3); and NMO-IgG + brain MR imaging + spinal MR imaging (n = 8). Because the sample sizes of the latter 2 groups were too small to perform intergroup comparisons, we only investigated voxel-based GMV differences between each of the first 2 subgroups and the HC group. Compared with the HC group, only the first NMO subgroup (NMO-IgG + spinal MR imaging) had a significantly reduced false discovery rate correction (P < .05). The distribution of brain regions with GMV reductions in this subgroup (On-line Fig 1) was similar in the total patient population (Fig 1). However, we did not find any significant GMV differences between the second NMO subgroup (brain MR imaging + spinal MR imaging) and the HC group.
For each patient with NMO, we also extracted GMV values of brain regions that exhibited significant GMV reductions in the total patient population (Fig 1). Then, we used a 2-sample t test to compare the GMV differences in these regions between each NMO subgroup and the HC group. We found that both NMO subgroups (NMO-IgG + spinal MR imaging and brain MR imaging + spinal MR imaging) exhibited significantly reduced GMVs in all of these regions (Bonferroni correction, P < .05) (On-line Fig 2).
Correlation between the GMV and Clinical Parameters
Correlations between the GMV and clinical variables in the patients with NMO are shown in Fig 2. In the patients with NMO, the EDSS scores had a negative correlation (Alphasim correction, P < .05) with the GMV in the left inferior temporal gyrus (partial correlation coefficient [pr] = −0.500, P < .001) and the right medial prefrontal cortex (pr = −0.465, P = 0.001). No significant positive correlation between the GMV and EDSS scores was found in the patients with NMO. No significant correlations were observed for the relapsing frequency, disease duration, onset age, and GMV.

Correlations between the GMV and clinical variables in patients with NMO. The left column shows brain regions where the GMV is correlated with EDSS scores (Alphasim correction, P < .05). The right column shows scatter diagrams of these correlations. ITG indicates inferior temporal gyrus; MPFC, medial prefrontal cortex.
Correlation between the GMV and Cognitive Scores
Correlations between the GMV and cognitive scores are shown in Fig 3. Voxel-based analysis revealed that the patients with NMO had a significantly positive correlation (Alphasim correction, P < .05) between the Immediate Recall of Trial 2 and the GMV of the medial prefrontal cortex (pr = 0.563, P < .001). The Long-Delay (pr = 0.420, P = 0.005) and Short-Delay (pr = 0.401, P = .007) Free Recalls also had positive correlations with the GMV of the right thalamus. These cognitive scores did not show any negative correlations with the regional GMV in patients with NMO. No significant correlations were observed between other cognitive scores and the GMV. Even after further controlling for the effect of BLV, these correlations remained significant (Fig 3).
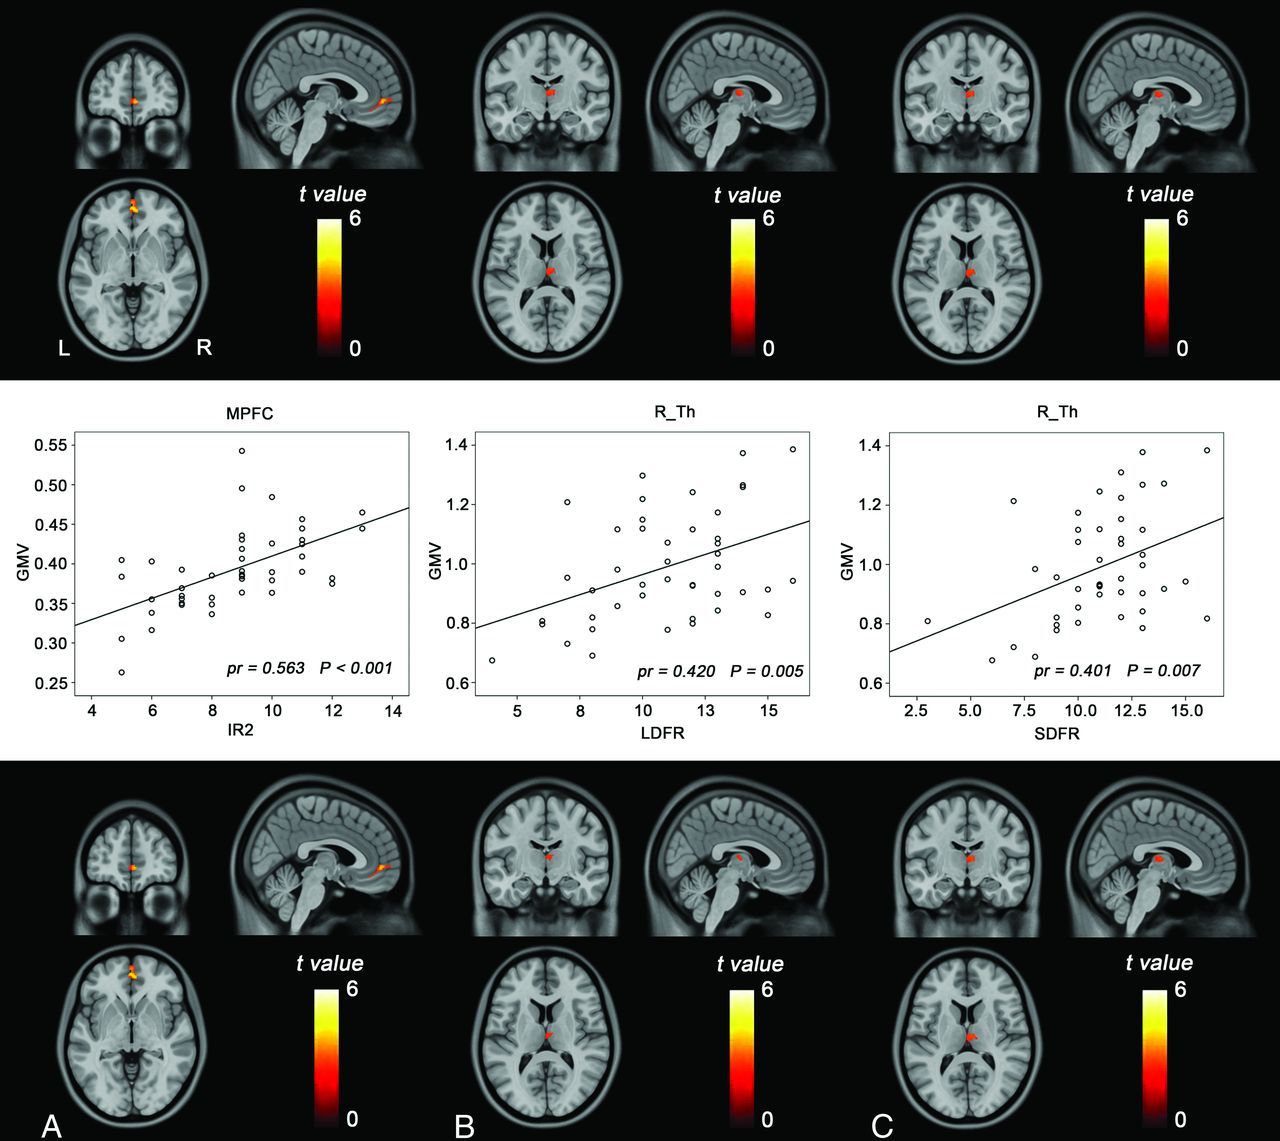
Correlations between the GMV and cognitive scores in patients with NMO. The upper row shows brain regions where the GMV is correlated with cognitive scores (Alphasim correction, P < .05). The middle row shows scatter diagrams of these correlations. The lower row shows brain regions where the GMV is correlated with cognitive scores after further controlling for the brain lesion volume. Immediate recall of Trial 2 (A), long-delay free recall (B), and short-delay free recall (C). MPFC indicates medial prefrontal cortex; R_Th, right thalamus.
Correlation between the GMV and BLV
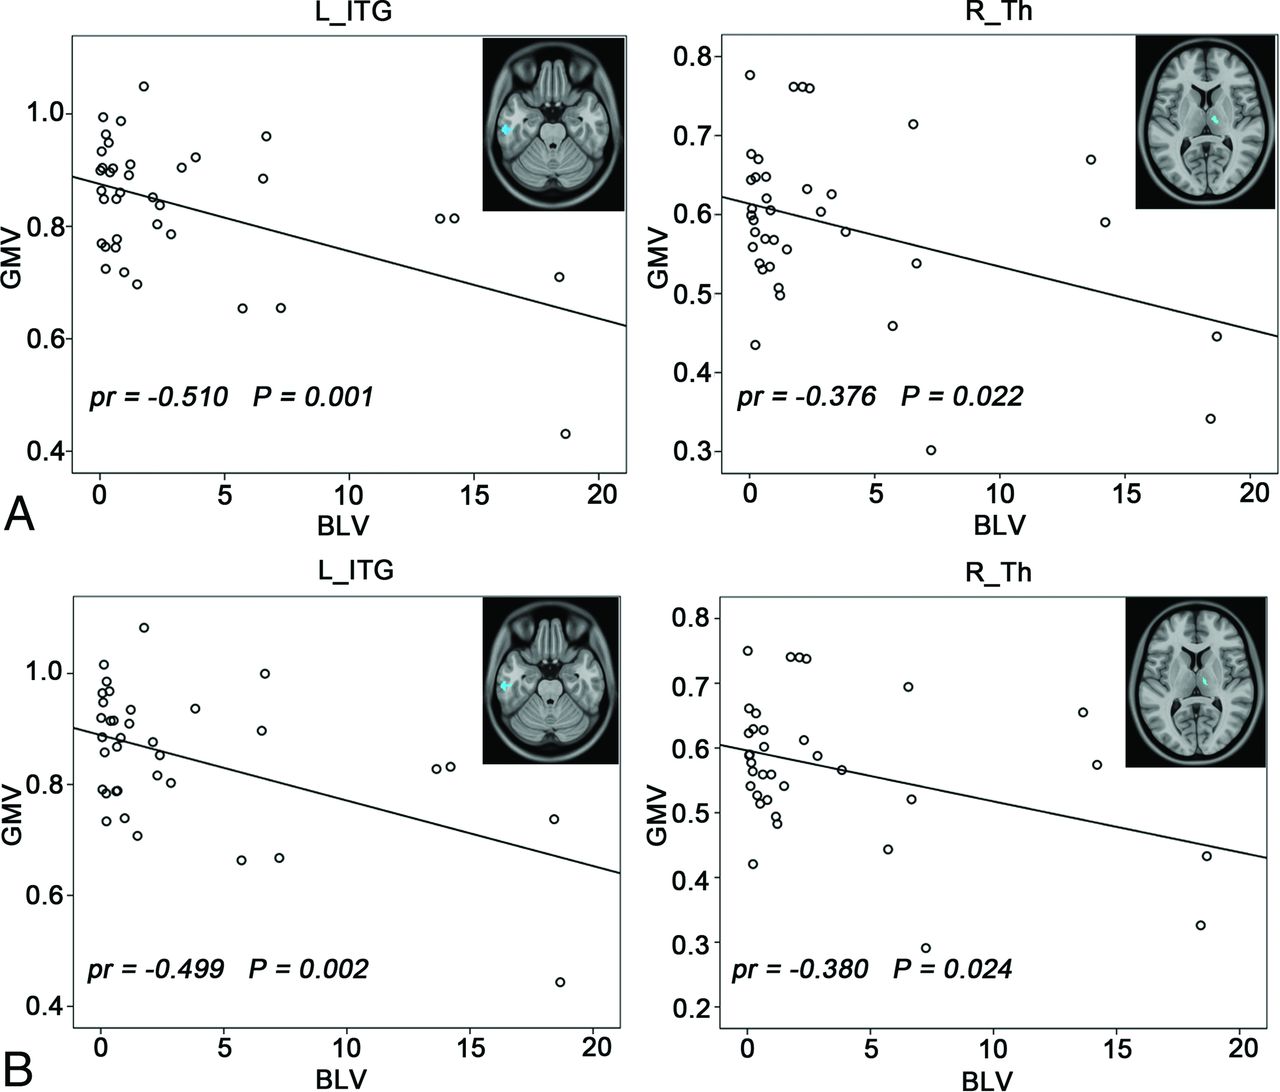
Correlations between the GMV and BLV are demonstrated in Fig 4. Voxel-based analysis revealed that the patients with NMO exhibited significant negative correlations (Alphasim correction, P < .05) between BLV and GMV in the right thalamus (pr = −0.376, P = .022) and left inferior temporal gyrus (pr = −0.510, P = .001). When we excluded the 2 patients with visible lesions in these 2 regions, the correlations between BLV and GMV in the right thalamus (pr = −0.380, P = .024) and left inferior temporal gyrus (pr = −0.499, P = .002) remained significant. No positive correlations were found in the patients with NMO.

Correlations between the GMV and BLV in patients with NMO (Alphasim correction, P < .05). A, Before removing 2 patients with thalamic and inferior temporal gyrus (ITG) lesions. B, After removing 2 patients with thalamic and ITG lesions.
Discussion
In a large sample of patients with NMO, we found GMV reductions in the frontal and temporal cortices and the right thalamus. Moreover, the frontal and temporal GMV reductions were associated with disease severity in the patients with NMO. Finally, we identified significant correlations between GMV reductions and cognitive reductions in the patients with NMO, suggesting that GM pathology is associated with cognitive impairment in NMO.
In this study, the diagnosis of NMO was strictly according to the Wingerchuk diagnostic criteria for NMO.1 All patients fulfilled the absolute criteria (optic neuritis and acute myelitis) and at least 2 of the 3 supportive criteria (contiguous spinal cord MR imaging lesion extending over ≥3 vertebral segments, brain MR imaging that did not meet the diagnostic criteria for multiple sclerosis, and NMO-IgG seropositive status). Only 64% of our patients were seropositive for NMO-IgG, which is a lower incidence than those reported in previous studies.25,29 However, all patients with seronegative NMO-IgG fulfilled the other 2 supportive criteria for NMO (brain MR imaging that did not meet the diagnostic criteria for multiple sclerosis and a contiguous spinal cord MR imaging lesion extending over ≥3 vertebral segments). Although 3 patients had a spinal cord lesion that involved fewer than 3 vertebral segments, they fulfilled the other 2 supportive criteria (NMO-IgG + and brain MR imaging that did not meet the diagnostic criteria for multiple sclerosis). Consistent with previous studies reporting the presence of other autoimmune diseases in a subset of patients with NMO,30,31 6 of the patients with NMO in this study presented with autoimmune diseases. Although they fulfilled the diagnostic criteria for NMO, we cannot exclude the effects of comorbidities on the intergroup GMV differences. To reduce this possibility, we excluded the 6 patients and re-performed GMV comparisons. We found that the intergroup GMV differences were similar before and after excluding these patients (On-line Fig 3), suggesting that the impact of comorbidities on the intergroup GMV comparisons was not significant.
Consistent with prior findings,10,17,18,21⇓⇓–24 we also found cognitive impairment in the patients with NMO. The cognitive impairments in NMO were deficits in short- and long-term memory, speed of information processing, and verbal fluency on semantic stimuli. These impaired cognitive domains have frequently been reported in patients with NMO.10,18,21⇓⇓–24 However, inconsistent with previous studies that reported deficits in immediate memory, attention, and executive abilities,10,17,18,21,23,24 we did not find any significant changes in these 3 cognitive domains in the patients with NMO. This discrepancy may be related to variations in the sample size, demographic and clinical features, and cognitive scales used.
There is an ongoing debate on the abnormality of GM in NMO, especially for structural impairments.14⇓–16 We found GMV reductions in the frontal and temporal lobes and thalamus, the range of which largely surpassed the brain regions connected to the spinal cord and optic nerves. Therefore, the mechanism of axonal degeneration secondary to the damage of the spinal cord and optic nerves cannot fully explain these extensive reductions in the GMV.15 We also found negative correlations between the GMVs of the right thalamus and left inferior temporal gyrus and the BLV, even after excluding patients with visible lesions in these regions. This finding suggests that the GMV reductions in these regions are secondary to brain lesions, which may be mediated by a mechanism of axonal degeneration. This inference is also supported by our subgroup analyses of the GMV differences. The subgroup (NMO-IgG + spinal MR imaging) that presented with an increased incidence of brain lesions also exhibited more significant GMV reductions than those in the subgroup (brain MR imaging + spinal MR imaging) that exhibited fewer brain lesions. However, the GMV reduction in the medial prefrontal cortex was not correlated with the brain lesion volume, indicating that the axonal degeneration mechanism cannot explain the medial prefrontal cortex reduction observed in NMO. This assertion is consistent with the findings of a pathologic study that failed to detect cortical changes that reflected axonal degeneration in patients with NMO.32 Consequently, the primary neurodegenerative processes (neuronal loss) may at least partially account for the GMV reductions in patients with NMO. This hypothesis is confirmed by the results of a pathologic study that revealed a substantial cortical neuronal loss in NMO spectrum disorders.24
The frontal cortex and thalamus are closely associated with cognitive function.10,15,18,33⇓–35 The GMV reductions in these regions may affect cognitive performance.33,35 In our study, a GMV reduction in the thalamus was correlated with deficits in delayed memory; this correlation was consistent with prior findings in multiple sclerosis in which a GMV reduction in the thalamus predicted many cognitive deficits.36 The positive association between several prefrontal regions and immediate memory supported prior findings that the prefrontal cortex played an important role in cognitive function.18,37 Taken together, our findings suggest that GMV reductions in the frontal cortex and thalamus are associated with cognitive impairment in patients with NMO.
We also found significant negative correlations between regional GMV reductions in the frontal and temporal cortices and EDSS scores. These findings suggest that reductions in the GMV are an important pathologic process in NMO, which may be related to disease severity. Our findings also suggest a potential role of GMV reductions in predicting the severity of the disorder.7,38,39
A limitation of this study is that a few of the subjects who underwent GMV analysis were excluded in the correlation analysis with cognitive scores because they did not successfully complete the cognitive assessments due to biliousness or other private reasons. However, we believe that our findings for these correlations are robust because the smallest group still included 34 patients with NMO. Another limitation is the cross-sectional design of our study. Further studies with a longitudinal design should be performed to determine the evolution of GMV changes in NMO.
Conclusions
We used a combination of structural brain MR imaging and neuropsychological tests to investigate GMV reductions and their association with cognitive impairment in a large sample of patients with NMO. We confirmed that GMV reductions are associated with NMO, and we revealed the distribution of regional GMV reductions in NMO. By investigating correlations between GMV reductions and BLV, we suggest that both neurodegeneration and axonal degeneration mechanisms may contribute to GMV reductions in NMO. We also found significant correlations between GMV reductions and cognitive impairments, indicating a role of GM structural impairment in cognitive deficits in NMO.
Acknowledgments
The authors thank the Tianjin Neuroimmunology laboratory team for conducting the detection of NMO-IgG and other autoantibodies.
Footnotes
Disclosures: Fu-Dong Shi—RELATED: Grant: National Basic Research Program of China (Grant 2013CB966900), the National Science Foundation of China (grant 81230028), the National Key Clinical Specialty Construction Program of China.* *Money paid to the institution.
This study was supported by the Tianjin Key Technology Research and Development Program (14ZCZDSY00018), the National Basic Research Program of China 2013CB966900, and the National Natural Science Foundation of China (No. 81425013).
Indicates open access to non-subscribers at www.ajnr.org
REFERENCES
- 1.
- 2.
- 3.
- 4.
- 5.
- 6.
- 7.
- 8.
- 9.
- 10.
- 11.
- 12.
- 13.
- 14.
- 15.
- 16.
- 17.
- 18.
- 19.
- 20.
- 21.
- 22.
- 23.
- 24.
- 25.
- 26.
- 27.
- 28.
- 29.
- 30.
- 31.
- 32.
- 33.
- 34.
- 35.
- 36.
- 37.
- 38.
- 39.
- Received January 8, 2015.
- Accepted after revision March 14, 2015.
- © 2015 by American Journal of Neuroradiology