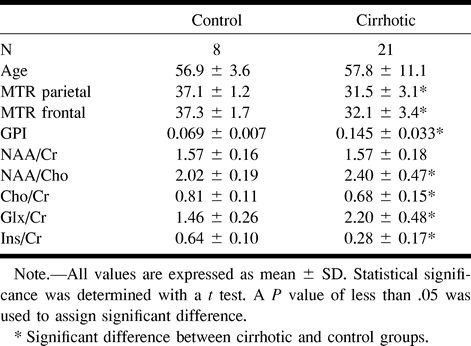
TABLE 1:
1H-MRS metabolite ratios from the parietal white matter, normalized globus pallidus intensity (GPI) and MTR of different brain regions for the control and cirrhotic groups

1H-MRS metabolite ratios from the parietal white matter, normalized globus pallidus intensity (GPI) and MTR of different brain regions for the control and cirrhotic groups