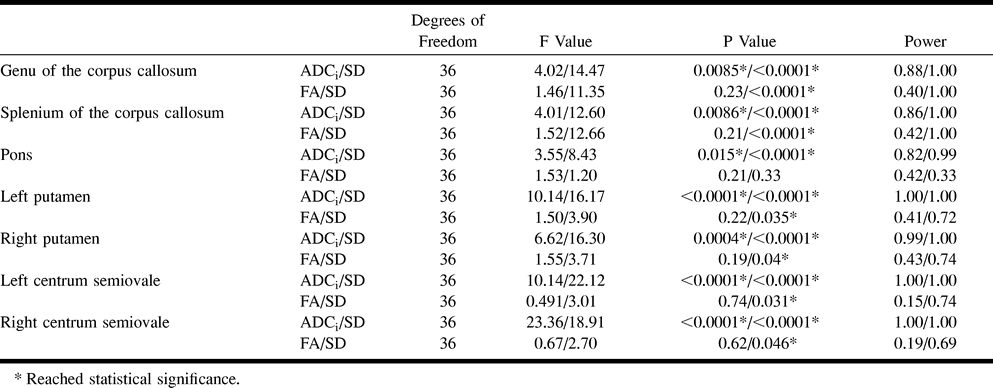
TABLE 4:
ANOVA for ADC
i
, FA and their respective SD for the subgroups with different strengths of b values