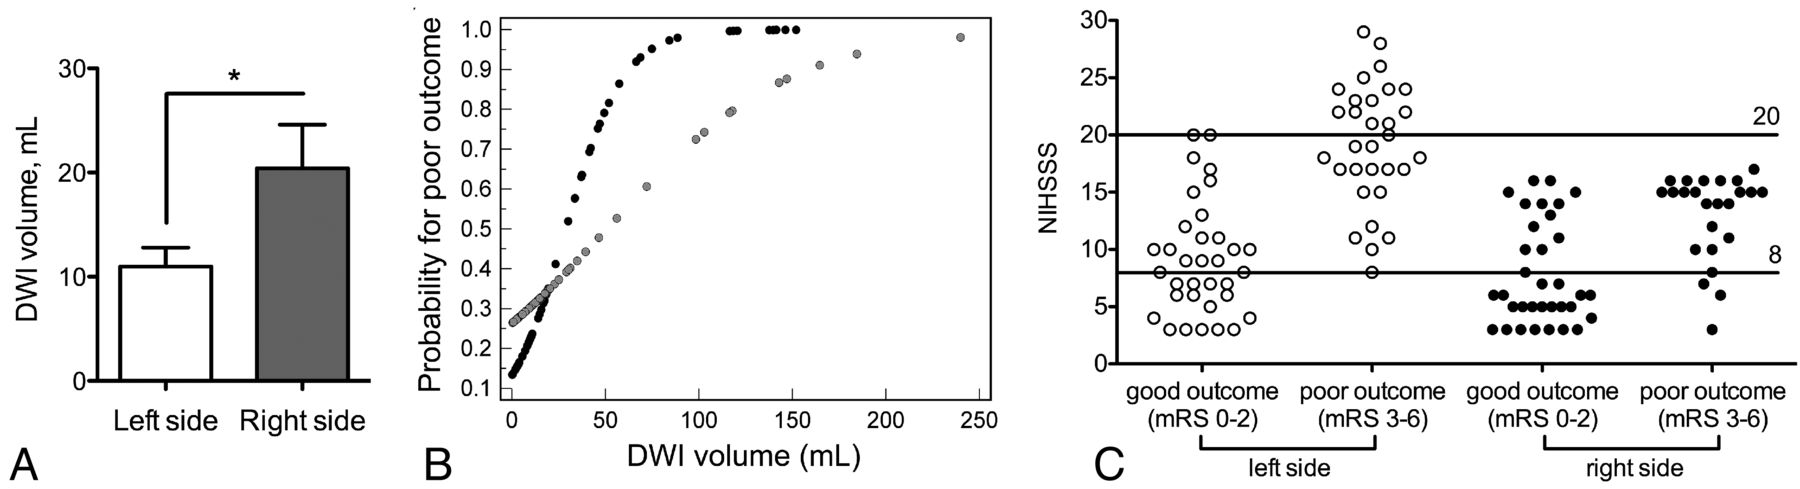
Fig 3.
Baseline infarct volumes, probability for poor outcome, and NIHSS score thresholds in left- versus right-sided strokes. A, Mean DWI volume in patients with good outcome stratified by side of involvement. Asterisks indicate a significant difference. B, Probability (determined by logistic regression) for poor outcome versus DWI plots between left- and right-sided strokes (left = black circles, right = gray circles). C, NIHSS score scatterplots and thresholds stratified by side of involvement.