 Berke Doga Basaran
 Paul M. Matthews
 Wenjia Bai
- 1Department of Computing, Imperial College London, London, United Kingdom
- 2Data Science Institute, Imperial College London, London, United Kingdom
- 3Department of Brain Sciences, Imperial College London, London, United Kingdom
- 4UK Dementia Research Institute, Imperial College London, London, United Kingdom
Multiple sclerosis (MS) is an inflammatory and demyelinating neurological disease of the central nervous system. Image-based biomarkers, such as lesions defined on magnetic resonance imaging (MRI), play an important role in MS diagnosis and patient monitoring. The detection of newly formed lesions provides crucial information for assessing disease progression and treatment outcome. Here, we propose a deep learning-based pipeline for new MS lesion detection and segmentation, which is built upon the nnU-Net framework. In addition to conventional data augmentation, we employ imaging and lesion-aware data augmentation methods, axial subsampling and CarveMix, to generate diverse samples and improve segmentation performance. The proposed pipeline is evaluated on the MICCAI 2021 MS new lesion segmentation challenge (MSSEG-2) dataset. It achieves an average Dice score of 0.510 and F1 score of 0.552 on cases with new lesions, and an average false positive lesion number nFP of 0.036 and false positive lesion volume VFP of 0.192 mm3 on cases with no new lesions. Our method outperforms other participating methods in the challenge and several state-of-the-art network architectures.
1. Introduction
Multiple sclerosis (MS) is a chronic inflammatory neurological disease affecting the central nervous system (CNS). Generally detected in young adults, ages 20–40, demyelinated lesions in the CNS lead to cognitive and physical disabilities, affecting vision, learning and memory, musculoskeletal system, and internal organ dysfunctions (Ghasemi et al., 2017). While MS is not fatal, average life expentancy is 5–10 years lower than average. The McDonald diagnostic criteria (Thompson et al., 2018) for MS provides guidelines for diagnosing the patient based on the number of lesions, lesion size, and locations of lesions in the brain and spinal cord. Disease progression for MS patients is highly varied and unpredictable, therefore, identifying disease trajectories and closely following them are important for prognosis and treatment decisions.
Multiple sclerosis is typically diagnosed via the patient showing symptoms in combination with supporting medical imaging of the brain. Specifically, the presence of lesions on brain MRI scans is a predictive image-based biomarker for MS diagnosis. Common multi-modal brain MRI acquisitions are composed of T1, T2, fluid-attenuated inversion recovery (FLAIR) and proton-density modalities. Lesions in the periventricular, juxtacortical, and infratentorial regions are presented as hyperintensities on T2-weighted and FLAIR MRI, or hypointensities on T1-weighted MRI (Filippi et al., 2019).
To monitor the progression of the disease, patients may take multiple MRI scans at different time points, typically 6–12 months apart. The detection of newly formed lesions provides crucial information for assessing disease activity and treatment outcome. Formation of new lesions correlates with the progression and severity of the disease and is often complemented with increased symptoms (Weiner et al., 2000). Manual assessment of these imaging scans can be time consuming, especially when attempting to identify formations of new lesions compared to the baseline scan. Automated detection and segmentation of brain lesions substantially aid neuro-radiologists in tracking the progression of the disease. Additionally, state-of-the-art machine learning methods can provide fast and reliable quantitative information on detected abnormalities, such as lesion load, lesion number, or even patient outcome (Tousignant et al., 2019; McKinley et al., 2020).
Recent developments in convolutional neural networks (CNNs) have shown promising results for image segmentation tasks (Alzubaidi et al., 2021). The two-dimensional (2D) U-Net (Ronneberger et al., 2015) and three-dimensional (3D) U-Net (Çiçek et al., 2016) architectures have been widely adopted in biomedical image segmentation tasks due to their ability in incorporating multi-scale spatial context and generalisability across different biomedical domains. nnU-Net (Isensee et al., 2021a), a U-Net based medical image segmentation network which employs a self-adapting framework, has shown excellent performance in a number of organ segmentation tasks (Isensee et al., 2021a,b). nnU-Net stands for “no new U-Net.” Its strong performance across a variety of datasets is not due to a new network architecture, but rather to automating the process of manual configuration of setting up a neural network. nnU-Net configures its network and pipeline subject to dataset properties and available GPU memory budget, maximizing the training patch size which the GPU memory will allow.
Nevertheless, there are still several challenges in applying these methods to brain image segmentation tasks, such as for MS lesion segmentation. The first challenge is the scarcity of data and annotation. Most of the public MS lesion datasets, such as the 2016 MSSEG (Commowick et al., 2018) and the 2015 ISBI MS (Carass et al., 2017) datasets, only contain images from a dozen of subjects. In a field where data diversity is paramount, data augmentation methods become critical tools to boost model performance. The second challenge is the class imbalance problem. In MS lesion segmentation, almost all of the foreground voxels represent healthy brain tissues and the lesions only constitute for a minority of the voxels. This means that the deep learning models tend to learn from the healthy tissues instead of the lesions of interest. In an attempt to allow the network to learn features from underrepresented classes, patches which contain the underrepresented class are often oversampled (Rahman and Davis, 2013). Despite oversampling strategies, the class imbalance problem is amplified even more when working with longitudinal MS data, where the objective is to detect new lesions. New lesions to detect in follow-up scans can make up as little as 0.01% of the 3D image volume.
There is still room for improvement for current lesion segmentation methods in detecting small lesions and tracking their temporal trajectories in disease progression. Commowick et al. (2018) finds that lesion detection rates fall significantly as lesion volumes decrease, resulting in false negative results in automated segmentation. This forms a critical challenge when newly formed lesions need to be considered for MS progression monitoring, which these lesions are often small and hard to detect.
In this paper, we propose a deep learning pipeline for new MS lesion segmentation. The developed pipeline is built upon the nnU-Net framework and we incorporate multiple brain-image preprocessing steps as well as imaging and lesion-aware data augmentation techniques. We evaluate the pipeline on the MSSEG-2 challenge dataset (Commowick et al., 2021a), which demonstrates promising results for both new lesion cases and no new lesion cases.
2. Methods
2.1. Related works
2.1.1. Deep learning for MS lesion segmentation
There have been contributions to machine learning methods specifically for MS lesion segmentation. Numerous methods were developed following the 2015 ISBI Longitudinal Multiple Sclerosis Lesion Segmentation Challenge (Carass et al., 2017). Valverde et al. (2017) employed a cascade of two 3D patch-wise CNNs, where the first CNN proposed candidate lesion voxels and the second one reduced falsely classified voxels. Birenbaum and Greenspan (2017) developed a multi-view longitudinal CNN and utilized priors about lesion intensities and spatial distribution to extract candidate lesions. Similar to Valverde et al., and Birenbaum et al. also used 3D patches for model training. Contrary to patch-based training, Aslani et al. (2019) proposed a multi-branch CNN which takes whole slices of the brain as input. Three 2D ResNets were separately trained for the axial, sagittal, and coronnal planes, the outputs of which were fused to generate a final 3D segmentation. Zhang et al. (2019) developed a fully convolutional densely connected network (Tiramisu) using a 2.5-dimensional input where slices were stacked from three anatomical planes, providing both global and local context in segmentation.
Transformer networks are now a widely adopted network model for both natural language processing and computer vision tasks due to their self-attention mechanisms. The Vision Transformer (ViT) (Dosovitskiy et al., 2021) showcased that a pure transformer applied on sequences of image patches can achieve competitive image classification performance. Consequently, a multitude of transformer-based frameworks for medical image segmentation have been proposed. The majority of these models utilize CNNs in conjunction with transformers, taking advantage of both local and global context information extraction. TransBTS performs 3D CNN encoding followed by a transformer for global feature modeling in multi-modal brain tumor segmentation (Wang et al., 2021). TransUNeT employs a hybrid CNN-Transformer architecture for multi-organ abdominal image segmentation (Chen et al., 2021). UNETR implements a pure transformer encoder based on ViT in combination with resolution-wise convolutions and a deconvolutional layer for decoding the image back into the original dimension (Hatamizadeh et al., 2022). It performs competitively with state-of-the-art methods in multi-organ CT and MRI brain tumor segmentation tasks.
2.1.2. Data augmentation
Data augmentation can be classified into four categories: affine transformations, elastic transformations, intensity alterations, and incorporation of synthetic data. Affine transformations include flipping, rotation, scaling, and shearing of the image. Affine transformations do not drastically change the shape characteristics of the abnormal region with respect to its surrounding tissue. Elastic transformations generate a displacement grid with random displacements, which is used to deform individual voxels of the input image (Çiçek et al., 2016). The non-linear transformations alter the boundaries of the abnormal region with respect to its surrounding tissue, producing diverse samples. Intensity alterations introduce Gaussian noise, Gaussian blurring, sharpening, salt and pepper noise, and gamma augmentation etc. to improve model robustness against intensity distribution shift, which concerns imaging scans acquired from different scanner models, scanner acquisition parameters, or scanner strengths. Synthetic data augmentation utilizes generative models or MixUp (Zhang et al., 2018) techniques to generate new samples. For example, generative adversarial networks (GANs) (Goodfellow et al., 2014) were introduced for data augmentation in biomedical image segmentation (Shin et al., 2018; Sandfort et al., 2019; Hong et al., 2021). MixUp (Zhang et al., 2018) and related methods such as MixMatch (Berthelot et al., 2019) and CutMix (Yun et al., 2019) designed specific operations on two or more images to generate new samples. For brain lesion images, a lesion-aware augmentation method, CarveMix (Zhang et al., 2021), was proposed to combine two brain MRI scans to increase training data diversity. CarveMix randomly extracts lesion regions on the sagittal plane from one image and overlays them onto a target image (Zhang et al., 2021).
2.2. Proposed pipeline
The proposed pipeline consists of a brain image preprocessing step, followed by nnU-Net (Isensee et al., 2021a) for lesion segmentation, which is trained with imaging and lesion-aware data augmentation. An overview of the pipeline is presented in Figure 1.
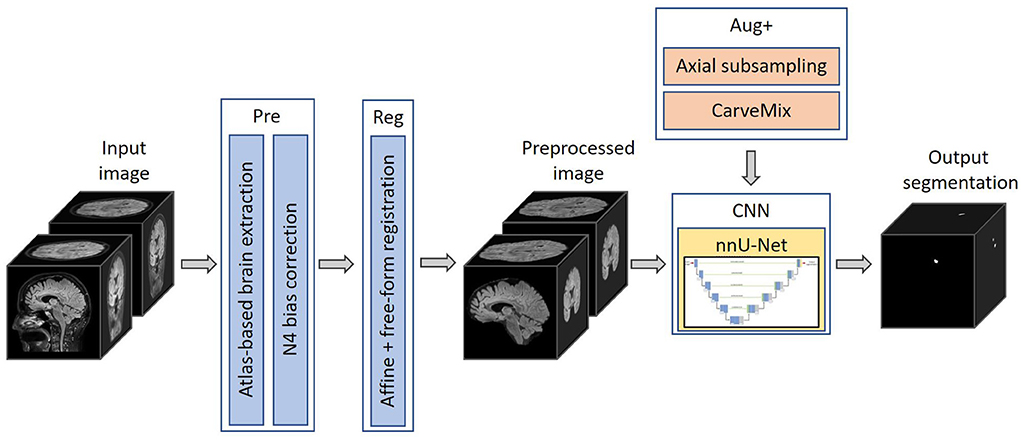
Figure 1. The proposed 3D framework for multiple sclerosis new lesion detection and segmentation. Framework comprises of brain extraction and N4 bias correction (Pre), intra-subject registration (Reg), imaging and lesion-aware data augmentations (Aug+), and nnU-Net. The pipeline takes input the baseline and follow-up FLAIR MRI scans, and outputs the proposed binary segmentation for new lesions.
2.2.1. Preprocessing
Skull is stripped using an atlas-based brain extraction tool (Doshi et al., 2013) followed by N4 bias field correction (Tustison et al., 2010). This is implemented using the MSSEG-2 longitudinal preprocessing script on Anima1 provided by the challenge organizers. In addition, as the segmentation problem concerns imaging scans taken at different time points, we also perform intra-subject image registration so that scans of the same subject can be aligned and new lesions can be better differentiated. Since new lesions are defined on the follow-up scan, we register the baseline scan to the space of the follow-up scan. Affine image registration is performed, followed by free-form deformation, implemented using the MIRTK toolbox (MIRTK, 2021) using normalized mutual information as the loss function. Free-form deformation assists lesion segmentation in two ways: (1) brain structures, such as gyri, ventricles etc., are better registered; (2) lesions which slightly grow between scans are elastically registered so that the subsequent segmentation network can focus more on newly formed lesions.
2.2.2. Segmentation network
We adopt nnU-Net (Isensee et al., 2021a) as the segmentation network, with a two-channel input: preprocessed baseline scan and preprocessed follow-up scan. The output of the network is a binary 3D prediction of new lesions which have formed in the follow-up scan. The network consists of six resolution levels, formed from contracting and expanding paths. On the contracting path, each resolution level consists of two convolutional layers, each with a 3 × 3 × 3 convolution kernel, followed by instance normalization and LeakyReLU operation. At the start of each resolution level, the first convolution has a stride of (2,2,2), which effectively downsamples the feature map. At the lowest resolution level, the first convolution has a stride of (2,1,2).
On the expanding path, each resolution level consists of two convolutional layers with a 3 × 3 × 3 convolution kernel, followed by instance normalization and LeakyReLU operations, followed by an additional transposed 2 × 2 × 2 convolution operation. The transposed convolution has a stride of (2,1,2) at the lowest resolution level, and a stride of (2,2,2) at all other resolution levels. By utilizing skip connections, features extracted from the contracting path are concatenated with features at the expanding path at their respective resolution level. The network uses 32-dimensional features maps at the highest resolution layer, which is increased to 320 feature maps at the lowest resolution layer. Please refer to Figure 2 for a graphical representation of the architecture.
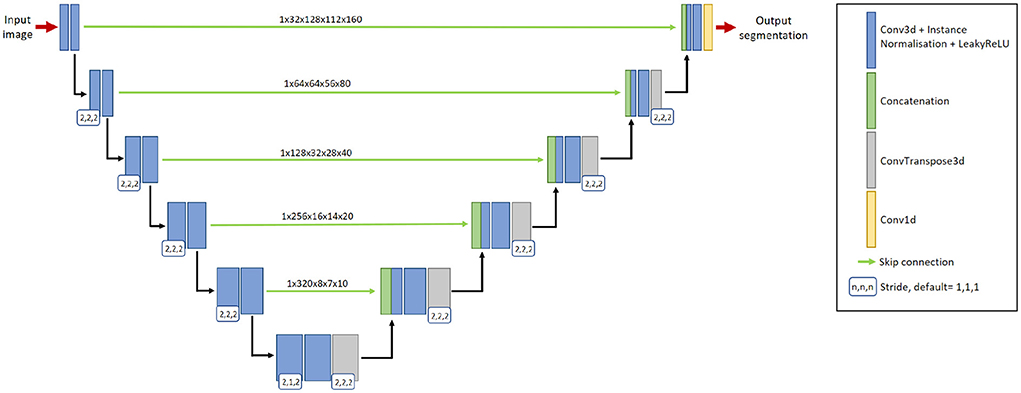
Figure 2. The 3D nnU-Net architecture for segmenting new lesions. It contains six resolution levels formed from contracting and expanding paths, and skip connections to recover fine-grain detail from the contracting path. The input to the network is a pair of baseline image and follow-up image. The output is the prediction of the new lesions.
2.2.3. Hyperparameters and implementation details
We implement the 3D full-resolution U-Net model of nnU-Net, using the 3d_fullres configuration, utilizing PyTorch. A single NVidia Tesla T4 GPU with 16GB RAM is used. Due to the GPU memory limit, 3D patches of size 128 × 112 × 160 are extracted from the original 3D images for model training. Patches are drawn randomly from the image with a 67% probability, and are ensured to include the lesion region with a 33% probability. The network is trained using a combination of Dice and cross-entropy loss, formulated as,
where k denotes the class, K denotes the number of classes (K = 2 in our method), i denotes a given voxel, I denotes the set of voxels over the image, ŷ is the softmax output of the segmentation network, y is the one-hot encoding of the ground truth label for the new lesions, and subscript i(k) is the number of voxels in the training patch for class k.
We use the stochastic gradient descent optimizer with Nesterov momentum of 0.99, an initial learning rate of 0.01, a polynomial learning rate decay and a batch size of 2 patches. When developing the model on the training data, five-fold cross-validation is used. Each model is trained for 1,000 epochs. After training, for each fold, we select the model which produces the highest Dice score. For inference, we ensemble segmentation outputs from the five models from each fold. No post-processing step is applied.
2.2.4. Imaging and lesion-aware data augmentation
Incorporation of data augmentation methods increases model generalizability and robustness, and decreases overfitting. We utilize multiple data augmentation techniques, including the default augmentations that nnU-Net provides in the batchgenerators data augmentation framework (Isensee et al., 2020). These augmentations include mirroring, rotating, scaling, channel translation to simulate registration errors, elastic deformations, linear downsampling, brightness and contrast augmentation, gamma augmentation, Gaussian and Rician noise augmentation, and random cropping.
In addition to these augmentations, inspired by Kamraoui et al. (2021, 2022), we introduce axial subsampling to simulate the image acquisition process on the axial plane. Brain MRI typically acquires a stack of 2D image slices in the axial plane to form a 3D volume, which can be of a high resolution within the axial plane but subject to low resolution across the plane (Chai et al., 2020). Axial subsampling augmentation is performed by applying a median filter of size [1 × 1 × n] where n ∈ 2, 3, 4 to the axial image slices. This effectively blurs the image in the sagittal and coronal planes. Figure 3A illustrates an example of axial subsampling.
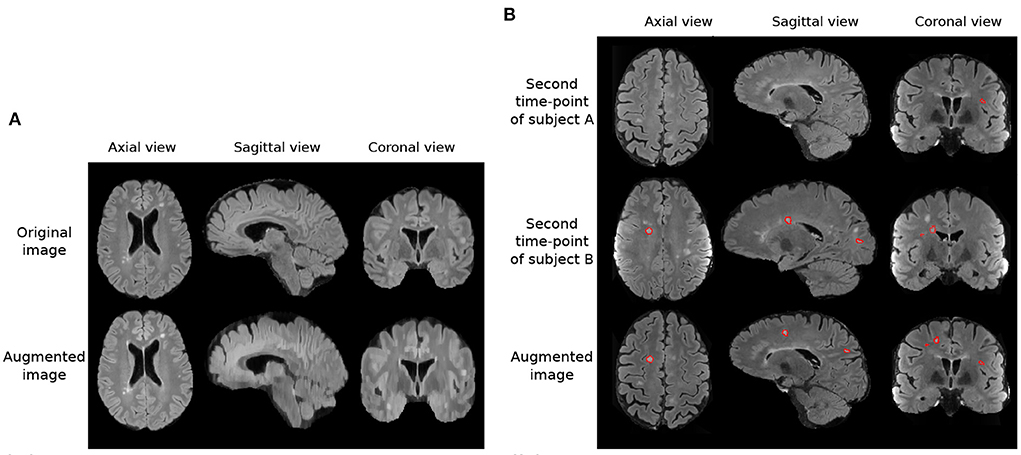
Figure 3. Imaging and lesion-aware data augmentations applied on the MSSEG-2 training set. (A) Example of axial subsampling (n = 4) to simulate the blurring in image acquisition. (B) Example of the CarveMix augmentation. Lesions from subject B are carved out and fused onto scan from subject A. Contours delineate lesion labels.
Finally, to increase the diversity of lesion images, a lesion-aware data augmentation method, CarveMix (Zhang et al., 2021), is used. CarveMix extracts a 3D region of interest (ROI) according to the lesion location and shape from one subject and mixes it with the brain image of another subject, thus creating augmented training samples. To increase diversity in augmentation, the lesion-aware ROI is generated by thresholding the distance transform of the lesion using a random threshold (Zhang et al., 2021). A synthetic image, X, and its label, Y, is generated by,
where {Xi, Yi} denotes one pair of image and label, {Xj, Yj} denotes a second pair of image and label, Mi denotes the binary mask of the ROI, and ⊙ represents voxel-wise multiplication. We randomly select two subjects for CarveMix augmentation when training. Incorporation of CarveMix data augmentation increases the total volume which the lesion class covers in an image, thus reducing the effect of class imbalance caused from the foreground class making up a small percentage of the overall image. Figure 3B illustrates an example of CarveMix augmentation.
3. Results
3.1. Data
We evaluate the pipeline on the MICCAI 2021 MS new lesion segmentation challenge dataset (MSSEG-2) (Commowick et al., 2021a), which provides 3D FLAIR images of 100 MS patients. The images were acquired from 15 different scanners, six of them 1.5T and nine of them 3T, including three GE scanners, six Philips scanners, and six Siemens scanners. Dataset scanner information can be found at the MICCAI 2021 MSSEG-2 challenge demographics data (Commowick et al., 2022). The images have varying image size and voxel spacing, which we resample to the median spacing of the dataset, 0.977 × 0.977 × 0.530mm3, before model training. Each patient was scanned twice, with 1–3 years between the two time points, constituting for a total of 200 images. Only new lesions at the second time point were annotated. Existing lesions, growing or shrinking lesions were not delineated. Each patient was annotated by four neuroradiologist and one consensus new lesion mask was provided. We use the consensus lesion masks as ground truth for model training and evaluation.
The dataset has been partitioned into 40 training and 60 test subjects by the challenge organizers. Of the 40 training subjects, 11 of them do not exhibit new lesions, which are referred to as “no-new lesion cases.” We exclude these 11 no-new lesion cases from the training set, utilizing the remaining 29 cases for model training. Of the 60 test subjects, 28 of them do not exhibit new lesions. We use all 60 subjects for testing.
3.2. Evaluation metrics
The method is evaluated using the Anima analyzer tool's animaSegPerfAnalyzer2 function, provided by the MSSEG-2 challenge organizers in order to provide a fair comparison with other participating methods. In line with the MSSEG-2 evaluation, we use the default configuration of animaSegPerfAnalyzer, which excludes lesion volumes smaller than 3mm3. The performance is evaluated separately for patients with new lesions and those with no-new lesions on the test set. For the new lesion cases, we report new lesion detection and segmentation performance, true positive lesion count, false positive lesion count, and false negative lesion count; for the no-new lesion cases, we calculate the number of new lesions detected (false positive lesions) and the volume of these false positive lesions.
3.2.1. Performance on new lesion cases
New lesion detection performance is evaluated using the F1 score. The F1 score measures how many lesions are correctly or incorrectly detected, regardless of the precision of its contours. It is formulated as,
where SL denotes the lesion detection sensitivity (recall) and PL denotes the positive predictive value (precision). The optimal F1 score is 1. A lesion is considered as being detected or true positive if the automatic detection overlaps with at least 10% of the ground truth lesion volume and does not go outside by more than 70% of the volume (Commowick et al., 2018).
New lesion segmentation performance is evaluated using the Dice similarity coefficient, DSC, which measures spatial overlap. DSC is formulated as,
where A denotes the automatic segmentation and G denotes the ground truth. The optimal DSC is 1.
In addition to the metrics used in the MSSEG-2 challenge, we also present results for average true positive lesion count, nTP, average false positive lesion count, nFP, and average false negative lesion count, nFN. Average true positive lesion count evaluates the average correctly detected lesions by the automated method. nFP evaluates the average incorrectly detected lesions by the automated method. Finally, nFN evaluates the lesions not detected by the automated method. These metrics are averaged over the 32 new lesion cases in the test set. The consensus ground truth segmentation contains a total of 224 new lesions, therefore the optimal average true positive lesion count, nTP, is 7 (). The optimal score for nFP or nFN is 0.
3.2.2. Performance on no-new lesion cases
For no-new lesion cases, the number and volume of falsely predicted lesions are evaluated. To count the number of false positive lesions, the Anima tool, animaConnectedComponents3 function is used with default parameters. The volume of false positive lesions is calculated by multiplying the number of lesion voxels by voxel spacing. We denote number of false positive lesions as nFP, and volume of false positive lesions as VFP. The optimal scores for both false positive lesion number and volume are 0.
3.3. Results
3.3.1. Comparison against participating methods in the challenge
The proposed pipeline is compared against MSSEG-2 participating methods and also four expert raters (Commowick et al., 2021b), reported in Table 1. The performance of MSSEG-2 participating methods and four expert raters is acquired from Commowick et al. (2021b). Table 1 shows that the proposed pipeline ranks competitively against methods submitted to the MSSEG-2 challenge. For the new lesion cases, it outperforms the other methods in terms of both the average DSC and the average F1 scores. Also, our method outperforms three of the experts in nTP and nFN metrics. Our method correctly identifies 24 of the 32 new lesion cases as having new lesions. We achieve comparable performance to Experts 1, 2, 3 and 4, which correctly identify 26, 25, 27, and 22 of the 32 new lesion cases as having new lesions, respectively. A non-zero F1 score is regarded as a method having correctly identified a new lesion case.

Table 1. Comparison of the proposed method to the challenge participating methods in terms of DSC, F1 scores, the number of true positive lesions nTP, the number of false positive lesions nFP, the number of false negative lesions nFN, and volume of false positive lesions VFP (unit: mm3), averaged across cases.
For the no-new lesion cases, the proposed pipeline achieves the lowest metrics for false positive lesions, including the average number nFP and the average volume VFP. It correctly identifies 27 out of 28 no-new lesion cases as subjects with no-new lesions. When comparing to expert raters, on the new lesion cases, the proposed pipeline outperforms Expert 4 in terms of DSC and F1 scores and approaches the performance of Expert 2. On the no-new lesion cases, the proposed pipeline outperforms or achieves a comparable performance to Experts 1, 2 and 4.
3.3.2. Sensitivity vs. specificity analysis
Table 1 shows that there is a reverse correlation between the results for new lesion cases vs. no-new lesions cases, especially in the participating methods for the MSSEG-2 challenge. In Figure 4, we plot the average DSC and F1 scores against the average nFP and VFP metrics. It shows that methods which perform well in new lesion cases do not perform as well in no-new lesion cases. Contrary to other methods, the proposed pipeline does not suffer from severe negative correlation, which performs well in both new lesion and no-new lesion cases.
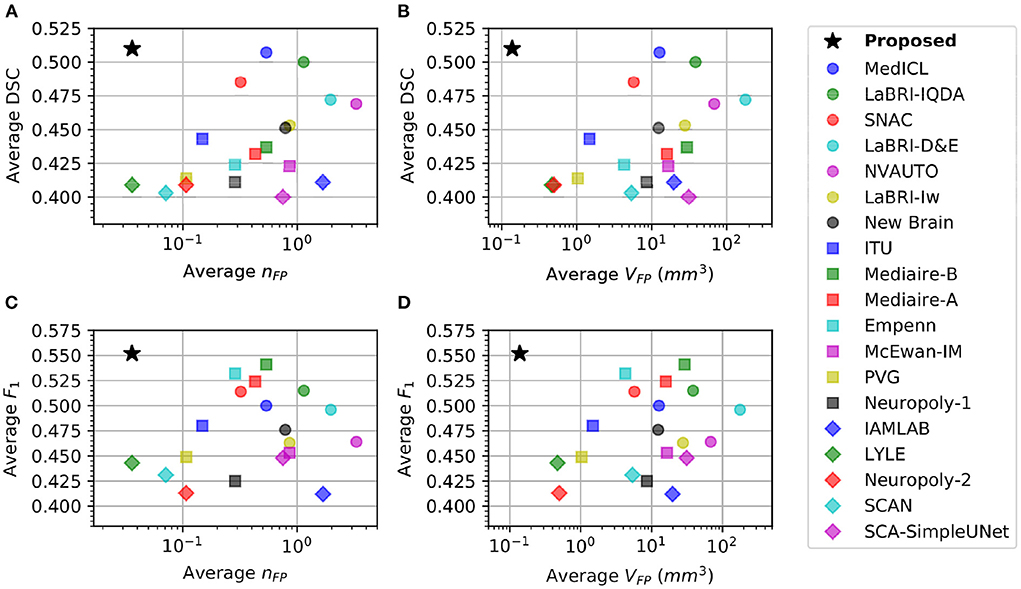
Figure 4. Comparison of different methods in new lesion metrics (DSC and F1) vs. no-new lesion metrics (nFP and VFP). X-axis denotes one of the no-new lesion metrics in logarithmic scale and Y-axis denotes one of the new lesion metrics. Star denotes the proposed pipeline. (A) Plot of average DSC vs. average false positive lesion count nFP. (B) Plot of average DSC vs. average false positive lesion volume VFP. (C) Plot of average F1 vs. average false positive lesion count nFP. (D) Plot of average F1 vs. average false positive lesion volume VFP.
3.3.3. Comparison against state-of-the-art architectures
We also compare the proposed pipeline to a number of state-of-the-art convolutional and transformer-based architectures, which have demonstrated excellent performance in biomedical image segmentation tasks. These architectures include the standard nnU-net (Isensee et al., 2021a), TransBTS (Wang et al., 2021), UNETR (Hatamizadeh et al., 2022), TransUNet (Chen et al., 2021), and Tiramisu 2.5D (Zhang et al., 2019). In order to evaluate methods fairly, we train these methods using the same preprocessed data, described in Section 2.2.1, which includes atlas-based brain extraction, N4 bias field correction, and free-form deformation registration, and use the standard data augmentation. The quantitative comparison results are reported in Table 2, and an example segmentation for visual comparison is provided in Figure 5. Table 2 shows that nnU-Net with standard data augmentations performs favorably against these state-of-the-art methods, and the proposed pipeline further improves performance possibly due to the additional data augmentation that we have introduced.
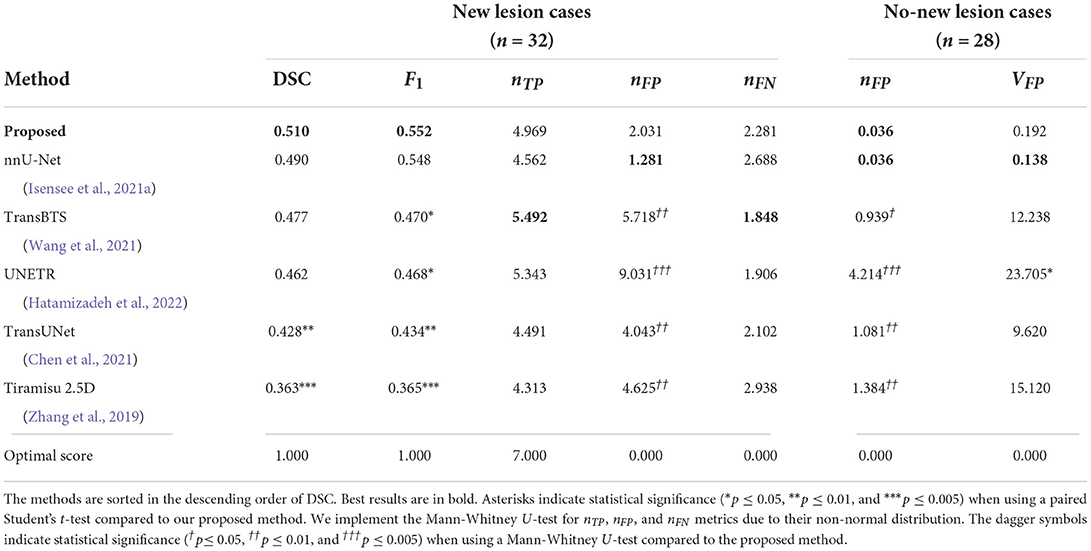
Table 2. Comparison of the proposed method to recent state-of-the-art deep learning architectures in terms of DSC and F1 scores, the number of false positive lesions nFP, the number of true positive lesions nTP, the number of false positive lesions nFP, the number of false negative lesions nFN, and volume of false positive lesions VFP (unit: mm3), averaged across cases.
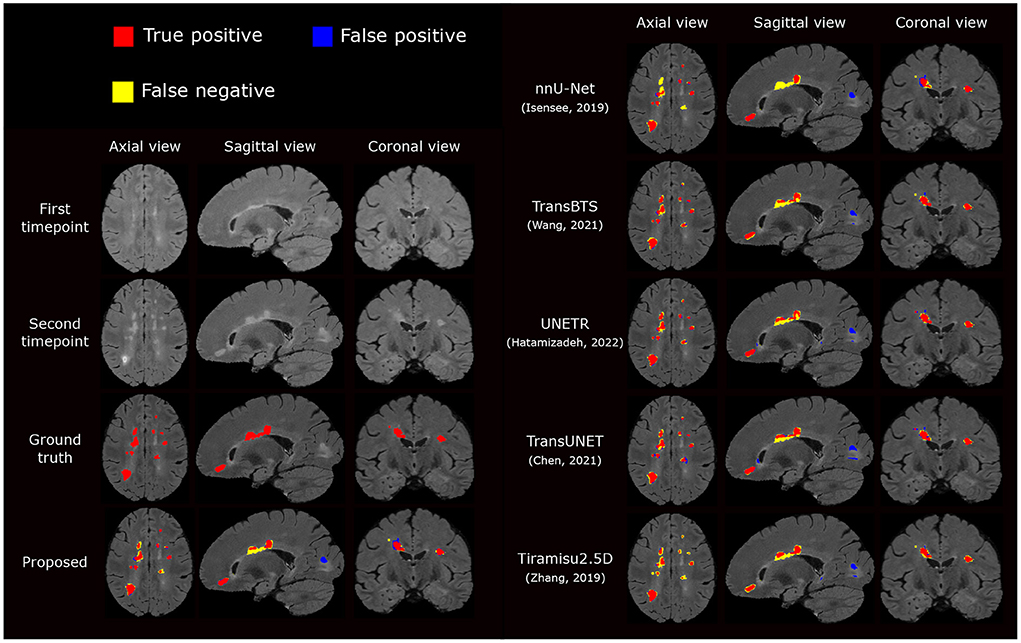
Figure 5. Visual comparison of the proposed segmentation pipeline to other methods. The proposed method produces a segmentation closest to the ground truth annotation.
3.3.4. Ablation study
We carry out an ablation study to evaluate the impacts of different components of the pipeline, including brain extraction and N4 bias correction (Pre), affine and free-form image registration (Reg) and additional data augmentation methods including axial subsampling and CarveMix (Aug+). By default, standard data augmentation methods are used which come with nnU-Net, described in Section 2.2.4. The ablation study results are presented in Table 3.
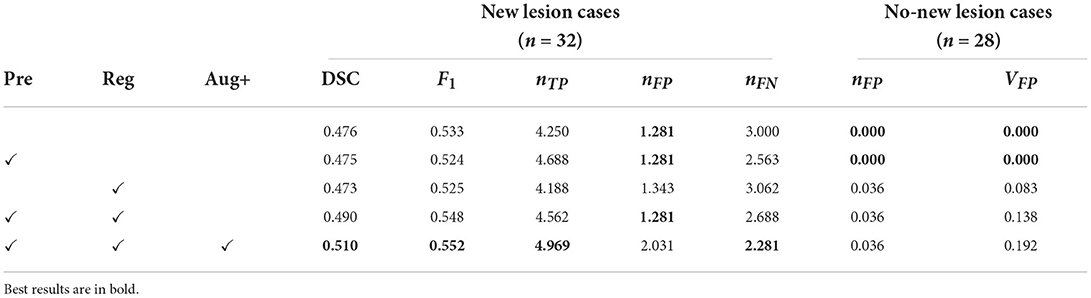
Table 3. Results for the ablation study, presenting DSC and F1 scores, the number of false positive lesions nFP, the number of true positive lesions nTP, the number of false positive lesions nFP, the number of false negative lesions nFN, and volume of false positive lesions nFP (unit: mm3), averaged across cases.
Interestingly, adding pre-processing alone or registration alone does not drastically change performance metrics. However, when they are combined, for new lesion cases, the DSC score is increased from 0.476 to 0.490 and the F1 score is increased from 0.533 to 0.548. When imaging-related and lesion-aware data augmentations (Aug+) are introduced, the DSC score is further increased to 0.510 and the F1 score is increased to 0.552. This demonstrates that all the three components play an important role in the proposed pipeline. We also observe that when DSC and F1 scores are increased, metrics concerning no-new lesion cases become poorer. The undesired increase in false positive lesion count and lesion volume is discussed in detail in Section 3.3.6.
3.3.5. Exclusion of no new lesion cases during training
The MSSEG-2 training dataset is composed of 40 subjects. 11 subjects do not exhibit new lesions in their follow-up scans. These subjects were removed from the training dataset, thus we only utilized 29 subjects. We carry out an additional study to investigate the impact of the exclusion of these images, by comparing the performance on the test set when utilizing all 40 subjects for segmentation model training against using the 29 subjects with new lesions. Results are presented in Table 4. Interestingly, removing the no new lesion subjects result in slightly higher DSC and F1 score, without compromising performance in the no new lesion cases. This is likely due to higher average representation of the foreground class (new lesions) in the altered training set. In addition, reducing the training set from 40 to 29 subjects decreased the model training time by 27.5%.
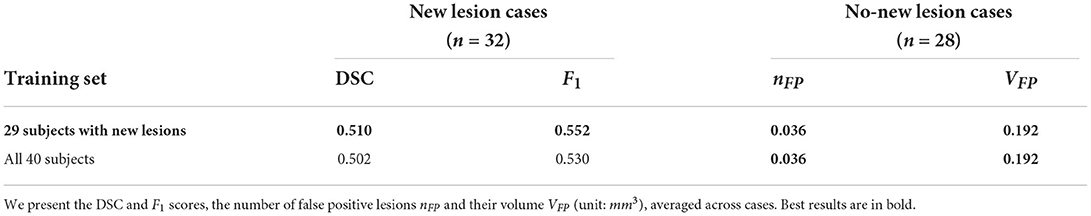
Table 4. Comparison between using the complete MSSEG-2 training set (40 subjects) against using 29 subjects which excludes the no new lesion cases.
3.3.6. Sources of failure
We carry out a qualitative investigation on the test set to better understand where our method fails. In the no-new lesion cases, the proposed pipeline correctly classifies 27 out of the 28 subjects. The one misclassified (subject ID: 004) is incorrectly segmented to have 1 new lesion, which amount to 14 false positive voxels (3.875 mm3), shown in Figure 6. The segmented region has a higher intensity compared to surrounding regions and we suspect that it is likely to be a new lesion. Two of four expert raters also delineate this region as a new lesion, although the consensus segmentation does not regards this as a lesion, which leads to the misclassification of our method. This test set subject is the cause of the undesired increase in false positive lesion count and false positive lesion volume in Table 3.
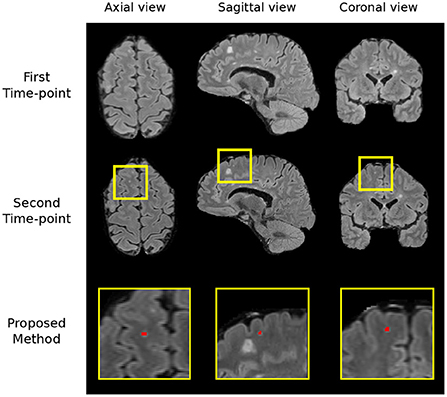
Figure 6. The region which we incorrectly classify as a lesion in the no-new lesion cases in the MSSEG-2 test set (subject ID: 004). We suspect the segmented region to be a new lesion, two of the human raters also classify this region as a new lesion.
In the new lesion cases, when assessing against the DSC and F1 score, there is still room for improvement in performance. There are possibly three sources of failure that affect the DSC and F1 scores. The first is the incorrect segmentation of growing lesions. The pipeline employs affine and non-rigid registration to align the baseline scan to the follow-up and thus suppresses the detection of growing lesions. However, the remaining mis-alignment for some growing lesions still leads to the boundary voxels, i.e., the grown regions of lesions, being incorrectly segmented as new lesions. Secondly, the proposed pipeline may miss some tiny and less apparent new lesions. In some cases, new lesions which form in the follow-up scan are very small and less hyperintense compared to large new lesions. This makes the detection of these lesions very difficult and leads to misclassifications. Finally, new lesion segmentation is a generally challenging task even for human raters and there are indiscrepancies between annotations from different human experts. The noise in the annotations may limit what an automated method can achieve (Zhang et al., 2020). We present examples of all three sources of failure in Figure 7.
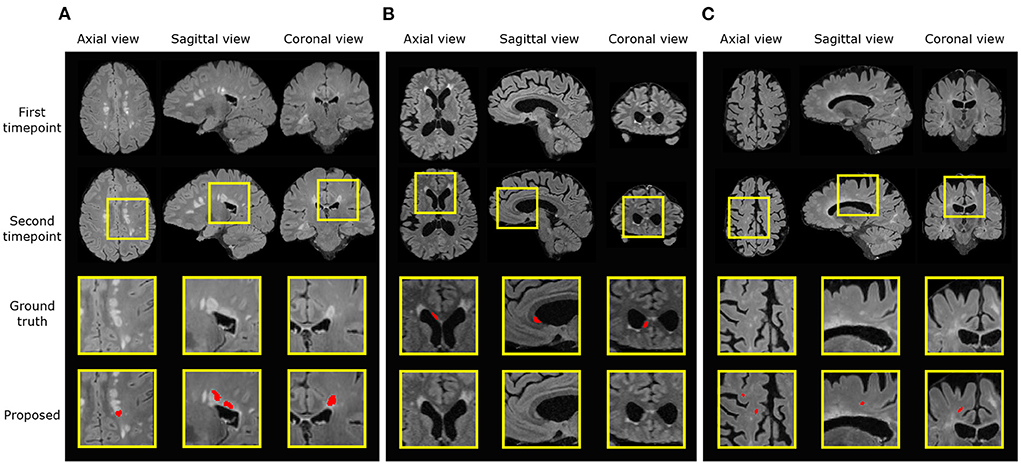
Figure 7. Examples of three different sources of error. Ground truth and predicted lesions are delineated in red. (A) (subject ID: 012) False positive segmentation of a growing lesion. (B) (subject ID: 078) False negative classification of a new lesion. (C) (subject ID: 036) False positive segmentation of a region classified as healthy/not-new in the consensus label, but annotated as a new lesion in two of the four provided expert annotations.
4. Discussion and conclusion
Here we demonstrate that by incorporating appropriate preprocessing steps, an nnU-net segmentation network, imaging and lesion-aware data augmentation techniques, we can achieve promising performance in new MS lesion segmentation tasks. The proposed pipeline outperforms other challenge participating methods in both new lesion cases and no-new lesion cases, in terms of DSC, F1, nFP and VFP scores. We also observe that in terms of network architecture, the recently popular transformer architectures may not necessarily outperform convolutional neural network architectures, such as nnU-net (Table 2). The design of proper pre-processing steps and problem-specific augmentations may play a more important role in this particular lesion segmentation task (Table 3).
In addition to the DSC and F1 score used by the MSSEG-2 challenge, we introduce extra evaluation metrics, nTP, nFP, and nFN, for the new lesion cases to understand the method performance. While many methods have a high nTP and a lower nFN score, the results suggest that a lower nFP is what differentiates our method and the Experts to the other methods, thus providing a higher DSC and F1 score. The nTP, nFP, and nFN results also suggest that they should be analyzed with respect to each other, as evaluating a method solely with one of these metrics can be misleading. For example, the top performing method in correctly identified average true positive lesions, nTP, ranks 10th in DSC score, and the top performing method in fewest average false positive lesion count ranks 17th in both DSC and F1 score. Methods with higher nTP score also have high nFP scores, with respect to Experts' performance. The results on the new metrics show that methods differ on their approach to achieve optimal DSC and F1 scores, and suggest that extra thought should be considered when evaluating a method solely on one metric.
Future efforts to improve the proposed method include further investigation of the sources of failure described in Section 3.3.6 and bridging the gap between automatic segmentation and expert raters. The current MSSEG-2 challenge dataset only contains annotations of new lesions. To discriminate new lesions from growing lesions, future works may include curating a dataset of both lesion types and training automated methods for detecting and differentiating these lesions. Also, additional post-processing steps could be developed to inspect local neighborhoods of detected new lesions and check whether they are connected to existing lesions or not, thus decreasing false positives for new lesion detection. However, too large of a local context may come at the cost of decreasing true positives too. Furthermore, the proposed pipeline only focuses on lesions in the brain region and the pre-processing step removes the spinal cord region. Despite the MSSEG-2 testing dataset not featuring any new lesions in the spinal cord, MS lesions can form in this region. Inclusion of the spinal cord into the preprocessing step and training data will extend the application of the proposed pipeline.
In conclusion, we propose an nnU-Net-based pipeline for multiple sclerosis new lesion segmentation. A contribution of the pipeline is that it incorporates task-specific data augmentation methods, including axial subsampling, which simulates MRI acquisition-based image artifacts, and CarveMix, which increases the diversity of lesion images. When evaluating on the MSSEG-2 dataset, the proposed pipeline achieves excellent performance in evaluation metrics for both new lesion and no-new lesion cases.
Data availability statement
The original contributions presented in the study are included in the article/supplementary material, further inquiries can be directed to the corresponding authors.
Author contributions
BB conducted all experiments and drafted the manuscript. WB provided significant assistance in technical issues and writing. PM provided guidance for the direction of research. All authors approved the final manuscript.
Funding
This work is supported by the UKRI CDT in AI for Healthcare http://ai4health.io (Grant No. EP/S023283/1).
Acknowledgments
The authors would like to acknowledge France Life Imaging (FLI), the National Institute for Research in Digital Science and Technology (Inria), and thank all individuals involved in organizing the MSSEG-2 challenge and preparing the MSSEG-2 dataset.
Conflict of interest
The authors declare that the research was conducted in the absence of any commercial or financial relationships that could be construed as a potential conflict of interest.
Publisher's note
All claims expressed in this article are solely those of the authors and do not necessarily represent those of their affiliated organizations, or those of the publisher, the editors and the reviewers. Any product that may be evaluated in this article, or claim that may be made by its manufacturer, is not guaranteed or endorsed by the publisher.
Footnotes
1 Anima scripts: RRID:SCR_017072, https://anima.irisa.fr.
2 Anima scripts: RRID:SCR_017072, https://anima.irisa.fr.
3 Anima scripts: RRID:SCR_017072, https://anima.irisa.fr.
References
Alzubaidi, L., Zhang, J., Humaidi, A. J., Al-dujaili, A., Duan, Y., Al-Shamma, O., et al. (2021). Review of deep learning: concepts, cnn architectures, challenges, applications, future directions. J. Big Data 8, 53. doi: 10.1186/s40537-021-00444-8
Aslani, S., Dayan, M., Storelli, L., Filippi, M., Murino, V., Rocca, M. A., et al. (2019). Multi-branch convolutional neural network for multiple sclerosis lesion segmentation. Neuroimage 196, 1–15. doi: 10.1016/j.neuroimage.2019.03.068
Berthelot, D., Carlini, N., Goodfellow, I., Papernot, N., Oliver, A., and Raffel, C. (2019). Mixmatch: a holistic approach to semi-supervised learning. arXiv preprint arXiv:1905.02249. doi: 10.48550/arXiv.1905.02249
Birenbaum, A., and Greenspan, H. (2017). Multi-view longitudinal CNN for multiple sclerosis lesion segmentation. Eng. Appl. Artif. Intell. 65, 111–118. doi: 10.1016/j.engappai.2017.06.006
Carass, A., Roy, S., Jog, A., Cuzzocreo, J. L., Magrath, E., Gherman, A., et al. (2017). Longitudinal multiple sclerosis lesion segmentation: resource and challenge. Neuroimage 148, 77–102. doi: 10.1016/j.neuroimage.2016.12.064
Chai, Y., Xu, B., Zhang, K., Lepore, N., and Wood, J. C. (2020). Mri restoration using edge-guided adversarial learning. IEEE Access 8, 83858–83870. doi: 10.1109/ACCESS.2020.2992204
Chen, J., Lu, Y., Yu, Q., Luo, X., and Adeli, E. (2021). “Transunet: transformers make strong encoders for medical image segmentation,” in ICML 2021 Interpretable Machine Learning in Healthcare Workshop.
Çiçek, Ö., Abdulkadir, A., Lienkamp, S. S., Brox, T., and Ronneberger, O. (2016). “3D U-net: learning dense volumetric segmentation from sparse annotation,” in MICCAI (Athens).
Commowick, O., Cervenansky, F., Cotton, F., and Dojat, M. (2021a). “Multiple sclerosis new lesions segmentation challenge using a data management and processing infrastructure,” in MICCAI 2021 MSSEG-2 Challenge Proceedings (Strasbourg), 126.
Commowick, O., Istace, A., Kain, M., Laurent, B., Leray, F., et al. (2018). Objective evaluation of multiple sclerosis lesion segmentation using a data management and processing infrastructure. Sci. Rep. 8, 13650. doi: 10.1038/s41598-018-31911-7
Commowick, O., Masson, A., Combes, B., Camarasu-Pop, S., Cervenansky, F., Kain, M., et al. (2021b). MICCAI 2021 MSSEG-2 challenge quantitative results [Data set]. Zenodo. doi: 10.5281/zenodo.5775523
Commowick, O., Masson, A., Combes, B., Camarasu-Pop, S., Cervenansky, F., Kain, M., et al. (2022). MICCAI 2021 MSSEG-2 challenge demographics data [Data set]. Zenodo. doi: 10.5281/zenodo.5824568
Doshi, J., Erus, G., Ou, Y., Gaonkar, B., and Davatzikos, C. (2013). Multi-atlas skull-stripping. Acad. Radiol. 20, 1566–1576. doi: 10.1016/j.acra.2013.09.010
Dosovitskiy, A., Beyer, L., Kolesnikov, A., Weissenborn, D., Zhai, X., et al. (2021). “An image is worth 16x16 words: transformers for image recognition at scale,” in International Conference on Learning Representations.
Filippi, M., Preziosa, P., Banwell, B. L., Barkhof, F., Ciccarelli, O., De Stefano, N., et al. (2019). Assessment of lesions on magnetic resonance imaging in multiple sclerosis: practical guidelines. Brain 142, 1858–1875. doi: 10.1093/brain/awz144
Ghasemi, N., Razavi, S., and Nikzad, E. (2017). Multiple sclerosis: pathogenesis, symptoms, diagnoses and cell-based therapy citation: Ghasemi N, Razavi Sh, Nikzad E. Multiple sclerosis: pathogenesis, symptoms, diagnoses and cell-based therapy. Cell J. 19, 1–10. doi: 10.22074/cellj.2016.4867
Goodfellow, I., Pouget-Abadie, J., Mirza, M., Xu, B., Warde-Farley, D., et al. (2014). “Generative adversarial nets,” in Neural Information Processing Systems, Vol. 27.
Hatamizadeh, A., Yang, D., Roth, H. R., and Xu, D. (2022). “Unetr: transformers for 3d medical image segmentation,” in Winter Conference on Applications of Computer Vision (WACV) (Hawaii, HI), 1748–1758.
Hong, S., Marinescu, R., Dalca, A. V., Bonkhoff, A. K., Bretzner, M., Rost, N. S., et al. (2021). “3D-StyleGAN: a style-based generative adversarial network for generative modeling of three-dimensional medical images,” in Deep Generative Models, and Data Augmentation, Labelling, and Imperfections, eds S. Engelhardt, I. Oksuz, D. Zhu, Y. Yuan, A. Mukhopadhyay, N. Heller, S. X. Huang, H. Nguyen, R. Sznitman, and Y. Xue (Cham: Springer International Publishing), 24–34.
Isensee, F., Jaeger, P. F., Kohl, S. A. A., Petersen, J., and Maier-Hein, K. H. (2021a). nnu-net: a self-configuring method for deep learning-based biomedical image segmentation. Nat. Methods 18, 203–211. doi: 10.1038/s41592-020-01008-z
Isensee, F., Jager, P., Wasserthal, J., Zimmerer, D., Petersen, J., Kohl, S., et al. (2020). batchgenerators - a python framework for data augmentation (0.19.6). Zenodo. doi: 10.5281/zenodo.3632567
Isensee, F., Jäger, P. F., Full, P. M., Vollmuth, P., and Maier-Hein, K. H. (2021b). “nnu-net for brain tumor segmentation,” in Brainlesion: Glioma, Multiple Sclerosis, Stroke and Traumatic Brain Injuries, eds A. Crimi and S. Bakas (Cham: Springer International Publishing), 118–132.
Kamraoui, R. A., Ta, V.-T., Manjon, J. V., and Pierrick, C. (2021). “Image quality data augmentation for new MS lesion segmentation,” in MICCAI 2021 MSSEG-2 Challenge Proceedings (Strasbourg), 37.
Kamraoui, R. A., Ta, V.-T., Tourdias, T., Mansencal, B., Manjon, J. V., and Coupé, P. (2022). DeepLesionBrain: towards a broader deep-learning generalization for multiple sclerosis lesion segmentation. Med. Image Anal. 76, 102312. doi: 10.1016/j.media.2021.102312
McKinley, R., Wepfer, R., Grunder, L., Aschwanden, F., Fischer, T., et al. (2020). Automatic detection of lesion load change in Multiple Sclerosis using convolutional neural networks with segmentation confidence. Neuroimage Clin. 25, 102104. doi: 10.1016/j.nicl.2019.102104
MIRTK (2021). Medical Image Registration ToolKit (MIRTK). Available online at: https://mirtk.github.io/.
Rahman, M. M., and Davis, D. N. (2013). Addressing the class imbalance problem in medical datasets. Int. J. Mach. Learn. Comput. 3, 224–228. doi: 10.7763/IJMLC.2013.V3.307
Ronneberger, O., Fischer, P., and Brox, T. (2015). “U-net: convolutional networks for biomedical image segmentation,” in International Conference on Medical Image Computing and Computer-Assisted Intervention (Munich), 234–241.
Sandfort, V., Yan, K., Yan, K., Pickhardt, P. J., and Summers, R. M. (2019). Data augmentation using generative adversarial networks (cyclegan) to improve generalizability in ct segmentation tasks. Sci. Rep. 9, 16884. doi: 10.1038/s41598-019-52737-x
Shin, H.-C., Tenenholtz, N. A., Rogers, J. K., Schwarz, C. G., Senjem, M. L., Gunter, J. L., et al. (2018). “Medical image synthesis for data augmentation and anonymization using generative adversarial networks,” in Simulation and Synthesis in Medical Imaging, eds A. Gooya, O. Goksel, I. Oguz, and N. Burgos (Cham: Springer International Publishing), 1–11.
Thompson, A. J., Banwell, B. L., Barkhof, F., Carroll, W. M., Coetzee, T., Comi, G., et al. (2018). Diagnosis of multiple sclerosis: 2017 revisions of the McDonald criteria. Lancet Neurol. 17, 162–173. doi: 10.1016/S1474-4422(17)30470-2
Tousignant, A., Lemaître, P., Precup, D., Arnold, D. L., and Arbel, T. (2019). “Prediction of disease progression in multiple sclerosis patients using deep learning analysis of mri data,” in International Conference on Medical Imaging with Deep Learning, volume 102 of Proceedings of Machine Learning Research (London), 483–492.
Tustison, N. J., Avants, B. B., Cook, P. A., Zheng, Y., Egan, A., Yushkevich, P. A., et al. (2010). N4itk: improved n3 bias correction. IEEE Trans. Med. Imaging 29, 1310–1320. doi: 10.1109/TMI.2010.2046908
Valverde, S., Cabezas, M., Roura, E., González-Villa,̀, S., Pareto, D., Vilanova, J. C., et al. (2017). Improving automated multiple sclerosis lesion segmentation with a cascaded 3D convolutional neural network approach. Neuroimage 155, 159–168. doi: 10.1016/j.neuroimage.2017.04.034
Wang, W., Chen, C., Ding, M., Yu, H., Zha, S., and Li, J. (2021). “TransBTS: multimodal brain tumor segmentation using transformer,” in International Conference on Medical Image Computing and Computer-Assisted Intervention (Strasbourg), 109–119.
Weiner, H. L., Guttmann, C. R., Khoury, S. J., Orav, E. J., Hohol, M. J., Kikinis, R., et al. (2000). Serial magnetic resonance imaging in multiple sclerosis: correlation with attacks, disability, and disease stage. J. Neuroimmunol. 104, 164–173. doi: 10.1016/S0165-5728(99)00273-8
Yun, S., Han, D., Oh, S. J., Chun, S., Choe, J., and Yoo, Y. (2019). “Cutmix: regularization strategy to train strong classifiers with localizable features,” in Proceedings of the IEEE/CVF International Conference on Computer Vision (Seoul: IEEE), 6023–6032.
Zhang, H., Cisse, M., Dauphin, Y. N., and Lopez-Paz, D. (2018). “MixUp: beyond empirical risk minimization,” in International Conference on Learning Representations (Vancouver, BC).
Zhang, H., Valcarcel, A. M., Bakshi, R., Chu, R., Bagnato, F., Shinohara, R. T., et al. (2019). “Multiple sclerosis lesion segmentation with tiramisu and 2.5 d stacked slices,” in International Conference on Medical Image Computing and Computer-Assisted Intervention (Shenzhen), 338–346.
Zhang, L., Tanno, R., Xu, M.-C., Jin, C., and Jacob, J. (2020). “Disentangling human error from ground truth in segmentation of medical images,” in Neural Information Processing Systems, Vol. 33, 15750–15762.
Keywords: multiple sclerosis, new lesion detection, data augmentation, nnU-Net, MRI, longitudinal lesion segmentation, biomedical segmentation
Citation: Basaran BD, Matthews PM and Bai W (2022) New lesion segmentation for multiple sclerosis brain images with imaging and lesion-aware augmentation. Front. Neurosci. 16:1007453. doi: 10.3389/fnins.2022.1007453
Received: 30 July 2022; Accepted: 06 October 2022;
Published: 21 October 2022.
Edited by:
Olivier Commowick, Inria Rennes-Bretagne Atlantique Research Centre, FranceReviewed by:
Erin Savner Beck, Icahn School of Medicine at Mount Sinai, United StatesPaul Eichinger, Helios Klinikum München West, Germany
Copyright © 2022 Basaran, Matthews and Bai. This is an open-access article distributed under the terms of the Creative Commons Attribution License (CC BY). The use, distribution or reproduction in other forums is permitted, provided the original author(s) and the copyright owner(s) are credited and that the original publication in this journal is cited, in accordance with accepted academic practice. No use, distribution or reproduction is permitted which does not comply with these terms.
*Correspondence: Berke Doga Basaran, bdb19@ic.ac.uk