 Kyler Hodgson1
 Ganesh Adluru1,2
 Lorie G. Richards3
 Jennifer J. Majersik4Greg Stoddard5
 Nagesh Adluru6
 Edward DiBella1,2*
- 1Department of Biomedical Engineering, University of Utah, Salt Lake City, UT, United States
- 2Department of Radiology and Imaging Sciences, Utah Center for Advanced Imaging Research, University of Utah, Salt Lake City, UT, United States
- 3Department of Occupational and Recreational Therapies, University of Utah, Salt Lake City, UT, United States
- 4Department of Neurology, University of Utah, Salt Lake City, UT, United States
- 5Divison of Epidemiology, Department of Internal Medicine, University of Utah, Salt Lake City, UT, United States
- 6Waisman Center, University of Wisconsin, Madison, WI, United States
Improved understanding of neuroimaging signal changes and their relation to patient outcomes after ischemic stroke is needed to improve ability to predict motor improvement and make therapy recommendations. The posterior limb of the internal capsule (PLIC) is a hub of afferent and efferent motor signaling and this work proposes new, image-based methods for prognosis based on interhemispheric differences in the PLIC. In this work, nine acute supratentorial ischemic stroke patients with motor impairment received a baseline, 203-direction diffusion brain MRI and a clinical assessment 3–12 days post-stroke and were compared to nine age-matched healthy controls. Asymmetries based on the mean and Kullback-Leibler divergence in the ipsilesional and contralesional PLIC were calculated for diffusion tensor imaging (DTI) and diffusion spectrum imaging (DSI) measures from the baseline MRI. Predictions of upper extremity Fugl-Meyer (FM) scores at 5-weeks follow-up from baseline measures of PLIC asymmetry in diffusion tensor imaging (DTI) and diffusion spectrum imaging (DSI) models were evaluated. For the stroke participants, the baseline asymmetry measures in the PLIC for the orientation dispersion index of the neurite orientation dispersion and density imaging (NODDI) model were highly correlated with upper extremity FM outcomes (r2 = 0.83). Use of DSI and the NODDI orientation dispersion index parameter shows promise of being more predictive of stroke recovery and to help better understand white matter changes in stroke, beyond DTI measures. The new finding that baseline interhemispheric differences in the PLIC calculated from the orientation dispersion index of the NODDI model are highly correlated with upper extremity functional outcomes may lead to improved image-based motor-outcome prediction after middle cerebral artery ischemic stroke.
Introduction
After the acute phase of an ischemic stroke, the best course of treatment is often not clear. While measures such as baseline disability levels, age at stroke onset, infarct volume, and lesion location are used in predicting general stroke recovery outcomes, they are not used in predicting specific motor function outcomes such as upper extremity (UE) scores (1). Prognosis of post-stroke recovery is needed but remains imprecise. For example, clinicians do not know which patients can expect benefit from motor rehabilitation, nor whether to focus therapy efforts on restoring motor function or teaching compensatory strategies. Recommendations for therapy to improve UE function would benefit from more accurate methods during the first weeks post-stroke to predict potential for motor recovery. Many researchers have argued for the development of biomarkers to predict such recovery (2), with neuroimaging biomarkers being the most studied. The most common neuroimaging biomarkers studied for their ability to predict post-stroke UE recovery have been those measuring the integrity of corticospinal tract white matter (3–10).
Analysis of white matter integrity has most commonly been done with DTI measures such as fractional anisotropy (FA), mean diffusivity (MD), radial diffusivity, and axial diffusivity (AD). These measures have shown modest correlation with stroke outcomes (3, 4, 7–9). Furthermore, when paired with transcranial magnetic stimulation, DTI based measures have demonstrated clinical utility in stroke outcome prediction (6, 9). However, there remain many problems with clinical implementation of these approaches, from insufficient accuracy in prediction to the time-intensive nature of these assessments. Some of the inaccuracy of these methods stems from the limitations of DTI in discerning white matter integrity in regions of crossing fibers, trauma, and axonal remodeling (11, 12). Higher order diffusion methods with MRI may be able to provide greater prediction accuracy.
Diffusion Spectrum Imaging (DSI) Models for Stroke Prognosis
MRI measures derived from diffusion spectrum imaging (DSI) using generalized fractional anisotropy (GFA) show promise to assess the integrity of the corticospinal tract (CST) and to predict motor function recovery. DSI may overcome the limitations of DTI and add useful detail regarding the extent of white matter degeneration in regions affected by stroke. If measures derived from DSI models provide better estimation of white matter integrity indicative of improved potential for motor function recovery, an image-only based prognosis system may be realized. At the very least, combination approaches of TMS and MRI for prognosis should be improved by DSI models with a fast acquisition scheme.
DSI generalizes DTI by acquiring more directions in q-space either through high angular resolution diffusion imaging (HARDI) shells, q-ball imaging or a cube on a Cartesian grid (13, 14). DSI is thought to better estimate areas of crossing or kissing fibers, demyelination (15), and axonal remodeling (16) missed in DTI. A popular measure estimated from DSI data and previously used to predict stroke outcome based on changes in white matter (5, 16, 17) is GFA. GFA is described as the standard deviation of diffusion directions in a voxel and is the DSI analog of the DTI derived parameter FA.
Rationale Behind NODDI for Stroke
NODDI is a multi-compartment model that differs from prior models in that it estimates the intracellular and extracellular contributions to the signal in terms of neurite morphology. This means that the extracellular components of the signal are estimated in terms of the intracellular components, instead of separately estimating the compartments, or treating them as a single compartment. Such a multi-compartmental approach is thought to be useful in discerning areas of crossing fibers (15). NODDI parameters may also better estimate the integrity of white matter in the subacute phase of stroke when Wallerian degeneration and processes involving reactive astrocytes and microglia that lead to glial scarring are occurring (18).
Aims
In this work, the efficacy of measures from multi-compartment and high-angular resolution models in predicting upper extremity motor function recovery in stroke patients was examined using data from a fast DSI acquisition scheme. (a) We first aimed to understand how ipsilesional and contralesional regions of the CST in participants with stroke deviate from controls (b) Next, we evaluated the ability to predict motor function outcomes at 5-week follow-up from measures of asymmetry in regions of the CST in a baseline scan. (c) Last, we investigated the association of baseline lesion size and CST lesion load with motor function outcomes.
Materials and Methods
Participant Selection and Clinical Assessments
This study was carried out in accordance with the recommendations of Department of Health and Human Services (DHHS) and Food and Drug Administration (FDA). The protocol was approved by the Institutional Review Board at the University of Utah (assurance number FWA00003745 - U of Utah). All subjects gave written informed consent in accordance with the Declaration of Helsinki.
Stroke patients were recruited through the University of Utah Stroke Center at the University of Utah hospital. Patient inclusion criteria were: (1) supratentorial, imaging confirmed, ischemic stroke; (2) sufficient upper extremity weakness with some voluntary movement ability; (3) baseline Fugl-Meyer (FM) Upper Extremity (UE) score ≤50 and FM Lower Extremity score ≤28; and (4) MRI scan taken >2 days and <2 weeks from stroke onset. FM assessments were performed by an occupational therapist within 2 weeks of the stroke date and 1 ± 3 days from the date of the baseline MRI scan. Follow-up Fugl-Meyer assessment was performed a mean ± standard deviation of 38 ± 9 days post-stroke for all subjects. This follow-up assessment we refer to as tp2, and, when referring to the Upper-Extremity FM scores, as FM UE tp2. Change in FM UE was defined as the difference between FM UE tp2 and FM UE baseline. See Appendix for summary of stroke patient data.
Non-stroke participants of similar age to stroke participants were recruited by the Department of Radiology and Imaging Sciences Research Staff. Control participants had no known history of neurological disorders.
All patients received usual neurologic and rehabilitation care and either sildenafil, memantine, or a placebo after undergoing a baseline MRI scan. Data were blinded to interventional information for this analysis since the intent was to determine whether a baseline scan has predictive value of eventual motor recovery, regardless of treatment.
Data Acquisition
Fully sampled DSI data were acquired with equal spacing in q-space on a cartesian grid in 203 directions with a maximum b-value of 4,000 s·mm−2 for the 9 stroke participants and 9 non-stroke participants on a Siemens 3T Verio scanner using a 32 channel head coil 3–12 days post-stroke (19). A second scan was acquired 38 ± 9 days post-stroke for 8 participants. For all scans, a simultaneous multi-slice blipped controlled aliasing sequence (20) with a slice acceleration factor of three was employed. The scan parameters were TR = 3.7 s, TE = 114.2 ms, number of slices = 51, slice thickness of 2.1 mm, FOV 250 mm2, voxel dimensions 1.9 × 1.9 × 2.1 mm3, and a total data acquisition time of 12–13 min.
Data Processing
First, skull stripping was performed on the reconstructed images using the brain extraction tool in (21). Noise was removed by identifying the noise-only principal components for local neighborhoods of voxels, the bulk of which are described by the universal Marchenko-Pastur distribution (22). Correction for noise-induced bias resulting from high diffusion weighting was done by transforming the magnitude of the signals to Gaussian signals according to (23, 24). Gibb's ringing was corrected by implementing software (25) that re-interpolated the image based on local, subvoxel-shifts to sample the ringing pattern at the zero-crossings of an oscillating sinc-function (26). Last, magnetic field inhomogeneities and eddy current induced distortion were corrected using the eddy_openmp command (27). These signal processing steps help remove many of the distortions and biases, enabling accurate estimation of the microstructural features. MATLAB 2017a was used to wrap all the processing steps to be executable from a single script.
Following the processing steps, the diffusion tensor elements were estimated using non-linear optimization with positive definiteness constraints on the tensors using CAMINO (28) from which FA, MD, AD, and RD maps were calculated (Figure 1). The orientation distribution functions were estimated using DIPY (17, 29) for calculating GFA. The NODDI model was fit to the data using the NODDI MATLAB toolbox with default parameters (15, 30).
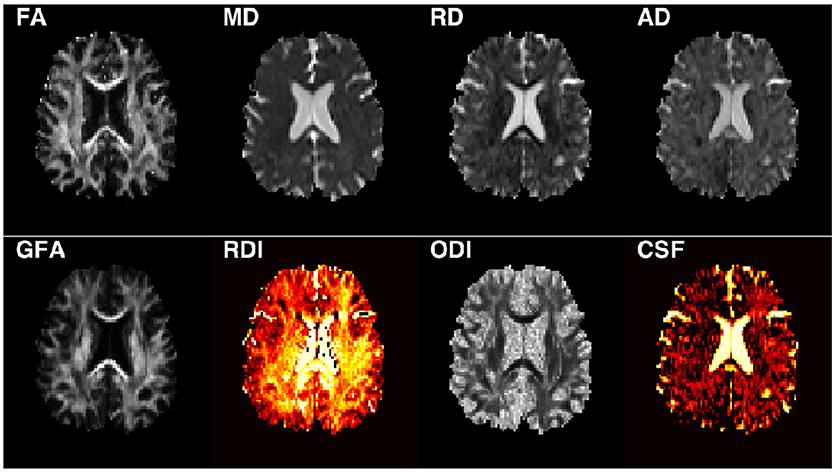
Figure 1. Example of a stroke subject image for each parameter investigated.
Corticospinal Tract Label Estimation
Labels for white matter structures in the brain were estimated for all non-stroke and stroke scans, by warping the FA maps to fit the Johns Hopkins University FA 2.0 mm atlas (31, 32) using Advanced Normalization Tools (32, 33). Individual labels for the corona radiata, posterior limb of the internal capsule (PLIC), and cerebral peduncle, were identified and used in subsequent analysis.
Analysis
Deviation of Stroke Corticospinal Tract From Control
The mean values in the cerebral peduncle, PLIC, and corona radiata for each DTI and DSI parameter were calculated for all participants. A paired two-tailed t-test was performed in the cerebral peduncle, PLIC and corona radiata to determine whether significant hemispheric differences exist in controls in any region of the CST. In participants with stroke, a paired two-tailed t-test was performed for ipsilesional vs. contralesional segments of the CST. Last, significant differences between ipsilesional regions of the CST in participants with stroke and the CST in controls were investigated through two-sample two-tailed heteroscedastic t-test for each imaging parameter. P-values were adjusted for multiple comparisons using Holm's multiplicity adjustment, which controls the type I error without the need to first test the global hypothesis with ANOVA.
Calculation of Microstructural Asymmetries in Baseline Stroke Corticospinal Tract
Because most prior studies report the PLIC to be the most important region of the CST in image-based motor function prognosis, the next steps of the analysis assessing the potential for DSI and DTI image-based motor function prognosis were focused on the PLIC.
Two different approaches were used to calculate the asymmetries for the PLIC for each DTI and DSI parameter map in each participant: (1) the interhemispheric mean difference, referred to as ΔPLICMean and defined as,
where is the mean value in the ipsilesional PLIC, and is the mean value in the contralesional PLIC; and (2) the Kullback-Leibler Divergence (KLD), referred to as ΔPLICKLD and defined as,
where I is the distribution of values in the ipsilesional PLIC, and C is the distribution in the contralesional PLIC. ΔPLICKLD was calculated in R version 3.3.2 using 10 bins with the command KL.shrink from the entropy library (34). The KLD calculates an unbounded (0-Inf) logarithmic difference that provides a more complete estimate of the divergence of distribution C from distribution I than only a comparison of means.
It was hypothesized that a greater divergence in the baseline ipsilesional and contralesional PLIC distributions would correlate with worse functional outcomes at tp2. To test this hypothesis, the correlations of ΔPLICMean and the log transform of ΔPLICKLD with FM UE tp2 and change in FM UE were evaluated using a combination approach. To push the limits of the small sample size, six points were selected as a training set, and three points left out for every possible combination of the data resulting in 84 repetitions. A linear regression line was then fit to each training set. The line of best fit was calculated by finding the normalized root mean square error for the test cases that produced the mean normalized root mean square error. The final normalized root mean square error reported in the results was computed for the line of best fit with all 9 data points. The optimism adjusted coefficient of determination (r2) was calculated by subtracting the difference of the r2 for each training set from the r2 of the full data set. The mean value of these differences was then subtracted from the r2 of the full data set and is the r2 reported.
Stroke ROI and Lesion Load of Corticospinal Tract
For each data set, the stroke region(s) of interest (ROIs) were confirmed from the radiologist report and the stroke ROIs manually drawn on DWI trace-weighted images in Seg3D (SCI) (Figure 2). The correlation of the lesion volume with baseline FM UE, FM UE tp2, and change in FM UE outcomes was then calculated. To calculate the baseline lesion load of the CST, the percent overlap of the stroke ROI with the Johns Hopkins University FA 2.0 mm atlas white matter labels for the corona radiata, PLIC, and cerebral peduncle was found. To evaluate the extent to which measures of asymmetry in the PLIC were affected by stroke location and the potential of baseline CST lesion load in motor outcome prediction, the correlation of the lesion load of each segment of the ipsilesional CST with baseline FM UE, FM UE tp2, and change in FM UE outcomes was calculated.
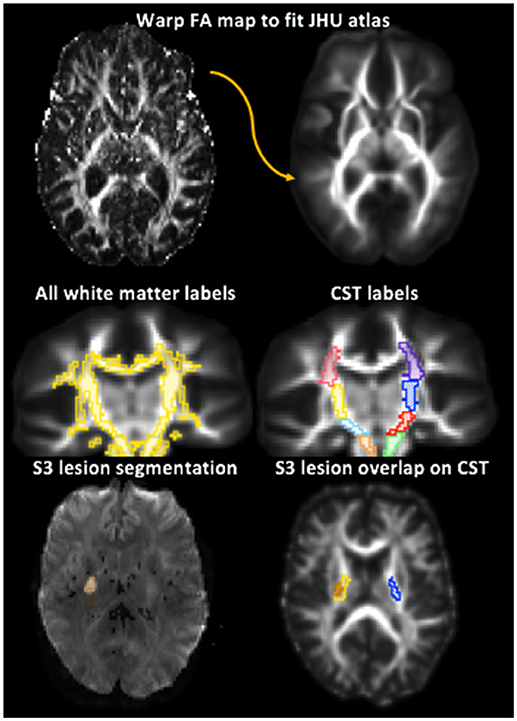
Figure 2. Depiction of white matter label transformation and segmentation of ipsilesional and contralesional stroke region of interest (ROI). Top: The Fractional Anisotropy (FA) map for each subject was warped to the Johns Hopkins University FA 2.0 mm Atlas. Middle left: The white matter labels were then transformed from the JHU atlas to the warped FA map. Middle right: Corticospinal tract (CST) regions were identified from the white matter labels. The PLIC is in yellow and blue. Bottom left: Stroke lesion ROI manually segmented. Bottom right: lesion load of the PLIC portion of the CST for stroke participant 3 (S3) shown by the overlap of the lesion ROI on the white matter labels. Lesion is shown in orange, right PLIC in yellow, and left PLIC in blue.
Results
Subjects
The 9 participants with stroke were 69 ± 8.5 years in age and 44% were female. The 9 non-stroke participants were 67 ± 3.2 years in age and 11% were female. Strokes were of small-to-moderate size: volume of 12.04 ± 21.26 cc3 (range 0.51–66.65). Clinically, participants with stroke had an initial mean FM UE score of 22 ± 14.9 (range 5–50) and improved by tp2 to a mean FM UE score of 35.8 ± 18.8 (range 5–60). Seven of the nine patients improved with one showing no change and one worsening (Figure 3).
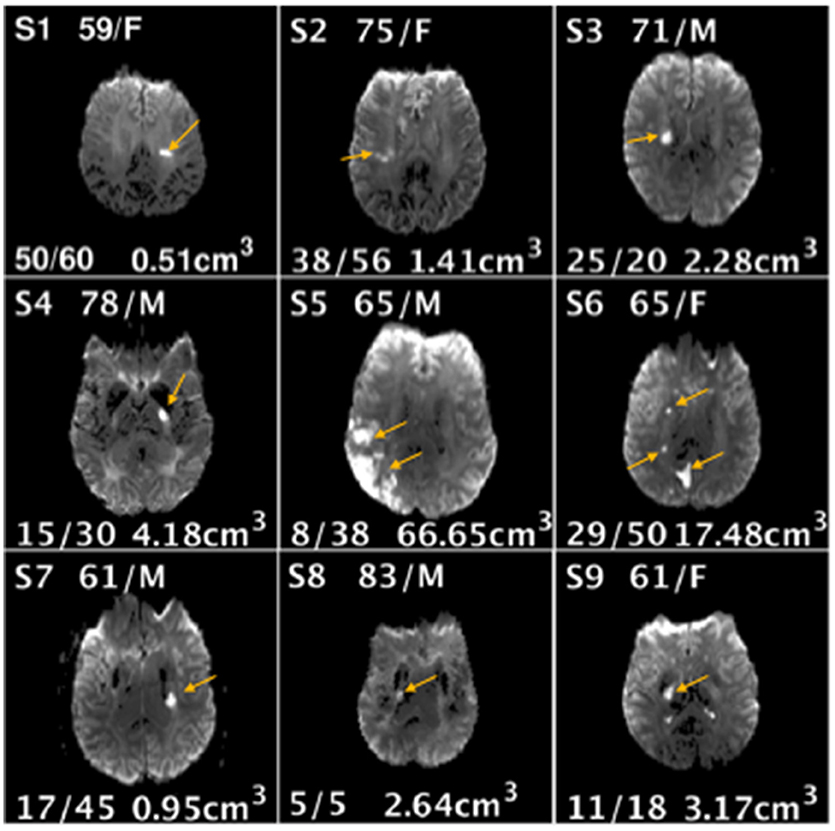
Figure 3. Demographic information age/gender (top center), Fugl-Meyer Upper Extremity scores at baseline and follow-up (bottom left), lesion volume (bottom right), and location (image shown) for each stroke subject (S1-S9).
Deviation of Stroke PLIC From Control
Using Holm's adjusted p-values, the left and right regions of the CST were not significantly different in any control participant. The ipsilesional PLIC was significantly different from the contralesional PLIC in stroke participants in ODI[tstat(DoF), p-value: t(8) = 3.24, p = 0.0118], GFA [t(8) = −3.52, p = 0.0077), FA [t(8) = −3.59, p = 0.0071], and AD[t(8) = −3.40, p = 0.0094]. Only FA showed a significant difference between hemispheres in the corona radiata t(8) = −3.25, p = 0.0361. The contralesional segments of the stroke CST were not significantly from controls in the cerebral peduncle, PLIC, or corona radiata.
Relation of Asymmetries in Baseline Stroke Corticospinal Tract to Functional Outcome
The optimism adjusted coefficient of determination after validation through combination testing showed encouraging results. The highest correlation for the mean difference with FM UE tp2 was ODI ΔPLICMean (r2 = 0.83, rmse = 0.054, Figure 4). GFA ΔPLICMean (r2 = 0.57, rmse = 0.099) also showed notable correlation with FM UE tp2. For the KLD measures, GFA ΔPLICKLD (r2 = 0.57, rmse = 0.097), RDI ΔPLICKLD (r2 = 0.70, rmse = 0.077), and ODI ΔPLICKLD (r2 = 0.81, rmse = 0.057) all had high correlation. The highest correlation with change in FM UE was for ODI ΔPLICMean (r2 = 0.49, rmse = 0.175). The coefficient of determination of all other imaging measures with functional outcomes was below 0.5.
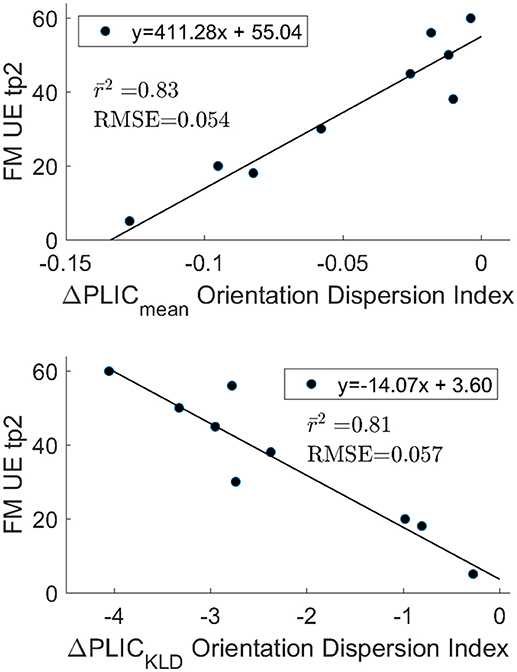
Figure 4. Optimism adjusted r2 after 84 permutations of n choose 6. The ΔPLICmean (top) and ΔPLICKLD (bottom) are highly correlated with functional outcomes and are in agreement with one another. The mean RMSE for the test data sets is also reported. The strong correlation observed between outcomes and the differences in ODI between hemispheres in the PLIC does not appear to be driven by extreme values for FM UE tp2 or ODI.
Stroke Lesion Size and Lesion Load of CST
Baseline stroke lesion volume was not significantly correlated with baseline FM UE (r2 = 0.17 p = 0.28), FM UE tp2 (r2 = −0.01, p = 0.98), or change in FM UE (r2 = 0.24, p = 0.18). Lesion load was defined as the percent of the region of interest overlapped by the stroke lesion. The lesion load of the whole CST was not significantly correlated with baseline UE (r2 = 0.03, p = 0.63), UE tp2 (r2 = 0.28, p = 0.14), or change in FM UE (r2 = 0.37, p = 0.08). The lesion loads of the corona radiata, PLIC, and cerebral peduncle were also not significantly correlated with baseline FM UE, FM UE tp2, or change in FM UE. The best correlation of lesion load with FM UE tp2 was for the PLIC (r2 = 0.35, p = 0.09).
Discussion
Our work shows potential additional utility of DSI based models in human motor stroke analysis compared to previously reported methods of image-based stroke prognosis. DSI-based analysis showed that baseline measures of PLIC hemispheric asymmetry calculated from the orientation dispersion index (ODI) parameter of the NODDI model are highly correlated with UE functional outcome. This is the first study to extensively study NODDI parameters in stroke UE outcome prediction and the results are encouraging. One reason we observed an improved outcome prediction based on ODI may be that the ODI parameter detects changes in the ipsilesional PLIC indicative of Wallerian degeneration missed by traditional DTI measures and single compartment DSI models that are not capable of fully capturing these changes in the first weeks post-stroke.
Imaging Wallerian Degeneration
Although demyelination begins in the acute phase of stroke, many studies show that significant decreases in FA, thought to reflect Wallerian degeneration, are only detectable more than 25 days after stroke (3, 35, 36) Some studies report FA can detect degeneration <16 days post-stroke (37, 38) but the extent to which FA is reduced does not appear to be highly correlated with functional outcomes. The inability to reliably detect Wallerian degeneration at early time points with FA and other DTI parameters may be due to the response of glial cells involved in glial scarring. We did notice increased FA and ODI in some regions of the ipsilesional PLIC. These parameters are not normally both elevated simultaneously and may reflect ODI sensitivity to glial scarring (Figure 5).
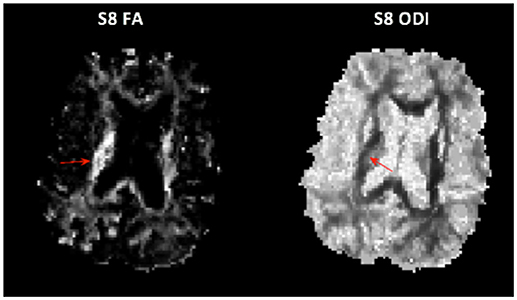
Figure 5. Unusual case of both elevated FA (Left) and elevated ODI (Right) in the PLIC in subject 8.
ODI may better capture regions of glial scarring because the NODDI model is based on a multi-compartmental model that estimates intracellular and extracellular contributions to the observed signal in terms of neurite morphology (15, 39), instead of independently as in previous models (40, 41). Due to the dependency in the model, if the orientation dispersion of the intracellular compartment is increased, that is, myelinated axons have begun to degenerate, then the estimate of extra-cellular orientation dispersion will increase as well.
Prediction of Stroke Outcomes From Baseline Asymmetries in the Posterior Limb of the Internal Capsule
DTI Estimated Asymmetries
Prior work based on DTI also found the differences in the PLIC region of the CST to be most predictive of outcomes (6, 7, 42, 43). A notable example is the PREP algorithm from Stinear et al., which utilizes a combination of FA and TMS to predict the potential upper extremity motor recovery after stroke (6). FA is used to calculate a normalized difference of mean values in the ipsilesional and contralesional PLIC called the asymmetry index, similar to ΔPLICMean defined in this study (6). They reported that the asymmetry index correlated with recovery 12 weeks after stroke (r = −0.61, p < 0.001). In comparison, measures of asymmetry in the PLIC based on ODI, such as ΔPLICKLD and ΔPLICmean from this study, showed much higher correlation. The PREP algorithm was developed from a cohort of 40 participants, and a greater number of stroke participants would be needed to demonstrate that the image-only method describedhere is a suitable alternative to the PREP algorithm. In the meantime, ODI ΔPLICKLD and ODI ΔPLICmean could complement the FA based asymmetry index and improve the PREP algorithm. Last, DSI based measures of asymmetry in the PLIC could potentially improve upon DTI measures in predicting functional outcomes in response to motor rehabilitation or drug therapy from scans taken in the chronic phase of stroke (42–45).
DSI Approaches to Stroke Outcome Prediction
Granziera et al. (5, 46), and Schulz et al. (47, 48) explored both interhemispheric and intrahemispheric differences in upper cortical regions, such as the primary motor and supplementary motor areas, shown in fMRI (49–51) to be active during recovery. In the Granziera et al. study, mean GFA in the connections between the motor cortex and subcortical structures in the contralesional hemisphere in individuals affected by stroke changed more than those in non-stroke controls. Using a multivariate regression analysis for their predictive model, baseline NIHSS scores, patient ages, and multiple mean GFA motor tract values at baseline accounted for 96 percent of the variance in NIHSS scores at 12 weeks. In this study, ODI ΔPLIC alone accounted for 83 percent of the variance in upper extremity outcomes at tp2. In (5), there was a relatively small cohort (12 stroke subjects) and therefore risked overfitting by using a multivariate approach. More study is needed to determine the performance of ODI ΔPLIC alone or included in a multivariate model.
Lin et al. expanded the GFA based motor tract analysis approach to include histogram derived measures: standard deviation, peak height, and skewness of GFA (16). The present study also benefited from the recognition that an analysis of the underlying distributional differences could better capture subtle variations in the microstructure. The current study differed from Lin et al. in that KLD was selected as a measure that captures the information gain between distributions. The KLD was near zero for nearly all control participants, meaning that the contralesional hemisphere nearly mirrors the ipsilesional hemisphere. In participants with stroke, it was found that a greater divergence of the ipsilesional PLIC and contralesional PLIC distributions for GFA, RDI, and ODI was correlated with poorer outcomes at a follow-up assessment. For ODI and GFA, ΔPLICKLD and ΔPLICmean were in agreement. On the other hand, KLD analysis for the RDI parameter showed better differentiation between and higher correlation with outcomes than the difference of mean values in the PLIC.
Association of Baseline Lesion Size and Lesion Load of CST With Functional Outcomes
Similar to other groups, the correlation of the baseline ipsilesional CST lesion load with UE recovery was investigated (4, 7, 9, 45, 52–54). Most recently, Cassidy et al. found that the percent injury (lesion load) to the CST (cerebral peduncle and PLIC) after stroke, was significantly correlated with UE improvement after therapy (r = −0.41; p = 0.004; n = 47). Though no significant results for the entire CST lesion load were found in this study, the modest correlation with motor function outcomes observed agreed with previously reported studies (4, 9, 55). Breaking down the CST into individual segments yielded similar results, with the lesion load of the PLIC showing higher correlation with outcomes than the other segments, but still not reaching significance.
The PLIC is known to be one of the most integral brain regions to motor function. Simply knowing that a lesion is located in the PLIC would seem to be enough to predict motor function outcomes (4, 56). However, these results show that DSI based measures such as the NODDI ODI parameter, and to a lesser extent RDI and GFA, capture important information about the state of crucial areas of white matter that are not captured as well by simply estimating the percent of the structure overlapped by stroke lesion. Additional work shown in the Supplementary Material shows that correlation of the ODI values in the PLIC is driven more by values of the nonlesion areas of the PLIC than the lesion areas.
Conclusions
The ODI parameter of the NODDI model was found to be the best measure of baseline asymmetry in the PLIC and predictive of upper extremity motor outcomes approximately 5 weeks after stroke. In ODI maps, mean differences in the PLIC and the KLD showed agreement. Overall, DSI based measures of PLIC asymmetry were more highly correlated with outcomes than DTI based measures. Lesion size and lesion load of the CST were not significantly correlated with outcomes. Future work will include a larger patient cohort and focus on analysis of longitudinal changes in areas critical to stroke outcomes captured through DSI parameters.
Data Availability
Release of datasets would require additional IRB approval and might require re-consent of participants. Therefore, requests to access the datasets should be directed to Dr. Lorie Richards, lorie.richards@hsc.utah.edu and Dr. Jennifer Majersik, Jennifer.Majersik@hsc.utah.edu, who can apply to the IRB for approval.
Ethics Statement
The University of Utah Institutional Review Board (IRB) approved the study protocol. All human participants provided written informed consent in accordance with the Utah IRB guidelines which are in accordance with the Declaration of Helsinki.
Author Contributions
KH wrote the paper, processed the images, designed and performed the analysis, computed each of the models, and examined the relevant literature to find how the results fit in context of prior work. GA helped design the experiments, implemented the acquisition protocol, assembled some of the pre-processing techniques, and edited the manuscript. NA helped write the pre-processing code and was instrumental in choosing the k-fold analysis method and in writing some of the code to perform that analysis. Also performed editing of the methods and introduction sections. LR oversaw the Fugl-Meyer assessments and was instrumental in setting up the study and wrote some of the methods section and edited the manuscript. JM was instrumental in enrolling patients and setting up the study and performed editing throughout. GS contributed statistical expertise. ED conceived the research direction, assisted in design of the experiments, edited the manuscript, and was responsible for funding the imaging portions of the study.
Funding
Research reported in this proceeding was supported by the National Institute of Neurological Disorders and Stroke of the National Institutes of Health under award number R01NS083761. The content is solely the responsibility of the authors and does not necessarily represent the official views of the National Institutes of Health.
Conflict of Interest Statement
The authors declare that the research was conducted in the absence of any commercial or financial relationships that could be construed as a potential conflict of interest.
Supplementary Material
The Supplementary Material for this article can be found online at: https://www.frontiersin.org/articles/10.3389/fneur.2019.00072/full#supplementary-material
Abbreviations
AD, axial diffusivity; CST, corticospinal tract; DSI, diffusion spectrum imaging; FA, fractional Anisotropy; FM, Fugl-Meyer; FM UE tp2, upper extremity Fugl-Meyer score at time point 2; GFA, generalized fractional anisotropy; MD, mean diffusivity; NODDI, neurite orientation density and dispersion imaging; PLIC, posterior limb of the internal capsule; RD, radial diffusivity; RDI, restricted diffusion index; UE, upper extremity; DoF, degrees of freedom.
References
1. Jampathong N, Laopaiboon M, Rattanakanokchai S, Pattanittum P. Prognostic models for complete recovery in ischemic stroke: a systematic review and meta-analysis. BMC Neurol. (2018) 18:26. doi: 10.1186/s12883-018-1032-5
2. Boyd LA, Hayward KS, Ward NS, Stinear CM, Rosso C, Fisher RJ, et al. Biomarkers of stroke recovery: consensus-based core recommendations from the stroke recovery and rehabilitation roundtable. Neurorehabil Neural Repair (2017) 31:864–76. doi: 10.1177/1545968317732680
3. Puig J, Pedraza S, Blasco G, Daunis IEJ, Prats A, Prados F, et al. Wallerian degeneration in the corticospinal tract evaluated by diffusion tensor imaging correlates with motor deficit 30 days after middle cerebral artery ischemic stroke. Am J Neuroradiol. (2010) 31:1324–30. doi: 10.3174/ajnr.A2038
4. Puig J, Pedraza S, Blasco G, Daunis IEJ, Prados F, Remollo S, et al. Acute damage to the posterior limb of the internal capsule on diffusion tensor tractography as an early imaging predictor of motor outcome after stroke. Am J Neuroradiol. (2011) 32:857–63. doi: 10.3174/ajnr.A2400
5. Granziera C, Daducci A, Meskaldji DE, Roche A, Maeder P, Michel P, et al. A new early and automated MRI-based predictor of motor improvement after stroke. Neurology (2012) 79:39–46. doi: 10.1212/WNL.0b013e31825f25e7
6. Stinear CM, Barber PA, Petoe M, Anwar S, Byblow WD. The PREP algorithm predicts potential for upper limb recovery after stroke. Brain (2012) 135(Pt 8):2527–35. doi: 10.1093/brain/aws146
7. Groisser BN, Copen WA, Singhal AB, Hirai KK, Schaechter JD. Corticospinal tract diffusion abnormalities early after stroke predict motor outcome. Neurorehabil Neural Repair (2014) 28:751–60. doi: 10.1177/1545968314521896
8. Moulton E, Amor-Sahli M, Perlbarg V, Pires C, Crozier S, Galanaud D, et al. Axial diffusivity of the corona radiata at 24 hours post-stroke: a new biomarker for motor and global outcome. PLoS ONE (2015) 10:e0142910. doi: 10.1371/journal.pone.0142910
9. Puig J, Blasco G, Schlaug G, Stinear CM, Daunis IEP, Biarnes C, et al. Diffusion tensor imaging as a prognostic biomarker for motor recovery and rehabilitation after stroke. Neuroradiology (2017) 59:343–51. doi: 10.1007/s00234-017-1816-0
10. Cassidy JM, Tran G, Quinlan EB, Cramer SC. Neuroimaging identifies patients most likely to respond to a restorative stroke therapy. Stroke (2018) 49:433–8. doi: 10.1161/STROKEAHA.117.018844
11. Tuch DS, Reese TG, Wiegell MR, Makris N, Belliveau JW, Wedeen VJ. High angular resolution diffusion imaging reveals intravoxel white matter fiber heterogeneity. Magn Reson Med. (2002) 48:577–82. doi: 10.1002/mrm.10268
12. Kaden E, Knosche TR, Anwander A. Parametric spherical deconvolution: inferring anatomical connectivity using diffusion MR imaging. Neuroimage (2007) 37:474–88. doi: 10.1016/j.neuroimage.2007.05.012
14. Yeh FC, Wedeen VJ, Tseng WY. Generalized q-sampling imaging. IEEE Trans Med Imaging (2010) 29:1626–35. doi: 10.1109/TMI.2010.2045126
15. Zhang H, Schneider T, Wheeler-Kingshott CA, Alexander DC. NODDI: practical in vivo neurite orientation dispersion and density imaging of the human brain. Neuroimage (2012) 61:1000–16. doi: 10.1016/j.neuroimage.2012.03.072
16. Lin YC, Daducci A, Meskaldji DE, Thiran JP, Michel P, Meuli R, et al. Quantitative analysis of myelin and axonal remodeling in the uninjured motor network after stroke. Brain Connect (2015) 5:401–12. doi: 10.1089/brain.2014.0245
17. Wedeen VJ, Wang RP, Schmahmann JD, Benner T, Tseng WY, Dai G, et al. Diffusion spectrum magnetic resonance imaging (DSI) tractography of crossing fibers. Neuroimage (2008) 41:1267–77. doi: 10.1016/j.neuroimage.2008.03.036
18. Anderova M, Vorisek I, Pivonkova H, Benesova J, Vargova L, Cicanic M, et al. Cell death/proliferation and alterations in glial morphology contribute to changes in diffusivity in the rat hippocampus after hypoxia-ischemia. J Cereb Blood Flow Metab. (2011) 31:894–907. doi: 10.1038/jcbfm.2010.168
19. Kuo LW, Chen JH, Wedeen VJ, Tseng WY. Optimization of diffusion spectrum imaging and q-ball imaging on clinical MRI system. Neuroimage (2008) 41:7–18. doi: 10.1016/j.neuroimage.2008.02.016
20. Setsompop K, Gagoski BA, Polimeni JR, Witzel T, Wedeen VJ, Wald LL. Blipped-controlled aliasing in parallel imaging for simultaneous multislice echo planar imaging with reduced g-factor penalty. Magn Reson Med. (2012) 67:1210–24. doi: 10.1002/mrm.23097
21. Smith SM. Fast robust automated brain extraction. Hum Brain Mapp. (2002) 17:143–55. doi: 10.1002/hbm.10062
22. Veraart J, Fieremans E, Novikov DS. Diffusion MRI noise mapping using random matrix theory. Magn Reson Med. (2016) 76:1582–93. doi: 10.1002/mrm.26059
23. Koay CG, Basser PJ. Analytically exact correction scheme for signal extraction from noisy magnitude MR signals. J Magn Reson. (2006) 179:317–22. doi: 10.1016/j.jmr.2006.01.016
24. Koay CG, Ozarslan E, Basser PJ. A signal transformational framework for breaking the noise floor and its applications in MRI. J Magn Reson. (2009) 197:108–19. doi: 10.1016/j.jmr.2008.11.015
25. Kellner E. De-ring Software License. Available online at: https://bitbucket.org/reisert/unring/overview: University Medical Center Freiburg (2016).
26. Kellner E, Dhital B, Kiselev VG, Reisert M. Gibbs-ringing artifact removal based on local subvoxel-shifts. Magn Reson Med. (2016) 76:1574–81. doi: 10.1002/mrm.26054
27. Andersson JLR, Graham MS, Zsoldos E, Sotiropoulos SN. Incorporating outlier detection and replacement into a non-parametric framework for movement and distortion correction of diffusion MR images. Neuroimage (2016) 141:556–72. doi: 10.1016/j.neuroimage.2016.06.058
28. Cook PA, Bai Y, Nedjati-Gilani S, Seunarine KK, Hall MG, Parker GJ, et al. Camino: open-source diffusion-MRI reconstruction and processing. In: 14th Scientific Meeting of the International Society for Magnetic Resonance in Medicine (Seattle, WA). (2006). p. 2759.
29. Garyfallidis E, Brett M, Amirbekian B, Rokem A, van der Walt S, Descoteaux M, et al. Dipy, a library for the analysis of diffusion MRI data. Front Neuroinform. (2014) 8:8. doi: 10.3389/fninf.2014.00008
30. Daducci A, Canales-Rodriguez EJ, Descoteaux M, Garyfallidis E, Gur Y, Lin YC, et al. Quantitative comparison of reconstruction methods for intra-voxel fiber recovery from diffusion MRI. IEEE Trans Med Imag. (2014) 33:384–99. doi: 10.1109/TMI.2013.2285500
31. Desikan RS, Segonne F, Fischl B, Quinn BT, Dickerson BC, Blacker D, et al. An automated labeling system for subdividing the human cerebral cortex on MRI scans into gyral based regions of interest. Neuroimage (2006) 31:968–80. doi: 10.1016/j.neuroimage.2006.01.021
32. Avants BB, Yushkevich P, Pluta J, Minkoff D, Korczykowski M, Detre J, et al. The optimal template effect in hippocampus studies of diseased populations. Neuroimage (2010) 49:2457–66. doi: 10.1016/j.neuroimage.2009.09.062
33. Avants BB, Tustison NJ, Song G, Cook PA, Klein A, Gee JC. A reproducible evaluation of ANTs similarity metric performance in brain image registration. Neuroimage (2011) 54:2033–44. doi: 10.1016/j.neuroimage.2010.09.025
34. Strimmer JHaK. Estimation of entropy, Mutual Information and Related Quantities. 1.2.1 Ed. (CRAN.r-project.org: CRAN) (2014).
35. Werring DJ, Toosy AT, Clark CA, Parker GJ, Barker GJ, Miller DH, et al. Diffusion tensor imaging can detect and quantify corticospinal tract degeneration after stroke. J Neurol Neurosurg Psychiatry (2000) 69:269–72. doi: 10.1136/jnnp.69.2.269
36. Pierpaoli C, Barnett A, Pajevic S, Chen R, Penix LR, Virta A, et al. Water diffusion changes in Wallerian degeneration and their dependence on white matter architecture. Neuroimage (2001) 13 (6 Pt 1):1174–85. doi: 10.1006/nimg.2001.0765
37. Thomalla G, Glauche V, Koch MA, Beaulieu C, Weiller C, Rother J. Diffusion tensor imaging detects early Wallerian degeneration of the pyramidal tract after ischemic stroke. Neuroimage (2004) 22:1767–74. doi: 10.1016/j.neuroimage.2004.03.041
38. Xie R, Fang M, Zhou L, Fan S, Liu J, Quan H, et al. Diffusion tensor imaging detects Wallerian degeneration of the corticospinal tract early after cerebral infarction. Neural Regen Res. (2012) 7:900–5. doi: 10.3969/j.issn.1673-5374.2012.12.004
39. Zhang H, Hubbard PL, Parker GJ, Alexander DC. Axon diameter mapping in the presence of orientation dispersion with diffusion MRI. Neuroimage (2011) 56:1301–15. doi: 10.1016/j.neuroimage.2011.01.084
40. Assaf Y, Basser PJ. Composite hindered and restricted model of diffusion (CHARMED) MR imaging of the human brain. Neuroimage (2005) 27:48–58. doi: 10.1016/j.neuroimage.2005.03.042
41. Jespersen SN, Kroenke CD, Ostergaard L, Ackerman JJ, Yablonskiy DA. Modeling dendrite density from magnetic resonance diffusion measurements. Neuroimage (2007) 34:1473–86. doi: 10.1016/j.neuroimage.2006.10.037
42. Schaechter JD, Perdue KL, Wang R. Structural damage to the corticospinal tract correlates with bilateral sensorimotor cortex reorganization in stroke patients. Neuroimage (2008) 39:1370–82. doi: 10.1016/j.neuroimage.2007.09.071
43. Schaechter JD, Fricker ZP, Perdue KL, Helmer KG, Vangel MG, Greve DN, et al. Microstructural status of ipsilesional and contralesional corticospinal tract correlates with motor skill in chronic stroke patients. Hum Brain Mapp. (2009) 30:3461–74. doi: 10.1002/hbm.20770
44. Stinear CM, Barber PA, Smale PR, Coxon JP, Fleming MK, Byblow WD. Functional potential in chronic stroke patients depends on corticospinal tract integrity. Brain (2007) 130(Pt 1):170–80. doi: 10.1093/brain/awl333
45. Zhu LL, Lindenberg R, Alexander MP, Schlaug G. Lesion load of the corticospinal tract predicts motor impairment in chronic stroke. Stroke (2010) 41:910–5. doi: 10.1161/STROKEAHA.109.577023
46. Granziera C, Ay H, Koniak SP, Krueger G, Sorensen AG. Diffusion tensor imaging shows structural remodeling of stroke mirror region: results from a pilot study. Eur Neurol. (2012) 67:370–6. doi: 10.1159/000336062
47. Schulz R, Park CH, Boudrias MH, Gerloff C, Hummel FC, Ward NS. Assessing the integrity of corticospinal pathways from primary and secondary cortical motor areas after stroke. Stroke (2012) 43:2248–51. doi: 10.1161/STROKEAHA.112.662619
48. Schulz R, Park E, Lee J, Chang WH, Lee A, Kim YH, et al. Interactions between the corticospinal tract and premotor-motor pathways for residual motor output after stroke. Stroke (2017) 48:2805–11. doi: 10.1161/STROKEAHA.117.016834
49. Riecker A, Groschel K, Ackermann H, Schnaudigel S, Kassubek J, Kastrup A. The role of the unaffected hemisphere in motor recovery after stroke. Hum Brain Mapp. (2010) 31:1017–29. doi: 10.1002/hbm.20914
50. Rehme AK, Fink GR, von Cramon DY, Grefkes C. The role of the contralesional motor cortex for motor recovery in the early days after stroke assessed with longitudinal FMRI. Cereb Cortex (2011) 21:756–68. doi: 10.1093/cercor/bhq140
51. Buetefisch CM. Role of the contralesional hemisphere in post-stroke recovery of upper extremity motor function. Front Neurol. (2015) 6:214. doi: 10.3389/fneur.2015.00214
52. Kalinosky BT, Schindler-Ivens S, Schmit BD. White matter structural connectivity is associated with sensorimotor function in stroke survivors. Neuroimage Clin. (2013) 2:767–81.
53. Auriat AM, Borich MR, Snow NJ, Wadden KP, Boyd LA. Comparing a diffusion tensor and non-tensor approach to white matter fiber tractography in chronic stroke. Neuroimage Clin. (2015) 7:771–81.
54. Feng W, Wang J, Chhatbar PY, Doughty C, Landsittel D, Lioutas VA, et al. Corticospinal tract lesion load: an imaging biomarker for stroke motor outcomes. Ann Neurol. (2015) 78:860–70.
55. Pedraza S, Puig J, Blasco G, Prados F, Thiel A. Diffusion tensor imaging, permanent pyramidal tract damage, and outcome in subcortical stroke. Neurology (2011) 76:1606–7.
Keywords: stroke, motor, NODDI, Fugl-Meyer, DSI, DTI, diffusion, MRI
Citation: Hodgson K, Adluru G, Richards LG, Majersik JJ, Stoddard G, Adluru N and DiBella E (2019) Predicting Motor Outcomes in Stroke Patients Using Diffusion Spectrum MRI Microstructural Measures. Front. Neurol. 10:72. doi: 10.3389/fneur.2019.00072
Received: 29 April 2018; Accepted: 18 January 2019;
Published: 18 February 2019.
Edited by:
Itamar Ronen, Leiden University, NetherlandsReviewed by:
Richard Beare, Monash University, AustraliaZhengyi Yang, The University of Queensland, Australia
Copyright © 2019 Hodgson, Adluru, Richards, Majersik, Stoddard, Adluru and DiBella. This is an open-access article distributed under the terms of the Creative Commons Attribution License (CC BY). The use, distribution or reproduction in other forums is permitted, provided the original author(s) and the copyright owner(s) are credited and that the original publication in this journal is cited, in accordance with accepted academic practice. No use, distribution or reproduction is permitted which does not comply with these terms.
*Correspondence: Edward DiBella, Edward.dibella@hsc.utah.edu