Feasibility on the Use of Radiomics Features of 11[C]-MET PET/CT in Central Nervous System Tumours: Preliminary Results on Potential Grading Discrimination Using a Machine Learning Model

 ,
,  , ,
, ,  , ,
, ,  ,
,
Abstract
:1. Introduction
2. Materials and Methods
2.1. Patient Dataset and Protocol Acquisition
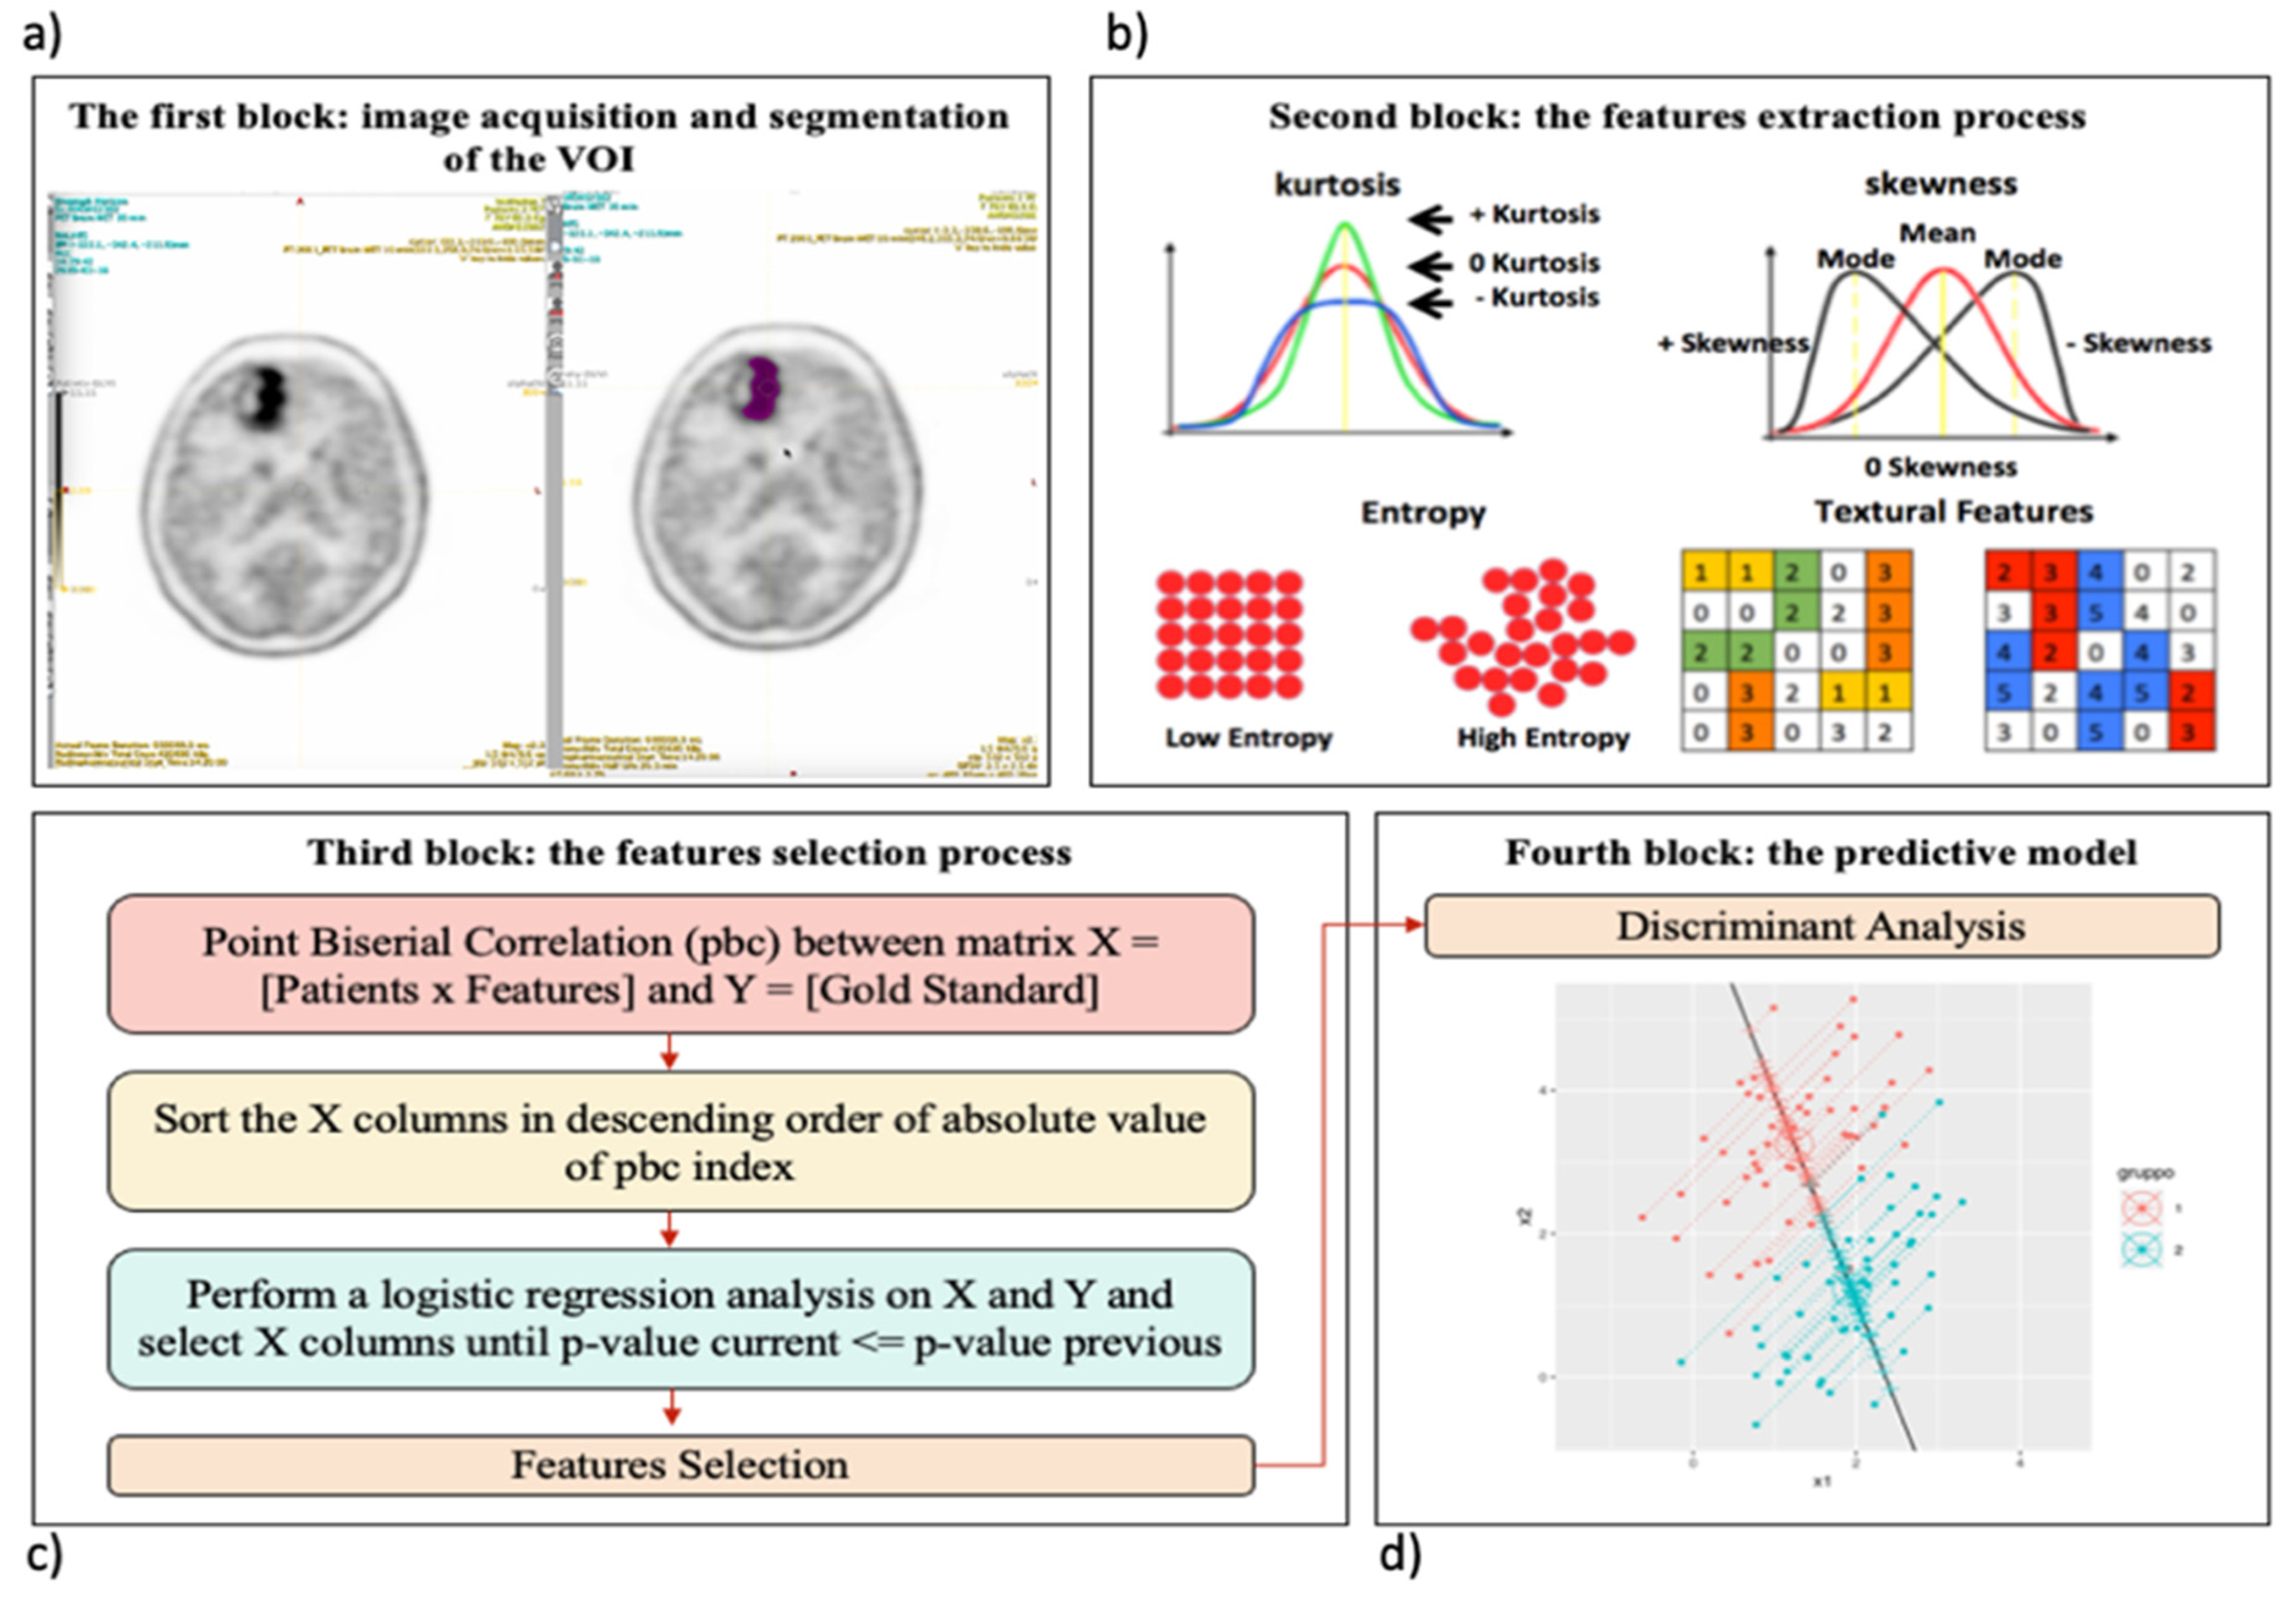
2.2. Overview of the Proposed Radiomics Workflow
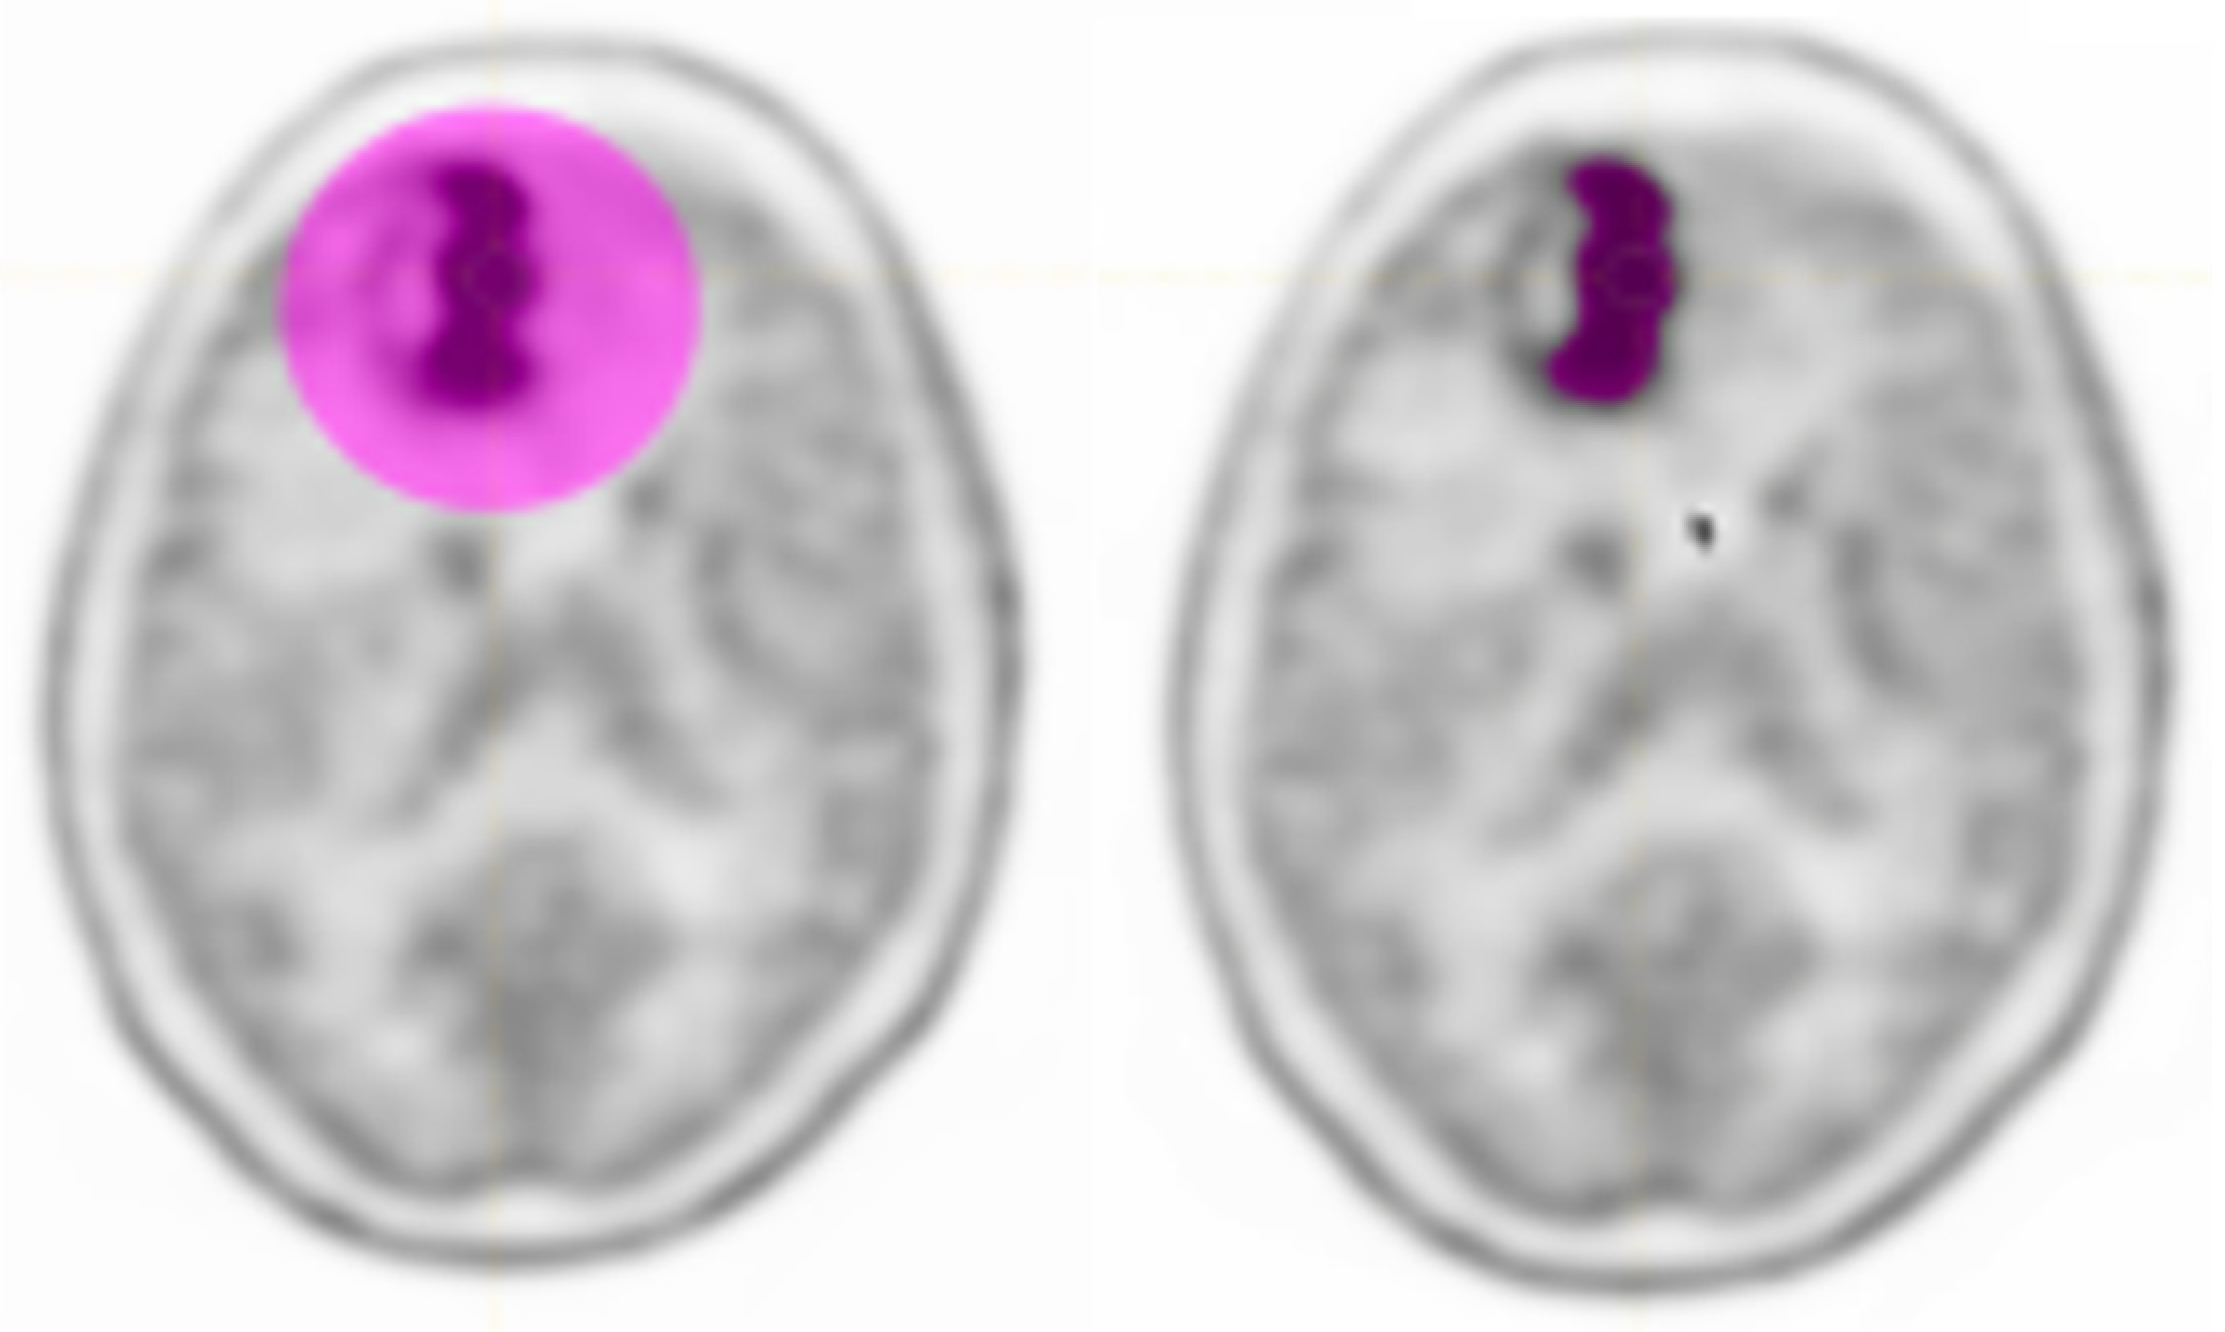
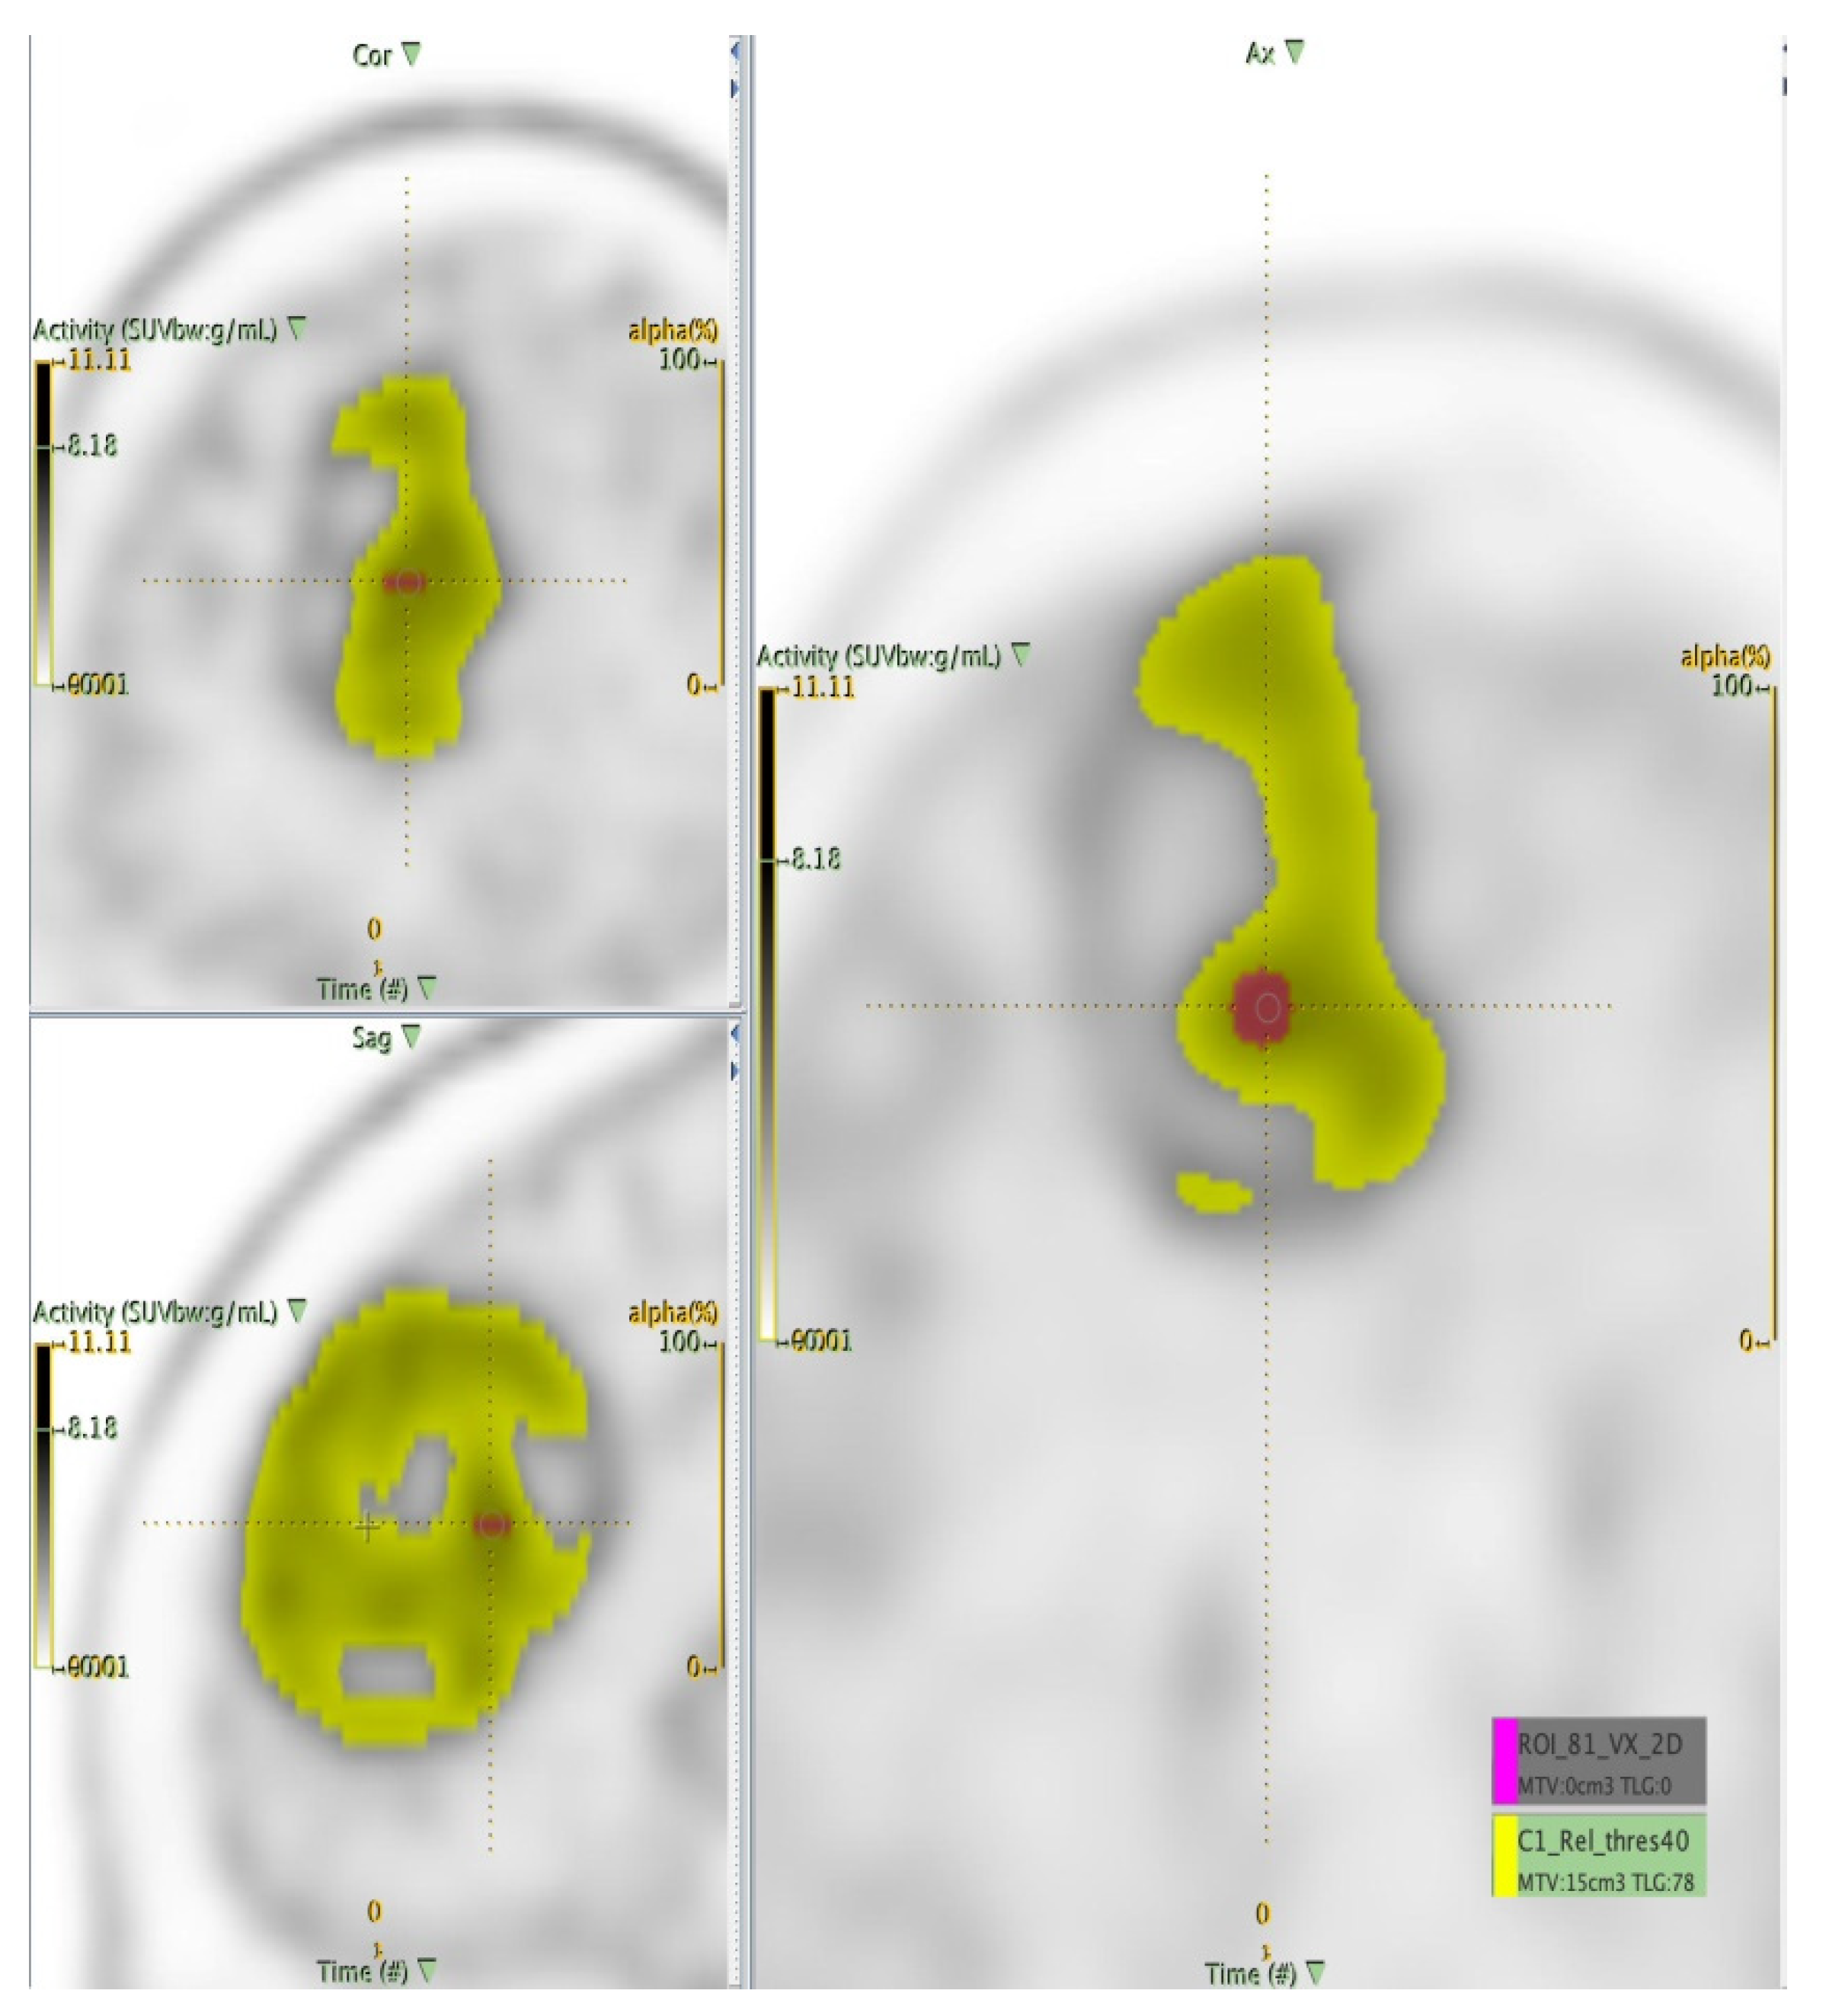
2.2.1. The Target Segmentation
2.2.2. Extraction of the Radiomics Features
2.2.3. Statistical Analysis: The Feature Selection Process
2.2.4. The Predictive Model
3. Results
4. Discussion
5. Conclusions
Author Contributions
Funding
Institutional Review Board Statement
Informed Consent Statement
Data Availability Statement
Conflicts of Interest
References
- Brandes, A.; Franceschi, E.; Bertolini, E.; Calbucci, F.; Crisi, G.; Ferreri, A. Italian Association of Medical Oncology (AIOM) Guide Lines—Neoplasie Cerebrali, 2015. Available online: http://media.aiom.it/userfiles/files/doc/LG/2015_LG_AIOM_Cerebrali.pdf (accessed on 31 October 2021).
- Ostrom, Q.T. CBTRUS Statistical Report: Primary Brain and Central Nervous System Tumors Diagnosed in the United States in 2008–2012. Neuro. Oncol. 2015, 17, 1–62. [Google Scholar] [CrossRef]
- Johnson, D.R.; Guerin, J.B.; Giannini, C.; Morris, J.M.; Eckel, L.J.; Kaufmann, T.J. 2016 Updates to the WHO Brain Tumor Classification System: What the Radiologist Needs to Know. Radiographics 2017, 37, 2164–2180. [Google Scholar] [CrossRef] [Green Version]
- Louis, D.N.; Perry, A.; Wesseling, P.; Brat, D.J.; Cree, A.I.; Figarella-Branger, D.; Hawkins, C.; Ng, H.K.; Pfister, S.M.; Reifenberger, G.; et al. The 2021 WHO Classification of Tumors of the Central Nervous System: A summary. Neuro-Oncology 2021, 23, 1231–1251. [Google Scholar] [CrossRef]
- Hartmann, C.; Hentschel, B.; Wick, W.; Capper, D.; Felsberg, J.; Simon, M. Patients with IDH1 wild type anaplastic astrocy-tomas exhibit worse prognosis than IDH1-mutated glioblastomas, and IDH1 mutation status accounts for the unfavorable prognostic effect of higher age: Implications for classification of gliomas. Acta Neuropathol. 2010, 120, 707–718. [Google Scholar] [CrossRef] [Green Version]
- Ha, S.; Choi, H.; Paeng, J.C.; Cheon, G.J. Radiomics in Oncological PET/CT: A Methodological Overview. Nucl. Med. Mol. Imaging 2019, 53, 14–29. [Google Scholar] [CrossRef] [PubMed]
- Mayerhoefer, M.E.; Materka, A.; Langs, G.; Häggström, I.; Szczypiński, P.; Gibbs, P.; Cook, G. Introduction to Radiomics. J. Nucl. Med. 2020, 61, 488–495. [Google Scholar] [CrossRef]
- El Naqa, I.; Grigsby, P.; Apte, A.; Kidd, E.; Donnelly, E.; Khullar, D.; Chaudhari, S.; Yang, D.; Schmitt, M.; Laforest, R.; et al. Exploring feature-based approaches in PET images for predicting cancer treatment outcomes. Pattern Recognit. 2009, 42, 1162–1171. [Google Scholar] [CrossRef] [PubMed] [Green Version]
- Alongi, P.; Quartuccio, N.; Arnone, A.; Kokomani, A.; Allocca, M.; Nappi, A.G.; Santo, G.; Mantarro, C.; Laudicella, R. Brain PET/CT using prostate cancer radiopharmaceutical agents in the evaluation of gliomas. Clin. Transl. Imaging 2020, 8, 433–448. [Google Scholar] [CrossRef]
- Katsanos, A.H.; Alexiou, G.A.; Fotopoulos, A.D.; Jabbour, P. Performance of 18F-FDG, 11C-Methionine, and 18F-FET PET for Glioma Grading: A Meta-analysis. Clin. Nucl. Med. 2019, 44, 864–869. [Google Scholar] [CrossRef]
- Boss, A.; Bisdas, S.; Kolb, A.; Hofmann, M.; Ernemann, U.; Claussen, C.D.; Pfannenberg, C.; Pichler, B.J.; Reimold, M.; Stegger, L. Hybrid PET/MRI of Intracranial Masses: Initial Experiences and Comparison to PET/CT. J. Nucl. Med. 2010, 51, 1198–1205. [Google Scholar] [CrossRef] [PubMed] [Green Version]
- Calcagni, M.L.; Galli, G.; Giordano, A. Dynamic O-(2-[18F]fluoroethyl)-Ltyrosine (F-18 FET) PET for glioma grading: Assessment of individual probability of malignancy. Clin. Nucl. Med. 2011, 36, 841–847. [Google Scholar] [CrossRef]
- Choi, S.J.; Kim, J.S.; Kim, J.H. [18F]3′-deoxy-3′-fluorothymidine PET for the diagnosis and grading of brain tumors. Eur. J. Nucl. Med. Mol. Imaging 2005, 32, 653–659. [Google Scholar] [CrossRef] [PubMed]
- Delbeke, D.; Meyerowitz, C.; Lapidus, R.L.; Maciunas, R.J.; Jennings, M.T.; Moots, P.L.; Kessler, R.M. Optimal cutoff levels of F-18 fluorodeoxyglucose uptake in the differentiation of low-grade from high-grade brain tumors with PET. Radiology 1995, 195, 47–52. [Google Scholar] [CrossRef] [PubMed]
- Ghany, A.F.A.; Hamed, M.A.G. The diagnostic value of dual phase FDG PET CT in grading of gliomas. Egypt. J. Radiol. Nucl. Med. 2015, 46, 701–705. [Google Scholar] [CrossRef] [Green Version]
- Gumprecht, H.; Grosu, A.L.; Souvatsoglou, M.; Dzewas, B.; Weber, W.A.; Lumenta, C.B. 11C-Methionine Positron Emission Tomography for Preoperative Evaluation of Suggestive Low-Grade Gliomas. Zent. Neurochir. Cent. Eur. Neurosurg. 2007, 68, 19–23. [Google Scholar] [CrossRef]
- Janus, T.J.; Kim, E.E.; Tilbury, R.; Bruner, J.M.; Yung, W.K.A. Use of [18F]fluorodeoxyglucose positron emission tomography in patients with primary malignant brain tumors. Ann. Neurol. 1993, 33, 540–548. [Google Scholar] [CrossRef]
- Lau, E.W.; Drummond, K.J.; Ware, R.E. Comparative PET study using F-18 FET and F-18 FDG for the evaluation of patients with suspected brain tumour. J. Clin. Neurosci. 2010, 17, 43–49. [Google Scholar] [CrossRef]
- Lohmann, P.; Herzog, H.; Kops, E.R.; Stoffels, G.; Judov, N.; Filss, C.; Galldiks, N.; Tellmann, L.; Weiss, C.; Sabel, M.; et al. Dual-time-point O-(2-[18F]fluoroethyl)-l-tyrosine PET for grading of cerebral gliomas. Eur. Radiol. 2015, 25, 3017–3024. [Google Scholar] [CrossRef]
- McCarthy, M.; Yuan, J.; Campbell, A.; Lenzo, N.; Butler-Henderson, K. 18F-fluorodeoxyglucose positron emission tomography imaging in brain tumours: The Western Australia positron emission tomography/cyclotron service experience. J. Med. Imaging Radiat. Oncol. 2008, 52, 564–569. [Google Scholar] [CrossRef]
- Miyake, K.; Shinomiya, A.; Okada, M. Usefulness of FDG, METand FLTPET studies for the management of human gliomas. J. Biomed. Biotechnol. 2012, 2012, 205818. [Google Scholar] [CrossRef] [Green Version]
- Ogawa, T.; Shishido, F.; Kanno, I.; Inugami, A.; Fujita, H.; Murakami, M.; Shimosegawa, E.; Ito, H.; Hatazawa, J.; Okudera, T. Cerebral glioma: Evaluation with methionine PET. Radiology 1993, 186, 45–53. [Google Scholar] [CrossRef]
- Padma, M.V.; Said, S.; Jacobs, M.; Hwang, D.R.; Dunigan, K.; Satter, M.; Christian, B.; Ruppert, J.; Bernstein, T.; Kraus, G.; et al. Prediction of Pathology and Survival by FDG PET in Gliomas. J. Neuro-Oncol. 2003, 64, 227–237. [Google Scholar] [CrossRef]
- Pauleit, D.; Stoffels, G.; Bachofner, A.; Floeth, F.W.; Sabel, M.; Herzog, H.; Tellmann, L.; Jansen, P.; Reifenberger, G.; Hamacher, K.; et al. Comparison of 18F-FET and 18F-FDG PET in brain tumors. Nucl. Med. Biol. 2009, 36, 779–787. [Google Scholar] [CrossRef] [PubMed]
- Pichler, R.; Dunzinger, A.; Wurm, G.; Pichler, J.; Weis, S.; Nußbaumer, K.; Topakian, R.; Aigner, R.M. Is there a place for FET PET in the initial evaluation of brain lesions with unknown significance? Eur. J. Nucl. Med. Mol. Imaging 2010, 37, 1521–1528. [Google Scholar] [CrossRef]
- Plotkin, M.; Blechschmidt, C.; Auf, G. Comparison of F-18 FET-PETwith F-18 FDG-PET for biopsy planning of non–contrast-enhancing gliomas. Eur. Radiol. 2010, 20, 2496–2502. [Google Scholar] [CrossRef] [PubMed]
- Shi, X.; Liu, Y.; Zhang, X.; Yi, C.; Wang, X.; Chen, Z.; Zhang, B. The Comparison of 13N-Ammonia and 18F-FDG in the Evaluation of Untreated Gliomas. Clin. Nucl. Med. 2013, 38, 522–526. [Google Scholar] [CrossRef]
- Tateishi, K.; Nakanowatari, S.; Ohtake, M.; Minamimoto, R.; Suenaga, J.; Murata, H.; Kubota, K.; Inoue, T.; Kawahara, N. 62Cu-Diacetyl-Bis (N4-Methylthiosemicarbazone) PET in Human Gliomas: Comparative Study with [18F]Fluorodeoxyglucose and l-Methyl-[11C]Methionine PET. Am. J. Neuroradiol. 2014, 35, 278–284. [Google Scholar] [CrossRef] [Green Version]
- Tietze, A.; Boldsen, J.K.; Mouridsen, K.; Ribe, L.; Dyve, S.; Cortnum, S.; Østergaard, L.; Borghammer, P. Spatial distribution of malignant tissue in gliomas: Correlations of 11C-L-methionine positron emission tomography and perfusion- and diffusion-weighted magnetic resonance imaging. Acta Radiol. 2015, 56, 1135–1144. [Google Scholar] [CrossRef] [PubMed]
- Torii, K.; Tsuyuguchi, N.; Kawabe, J. Correlation of amino-acid uptake using methionine PET and histological classifica-tions in various gliomas. Ann. Nucl. Med. 2005, 19, 677–683. [Google Scholar] [CrossRef]
- Verger, A.; Filss, C.P.; Lohmann, P.; Stoffels, G.; Sabel, M.; Wittsack, H.J.; Kops, E.R.; Galldiks, N.; Fink, G.R.; Shah, N.J.; et al. Comparison of 18F-FET PET and perfusion-weighted MRI for glioma grading: A hybrid PET/MR study. Eur. J. Nucl. Med. Mol. Imaging 2017, 44, 2257–2265. [Google Scholar] [CrossRef]
- Yamamoto, Y.; Nishiyama, Y.; Kimura, N.; Kameyama, R.; Kawai, N.; Hatakeyama, T.; Kaji, M.; Ohkawa, M. 11C-Acetate PET in the Evaluation of Brain Glioma: Comparison with 11C-Methionine and 18F-FDG-PET. Mol. Imaging Biol. 2008, 10, 281–287. [Google Scholar] [CrossRef] [PubMed]
- Yoon, J.H.; Kim, J.H.; Kang, W.J. Grading of cerebral glioma with multiparametric MR imaging and 18F-FDG-PET: Concord-ance and accuracy. Eur. Radiol. 2014, 24, 380–389. [Google Scholar] [CrossRef]
- Nioche, C.; Orlhac, F.; Boughdad, S.; Reuzé, S.; Goya-Outi, J.; Robert, C.; Pellot-Barakat, C.; Soussan, M.; Frouin, F.; Buvat, I. LIFEx: A Freeware for Radiomic Feature Calculation in Multimodality Imaging to Accelerate Advances in the Characterization of Tumor Heterogeneity. Cancer Res. 2018, 78, 4786–4789. [Google Scholar] [CrossRef] [Green Version]
- Comelli, A.; Stefano, A.; Coronnello, C.; Russo, G.; Vernuccio, F.; Cannella, R.; Salvaggio, G.; Lagalla, R.; Barone, S. Radiomics: A New Biomedical Workflow to Create a Predictive Model. In Proceedings of the Biomedical Engineering Systems and Technologies; Springer Science and Business Media LLC: Berlin/Heidelberg, Germany, 2020; pp. 280–293. [Google Scholar]
- Comelli, A.; Bignardi, S.; Stefano, A.; Russo, G.; Sabini, M.G.; Ippolito, M.; Yezzi, A. Development of a new fully three-dimensional methodology for tumours delineation in functional images. Comput. Biol. Med. 2020, 120, 103701. [Google Scholar] [CrossRef]
- Stefano, A.; Vitabile, S.; Russo, G.; Ippolito, M.; Marletta, F.; D’Arrigo, C.; D’Urso, D.; Gambino, O.; Pirrone, R.; Ardizzone, E.; et al. A fully automatic method for biological target volume segmentation of brain metastases. Int. J. Imaging Syst. Technol. 2016, 26, 29–37. [Google Scholar] [CrossRef]
- Comelli, A.; Stefano, A. A Fully Automated Segmentation System of Positron Emission Tomography Studies. In Medical Image Understanding and Analysis; Zheng, Y., Williams, B., Chen, K., Eds.; MIUA 2019; Communications in Computer and Information Science; Springer: Cham, Switzerland, 2020; Volume 1065. [Google Scholar] [CrossRef]
- Xue, J.H.; Titterington, D.M. Do unbalanced data have a negative effect on LDA? Pattern. Recognit. 2008, 41, 1558–1571. [Google Scholar] [CrossRef] [Green Version]
- Law, I.; Albert, N.L.; Arbizu, J.; Boellaard, R.; Drzezga, A.; Galldiks, N. Joint EANM/EANO/RANO practice guide-lines/SNMMI procedure standards for imaging of gliomas using PET with radiolabelled amino acids and [(18)F]FDG: Version 1.0. Eur. J. Nucl. Med. Mol. Imaging 2019, 46, 540–557. [Google Scholar] [CrossRef] [PubMed] [Green Version]
- Comelli, A.; Stefano, A.; Bignardi, S.; Russo, G.; Sabini, M.G.; Ippolito, M.; Barone, S.; Yezzi, A. Active contour algorithm with discriminant analysis for delineating tumors in positron emission tomography. Artif. Intell. Med. 2019, 94, 67–78. [Google Scholar] [CrossRef] [PubMed]
- Da-Ano, R.; Visvikis, D.; Hatt, M. Harmonization strategies for multicenter radiomics investigations. Phys. Med. Biol. 2020, 65, 24TR02. [Google Scholar] [CrossRef]
- Kebir, S.; Rauschenbach, L.; Weber, M.; Lazaridis, L.; Schmidt, T.; Keyvani, K.; Schäfer, N.; Milia, A.; Umutlu, L.; Pierscianek, D.; et al. Machine learning-based differentiation between multiple sclerosis and glioma WHO II°-IV° using O-(2-[18F] fluoroethyl)-l-tyrosine positron emission tomography. J. Neuro-Oncol. 2021, 152, 325–332. [Google Scholar] [CrossRef]
- Qian, J.; Herman, M.G.; Brinkmann, D.H.; Laack, N.N.; Kemp, B.J.; Hunt, C.H.; Lowe, V.; Pafundi, D.H. Prediction of MGMT Status for Glioblastoma Patients Using Radiomics Feature Extraction From 18F-DOPA-PET Imaging. Int. J. Radiat. Oncol. 2020, 108, 1339–1346. [Google Scholar] [CrossRef]
- Kebir, S.; Weber, M.; Lazaridis, L.; Deuschl, C.; Schmidt, T.; Mönninghoff, C.; Keyvani, K.; Umutlu, L.; Pierscianek, D.; Forsting, M.; et al. Hybrid 11C-MET PET/MRI Combined With “Machine Learning” in Glioma Diagnosis According to the Revised Glioma WHO Classification 2016. Clin. Nucl. Med. 2019, 44, 214–220. [Google Scholar] [CrossRef] [PubMed]


| Histological Diagnosis | WHO Grade | Number |
|---|---|---|
| Glioblastoma | IV | 33 |
| Anaplastic astrocytoma | III | 6 |
| Diffuse astrocytoma | II | 5 |
| Oligodendroglioma | II | 6 |
| Pilocytic astrocytoma | I | 3 |
| Ganglioglioma | I | 1 |
| Meningioma | I | 2 |
| Tomograph | Features | p-Value |
|---|---|---|
| All patients | NGLDM Busyness | 0.1615 |
| GLZLM LZLGE | 0.3207 | |
| GE | GLRLM LRLGE | 0.05 |
| GLZLM LZLGE | 0.137 | |
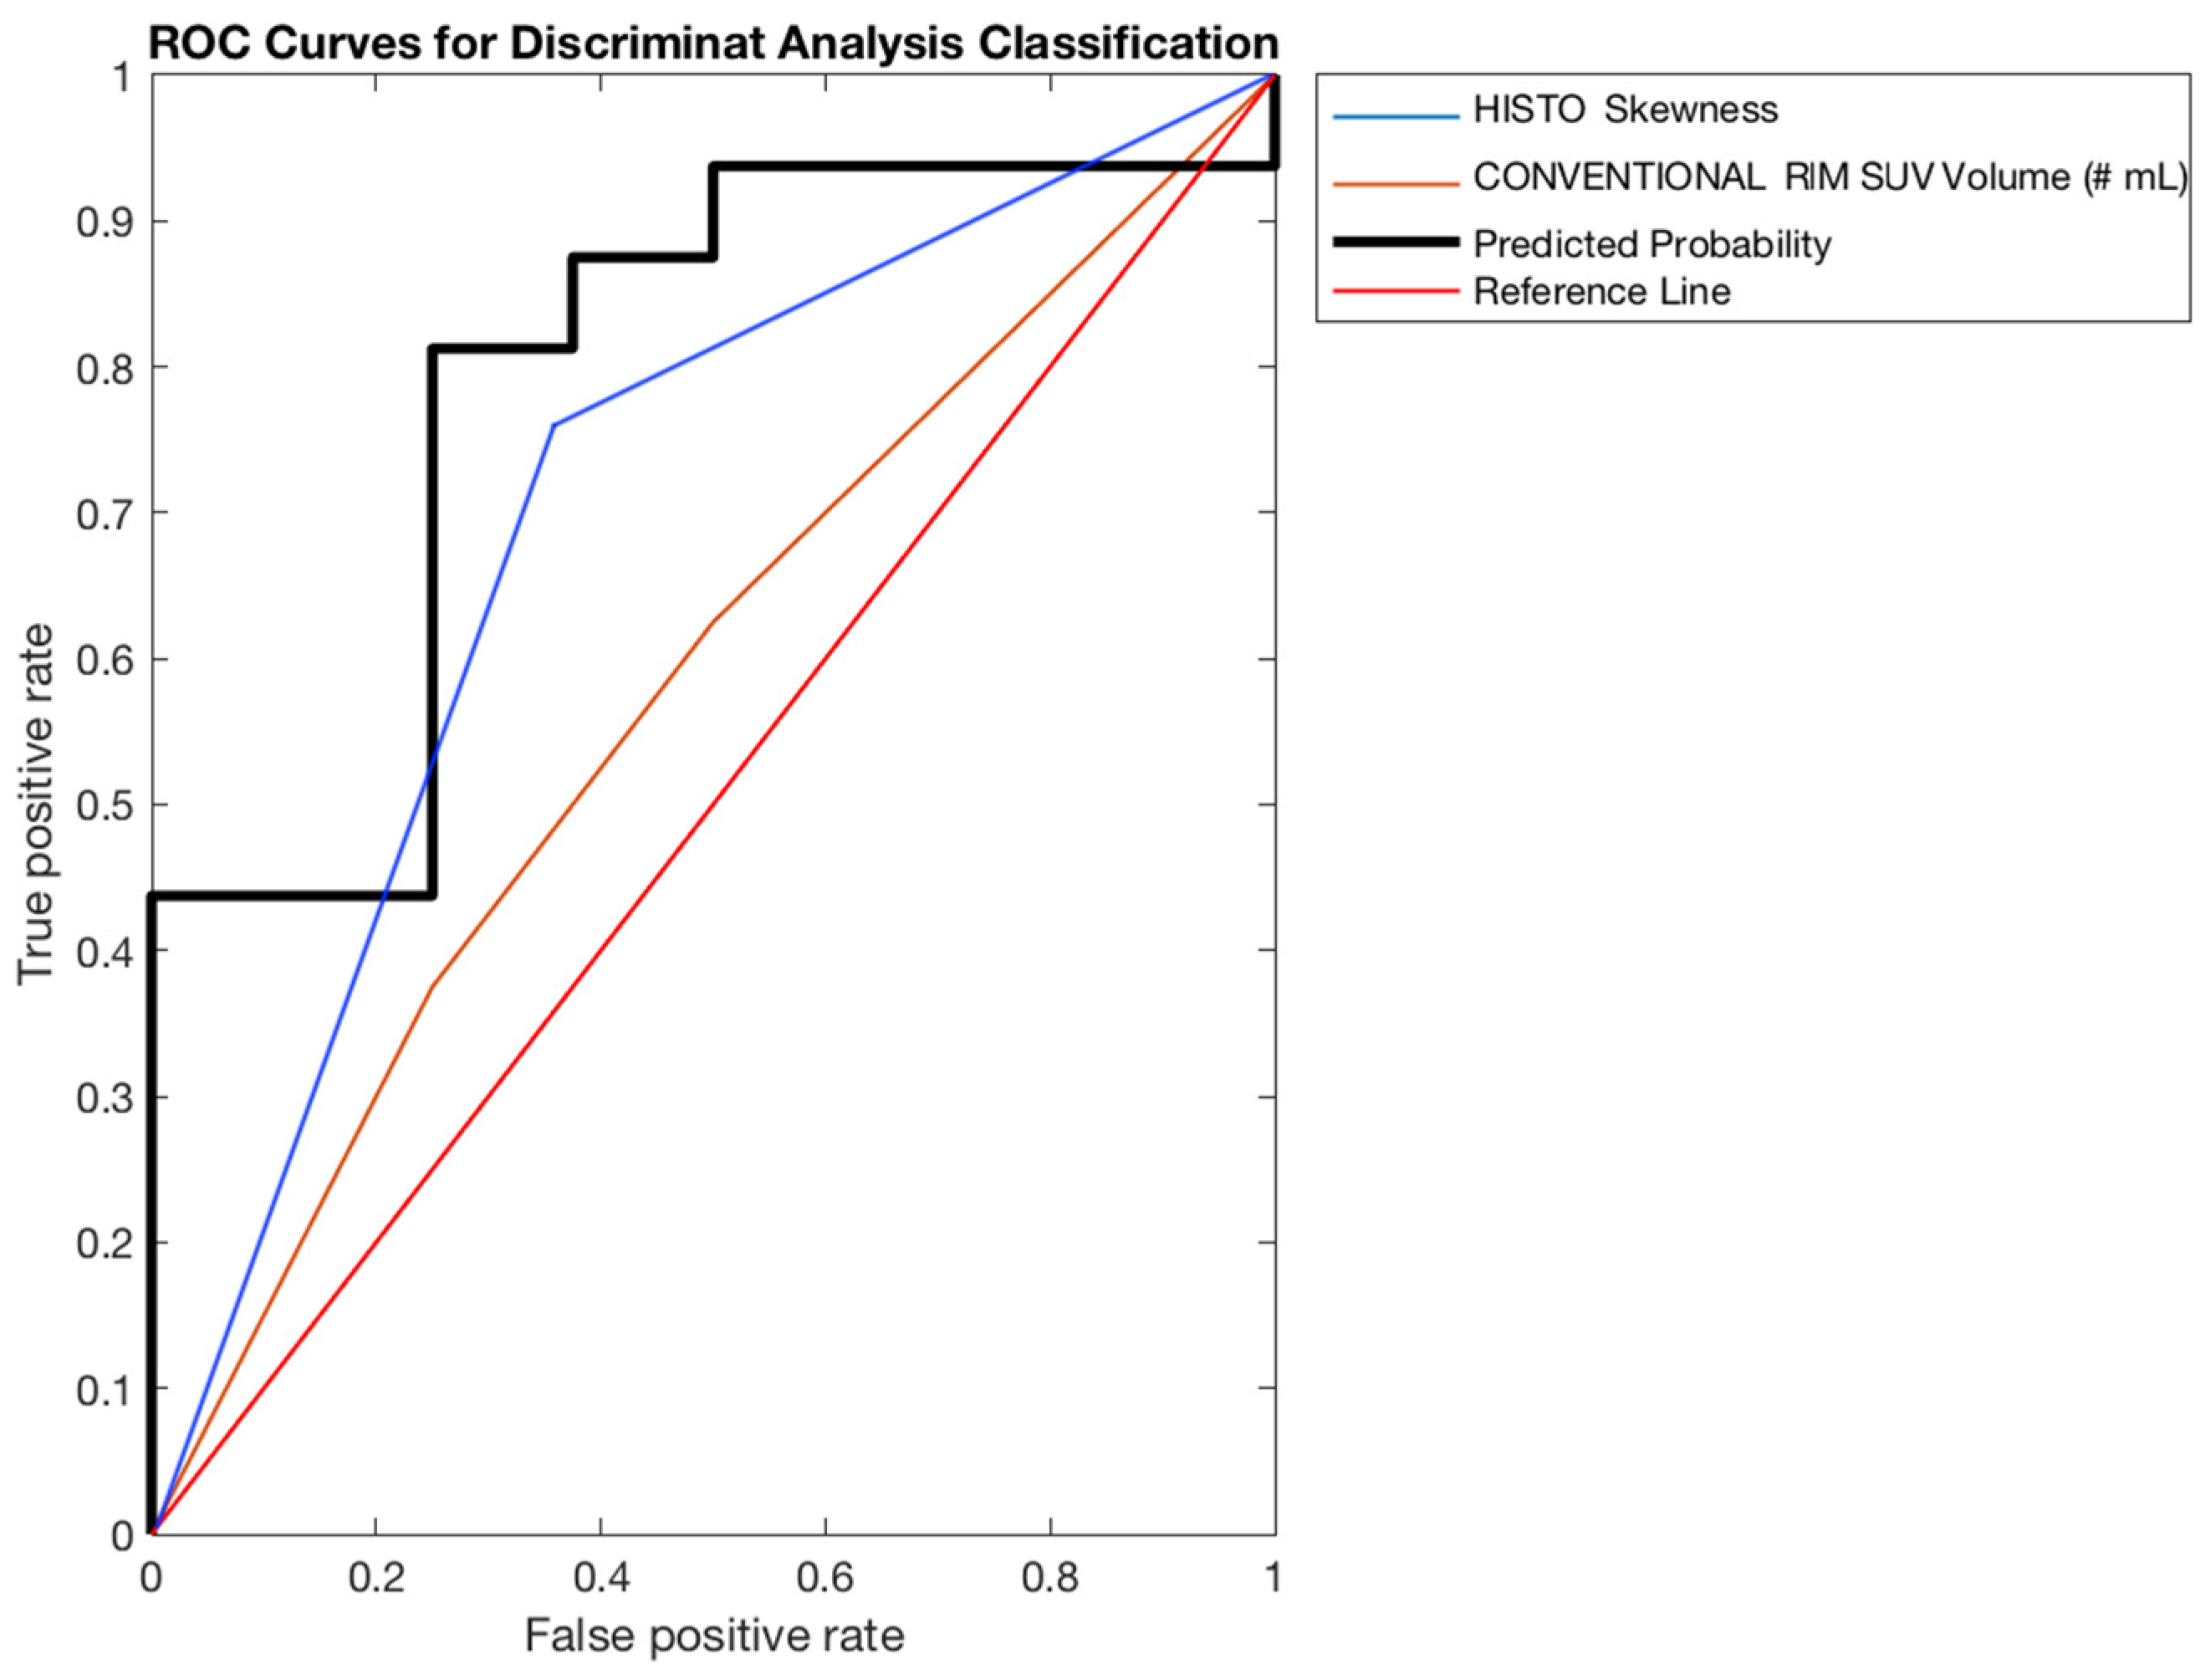
| SIEMENS | Histogram Skewness | 0.0136 |
| CONV RIM SUV Volume | 0.0136 |
| Tomograph | Features | p-Value |
|---|---|---|
| All patients | Shape Sphericity | 0.0314 |
| Shape Compacity | 0.0215 | |
| Histogram Kurtosis | 0.0232 | |
| GE | GLRLM LRLGE | 0.0481 |
| GLRLM LGRE | 0.117 | |
| SIEMENS | GLCM Correlation | 0.00036 |
| Shape Compacity | 0.0014 |
| Tomograph | Sensitivity | Specificity | Accuracy | AUC (95%CI) |
|---|---|---|---|---|
| All patients | 41.17% | 63.60% | 57.25% | 58.51% (41.75–75.27%) 62.80% (39.15–86.45%) 78.91% (58.80–99.01%) |
| GE | 28.52% | 88.47% | 71.64% | |
| SIEMENS | 76.67% | 71.81% | 72.88% |
| Tomograph | Sensitivity | Specificity | Accuracy | AUC (95%CI) |
|---|---|---|---|---|
| All patients | 52.44% | 76.62% | 70.31% | 64.13% (49.76–80.50%) 65.73% (40.04–89.43%) 78.91% (51.96–105.85%) |
| GE | 71.76% | 83.76% | 80.51% | |
| SIEMENS | 86.67% | 84.86% | 84.98% |
Publisher’s Note: MDPI stays neutral with regard to jurisdictional claims in published maps and institutional affiliations. |
© 2021 by the authors. Licensee MDPI, Basel, Switzerland. This article is an open access article distributed under the terms and conditions of the Creative Commons Attribution (CC BY) license (https://creativecommons.org/licenses/by/4.0/).
Share and Cite
Russo, G.; Stefano, A.; Alongi, P.; Comelli, A.; Catalfamo, B.; Mantarro, C.; Longo, C.; Altieri, R.; Certo, F.; Cosentino, S.; et al. Feasibility on the Use of Radiomics Features of 11[C]-MET PET/CT in Central Nervous System Tumours: Preliminary Results on Potential Grading Discrimination Using a Machine Learning Model. Curr. Oncol. 2021, 28, 5318-5331. https://doi.org/10.3390/curroncol28060444
Russo G, Stefano A, Alongi P, Comelli A, Catalfamo B, Mantarro C, Longo C, Altieri R, Certo F, Cosentino S, et al. Feasibility on the Use of Radiomics Features of 11[C]-MET PET/CT in Central Nervous System Tumours: Preliminary Results on Potential Grading Discrimination Using a Machine Learning Model. Current Oncology. 2021; 28(6):5318-5331. https://doi.org/10.3390/curroncol28060444
Chicago/Turabian StyleRusso, Giorgio, Alessandro Stefano, Pierpaolo Alongi, Albert Comelli, Barbara Catalfamo, Cristina Mantarro, Costanza Longo, Roberto Altieri, Francesco Certo, Sebastiano Cosentino, and et al. 2021. "Feasibility on the Use of Radiomics Features of 11[C]-MET PET/CT in Central Nervous System Tumours: Preliminary Results on Potential Grading Discrimination Using a Machine Learning Model" Current Oncology 28, no. 6: 5318-5331. https://doi.org/10.3390/curroncol28060444